North Druid Hills, GA (Georgia) Houses and Residents
Estimated median house or condo value in 2022: $538,184 (it was $214,600 in 2000 )
North Druid Hills:
$538,184Georgia:
$297,400
Lower value quartile - upper value quartile: $453,129 - $697,773Mean price in 2022: Detached houses: $738,381 Here:
$738,381State:
$376,364
Townhouses or other attached units: $427,577 Here:
$427,577State:
$341,709
In 3-to-4-unit structures: $189,153 Here:
$189,153State:
$250,092
In 5-or-more-unit structures: $243,201 Here:
$243,201State:
$370,730
Total population: 18,947 (Urban population: 18,852, Rural population: 0)
Houses: 9,452 (7,944 occupied: 2,985 owner occupied, 4,711 renter occupied )
% of renters here:
61%State:
34%
Housing density: 1,900 houses/condos per square mile
Median price asked for vacant for-sale houses and condos in 2022: $1,141,448.
Median contract rent in 2022: $1,761 (lower quartile is $1,411, upper quartile is over $2,000)
Median rent asked for vacant for-rent units in 2022: $2,066
Median gross rent in North Druid Hills, GA in 2022: $1,856
Housing units in North Druid Hills with a mortgage: 2,012 (115 second mortgage, 0 home equity loan, 130 both second mortgage and home equity loan )Houses without a mortgage: 0
Median household income for houses/condos with a mortgage: $155,569
Median household income for apartments without a mortgage: $109,022
Median monthly housing costs: $1,867
Data:
Median house or condo value ($)
Median house or condo value ($ change since 2000)
Median house or condo value ($) - White
Median house or condo value ($) - Black or African American
Median house or condo value ($) - Asian
Median house or condo value ($) - Hispanic or Latino
Median house or condo value ($) - American Indian and Alaska Native
Median house or condo value ($) - Multirace
Median house or condo value ($) - Other Race
Median price asked for mobile homes ($)
Household density (households per square mile)
Mean house or condo value by units in structure - 1, detached ($)
Mean house or condo value by units in structure - 1, attached ($)
Mean house or condo value by units in structure - 2 ($)
Mean house or condo value by units in structure by units in structure - 3 or 4 ($)
Mean house or condo value by units in structure - 5 or more ($)
Mean house or condo value by units in structure - Boat, RV, van, etc. ($)
Mean house or condo value by units in structure - Mobile home ($)
Median contract rent ($)
Median contract rent - Lower quartile ($)
Median contract rent - Upper quartile ($)
Median gross rent ($)
Urban houses (%)
Rural houses (%)
Houses occupied (%)
Houses occupied (% change since 2000)
Houses owner occupied (%)
Houses owner occupied (% change since 2000)
Houses renter occupied (%)
Houses renter occupied (% change since 2000)
Vacant housing units - For rent (%)
Vacant housing units - For rent (% change since 2000)
Vacant housing units - For sale only (%)
Vacant housing units - For sale only (% change since 2000)
Vacant housing units - Rented or sold, not occupied (%)
Vacant housing units - Rented or sold, not occupied (% change since 2000)
Vacant housing units - For seasonal, recreational, or occasional use (%)
Vacant housing units - For seasonal, recreational, or occasional use (% change since 2000)
Vacant housing units - For migrant workers (%)
Vacant housing units - For migrant workers (% change since 2000)
Vacant housing units - Other vacant (%)
Vacant housing units - Other vacant (% change since 2000)
Median monthly housing costs ($)
Median household income for houses/condos with a mortgage ($)
Median household income for houses/condos without a mortgage ($)
Median household income ($)
Median household income ($) - White
Median household income ($) - Black or African American
Median household income ($) - Asian
Median household income ($) - Hispanic or Latino
Median household income ($) - American Indian and Alaska Native
Median household income ($) - Multirace
Median household income ($) - Other Race
Mortgage status - with mortgage (%)
Mortgage status - with second mortgage (%)
Mortgage status - with home equity loan (%)
Mortgage status - with both second mortgage and home equity loan (%)
Mortgage status - without a mortgage (%)
Median year house/condo built
Median year apartment built
Household type by relationship - Male householder living alone (%)
Household type by relationship - Male householder not living alone (%)
Household type by relationship - Female householder living alone (%)
Household type by relationship - Female householder not living alone (%)
Household type by relationship - Opposite-Sex spouse (%)
Household type by relationship - Same-Sex spouse (%)
Household type by relationship - Opposite-Sex unmarried partner (%)
Household type by relationship - Same-Sex unmarried partner (%)
Household type by relationship - In group quarters (%)
Size of family households - 2-person household (%)
Size of family households - 3-person household (%)
Size of family households - 4-person household (%)
Size of family households - 5-person household (%)
Size of family households - 6-person household (%)
Size of family households - 7-or-more-person household (%)
Size of nonfamily households - 1-person household (%)
Size of nonfamily households - 2-person household (%)
Size of nonfamily households - 3-person household (%)
Size of nonfamily households - 4-person household (%)
Size of nonfamily households - 5-person household (%)
Size of nonfamily households - 6-person household (%)
Size of nonfamily households - 7-or-moreperson household (%)
Year house built - Built 2010 or later (%)
Year house built - Built 2000 to 2009 (%)
Year house built - Built 1990 to 1999 (%)
Year house built - Built 1980 to 1989 (%)
Year house built - Built 1970 to 1979 (%)
Year house built - Built 1960 to 1969 (%)
Year house built - Built 1950 to 1959 (%)
Year house built - Built 1940 to 1949 (%)
Year house built - Built 1939 or earlier (%)
Median number of rooms in houses and condos
Median number of rooms in apartments
Median number of bedrooms in owner occupied houses
Mean number of bedrooms in owner occupied houses
Median number of bedrooms in renter occupied houses
Mean number of bedrooms in renter occupied houses
Median number of vehichles in owner occupied houses
Mean number of vehichles in owner occupied houses
Median number of vehichles in renter occupied houses
Mean number of vehichles in renter occupied houses
Rooms in owner-occupied houses - 1 room (%)
Rooms in owner-occupied houses - 2 rooms (%)
Rooms in owner-occupied houses - 3 rooms (%)
Rooms in owner-occupied houses - 4 rooms (%)
Rooms in owner-occupied houses - 5 rooms (%)
Rooms in owner-occupied houses - 6 rooms (%)
Rooms in owner-occupied houses - 7 rooms (%)
Rooms in owner-occupied houses - 8 rooms (%)
Rooms in owner-occupied houses - 9+ rooms (%)
Rooms in renter-occupied houses - 1 room (%)
Rooms in renter-occupied houses - 2 rooms (%)
Rooms in renter-occupied houses - 3 rooms (%)
Rooms in renter-occupied houses - 4 rooms (%)
Rooms in renter-occupied houses - 5 rooms (%)
Rooms in renter-occupied houses - 6 rooms (%)
Rooms in renter-occupied houses - 7 rooms (%)
Rooms in renter-occupied houses - 8 rooms (%)
Rooms in renter-occupied houses - 9+ rooms (%)
Bedrooms in owner-occupied houses - no bedrooms (%)
Bedrooms in owner-occupied houses - 1 bedroom (%)
Bedrooms in owner-occupied houses - 2 bedrooms (%)
Bedrooms in owner-occupied houses - 3 bedrooms (%)
Bedrooms in owner-occupied houses - 4 bedrooms (%)
Bedrooms in owner-occupied houses - 5+ bedrooms (%)
Bedrooms in renter-occupied houses - no bedrooms (%)
Bedrooms in renter-occupied houses - 1 bedroom (%)
Bedrooms in renter-occupied houses - 2 bedrooms (%)
Bedrooms in renter-occupied houses - 3 bedrooms (%)
Bedrooms in renter-occupied houses - 4 bedrooms (%)
Bedrooms in renter-occupied houses - 5+ bedrooms (%)
Vehicles available in owner-occupied houses - no vehicle available (%)
Vehicles available in owner-occupied houses - 1 vehicle available(%)
Vehicles available in owner-occupied houses - 2 Vehicles available (%)
Vehicles available in owner-occupied houses - 3 Vehicles available (%)
Vehicles available in owner-occupied houses - 4 Vehicles available (%)
Vehicles available in owner-occupied houses - 5+ Vehicles available (%)
Vehicles available in renter-occupied houses - no vehicle available (%)
Vehicles available in renter-occupied houses - 1 vehicle available (%)
Vehicles available in renter-occupied houses - 2 Vehicles available (%)
Vehicles available in renter-occupied houses - 3 Vehicles available (%)
Vehicles available in renter-occupied houses - 4 Vehicles available (%)
Vehicles available in renter-occupied houses - 5+ Vehicles available (%)
Housing units in structures - 1, detached (%)
Housing units in structures - 1, attached (%)
Housing units in structures - 2 (%)
Housing units in structures - 3 or 4 (%)
Housing units in structures - 5 to 9 (%)
Housing units in structures - 10 to 19 (%)
Housing units in structures - 20 to 49 (%)
Housing units in structures - 50 or more (%)
Housing units in structures - Mobile home (%)
Housing units in structures - Boat, RV, van, etc. (%)
Housing units in structures - Owners - 1, detached (%)
Housing units in structures - Owners - 1, attached (%)
Housing units in structures - Owners - 2 (%)
Housing units in structures - Owners - 3 or 4 (%)
Housing units in structures - Owners - 5 to 9 (%)
Housing units in structures - Owners - 10 to 19 (%)
Housing units in structures - Owners - 20 to 49 (%)
Housing units in structures - Owners - 50 or more (%)
Housing units in structures - Owners - Mobile home (%)
Housing units in structures - Owners - Boat, RV, van, etc. (%)
Housing units in structures - Renters - 1, detached (%)
Housing units in structures - Renters - 1, attached (%)
Housing units in structures - Renters - 2 (%)
Housing units in structures - Renters - 3 or 4 (%)
Housing units in structures - Renters - 5 to 9 (%)
Housing units in structures - Renters - 10 to 19 (%)
Housing units in structures - Renters - 20 to 49 (%)
Housing units in structures - Renters - 50 or more (%)
Housing units in structures - Renters - Mobile home (%)
Housing units in structures - Renters - Boat, RV, van, etc. (%)
House/condo owner moved in on average (years ago)
Renter moved in on average (years ago)
Year householder moved into unit - Moved in 1999 to March 2000 (%)
Year householder moved into unit - Moved in 1999 to March 2000 (%) - White
Year householder moved into unit - Moved in 1999 to March 2000 (%) - Black or African American
Year householder moved into unit - Moved in 1999 to March 2000 (%) - Asian
Year householder moved into unit - Moved in 1999 to March 2000 (%) - Hispanic or Latino
Year householder moved into unit - Moved in 1999 to March 2000 (%) - American Indian and Alaska Native
Year householder moved into unit - Moved in 1999 to March 2000 (%) - Multirace
Year householder moved into unit - Moved in 1999 to March 2000 (%) - Other Race
Year householder moved into unit - Moved in 1995 to 1998 (%)
Year householder moved into unit - Moved in 1995 to 1998 (%) - White
Year householder moved into unit - Moved in 1995 to 1998 (%) - Black or African American
Year householder moved into unit - Moved in 1995 to 1998 (%) - Asian
Year householder moved into unit - Moved in 1995 to 1998 (%) - Hispanic or Latino
Year householder moved into unit - Moved in 1995 to 1998 (%) - American Indian and Alaska Native
Year householder moved into unit - Moved in 1995 to 1998 (%) - Multirace
Year householder moved into unit - Moved in 1995 to 1998 (%) - Other Race
Year householder moved into unit - Moved in 1990 to 1994 (%)
Year householder moved into unit - Moved in 1990 to 1994 (%) - White
Year householder moved into unit - Moved in 1990 to 1994 (%) - Black or African American
Year householder moved into unit - Moved in 1990 to 1994 (%) - Asian
Year householder moved into unit - Moved in 1990 to 1994 (%) - Hispanic or Latino
Year householder moved into unit - Moved in 1990 to 1994 (%) - American Indian and Alaska Native
Year householder moved into unit - Moved in 1990 to 1994 (%) - Multirace
Year householder moved into unit - Moved in 1990 to 1994 (%) - Other Race
Year householder moved into unit - Moved in 1980 to 1989 (%)
Year householder moved into unit - Moved in 1980 to 1989 (%) - White
Year householder moved into unit - Moved in 1980 to 1989 (%) - Black or African American
Year householder moved into unit - Moved in 1980 to 1989 (%) - Asian
Year householder moved into unit - Moved in 1980 to 1989 (%) - Hispanic or Latino
Year householder moved into unit - Moved in 1980 to 1989 (%) - American Indian and Alaska Native
Year householder moved into unit - Moved in 1980 to 1989 (%) - Multirace
Year householder moved into unit - Moved in 1980 to 1989 (%) - Other Race
Year householder moved into unit - Moved in 1970 to 1979 (%)
Year householder moved into unit - Moved in 1970 to 1979 (%) - White
Year householder moved into unit - Moved in 1970 to 1979 (%) - Black or African American
Year householder moved into unit - Moved in 1970 to 1979 (%) - Asian
Year householder moved into unit - Moved in 1970 to 1979 (%) - Hispanic or Latino
Year householder moved into unit - Moved in 1970 to 1979 (%) - American Indian and Alaska Native
Year householder moved into unit - Moved in 1970 to 1979 (%) - Multirace
Year householder moved into unit - Moved in 1970 to 1979 (%) - Other Race
Year householder moved into unit - Moved in 1969 or earlier (%)
Year householder moved into unit - Moved in 1969 or earlier (%) - White
Year householder moved into unit - Moved in 1969 or earlier (%) - Black or African American
Year householder moved into unit - Moved in 1969 or earlier (%) - Asian
Year householder moved into unit - Moved in 1969 or earlier (%) - Hispanic or Latino
Year householder moved into unit - Moved in 1969 or earlier (%) - American Indian and Alaska Native
Year householder moved into unit - Moved in 1969 or earlier (%) - Multirace
Year householder moved into unit - Moved in 1969 or earlier (%) - Other Race
Housing units lacking complete plumbing facilities (%)
Housing units lacking complete kitchen facilities (%)
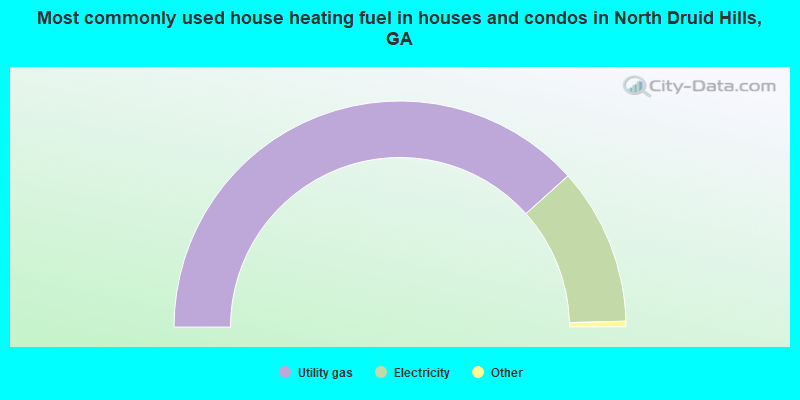
House heating fuel used in houses and condos - Utility gas (%)
House heating fuel used in houses and condos - Bottled, tank, or LP gas (%)
House heating fuel used in houses and condos - Electricity (%)
House heating fuel used in houses and condos - Fuel oil, kerosene, etc. (%)
House heating fuel used in houses and condos - Coal or coke (%)
House heating fuel used in houses and condos - Wood (%)
House heating fuel used in houses and condos - Solar energy (%)
House heating fuel used in houses and condos - Other fuel (%)
House heating fuel used in houses and condos - No fuel used (%)
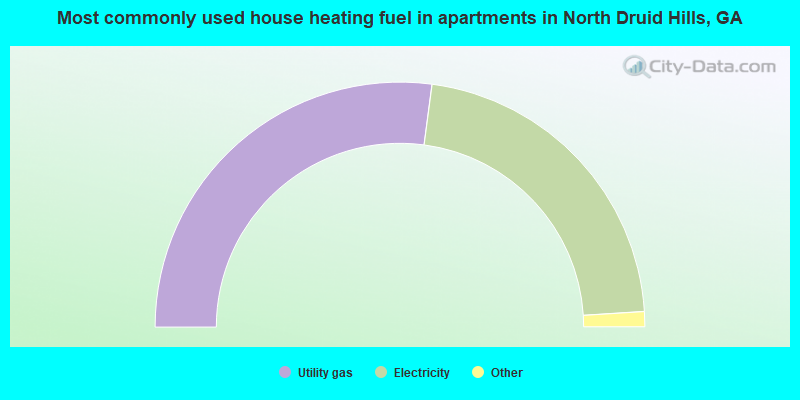
House heating fuel used in apartments - Utility gas (%)
House heating fuel used in apartments - Bottled, tank, or LP gas (%)
House heating fuel used in apartments - Electricity (%)
House heating fuel used in apartments - Fuel oil, kerosene, etc. (%)
House heating fuel used in apartments - Coal or coke (%)
House heating fuel used in apartments - Wood (%)
House heating fuel used in apartments - Solar energy (%)
House heating fuel used in apartments - Other fuel (%)
House heating fuel used in apartments - No fuel used (%)
Median year house/condo built: 1967Median year apartment built: 1990Household type by relationship:
Households: 17,277
Male householders: 3,813 (1,472 living alone ), Female householders: 4,033 (1,839 living alone )2,305 spouses (2,260 opposite-sex spouses ), 808 unmarried partners , (686 opposite-sex unmarried partners ), 3,365 children (3,288 natural , 57 adopted , 19 stepchildren ), 73 grandchildren , 183 brothers or sisters , 274 parents , 0 foster children , 143 other relatives , 1,882 non-relatives In group quarters: 393
Size of family households: 1,619 2-persons , 696 3-persons , 331 4-persons , 260 5-persons , 79 6-persons , 15 7-or-more-persons .
Size of nonfamily households: 3,081 1-person , 1,438 2-persons , 180 3-persons , 8 4-persons , 21 5-persons , 6 6-persons .
2,149 married couples with children. single-parent households (143 men , 328 women ).
77.8% of residents of North Druid Hills speak English at home. of residents speak Spanish at home (91% speak English very well , 4% speak English well , 5% speak English not well ).of residents speak other Indo-European language at home (87% speak English very well , 8% speak English well , 5% speak English not well ).of residents speak Asian or Pacific Island language at home (68% speak English very well , 29% speak English well , 4% speak English not well ).of residents speak other language at home (76% speak English very well , 24% speak English well ).
Foreign born population: 2,810 (16.3%)of them are naturalized citizens )
Median number of rooms in houses and condos:
Median number of rooms in apartments
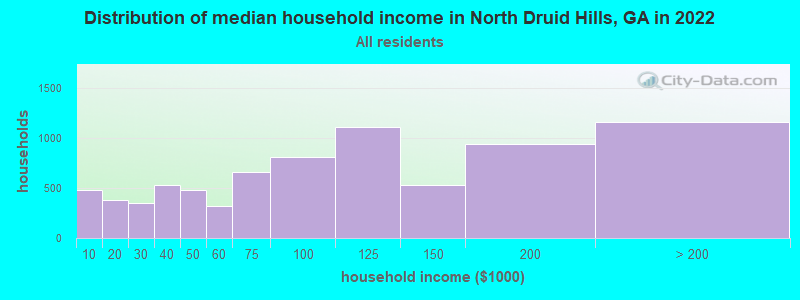
North Druid Hills, GA household income distribution 476 Less than $10,000384 $10,000 to $19,999349 $20,000 to $29,999528 $30,000 to $39,999483 $40,000 to $49,999319 $50,000 to $59,999655 $60,000 to $74,999814 $75,000 to $99,9991,106 $100,000 to $124,999527 $125,000 to $149,999943 $150,000 to $199,9991,159 $200,000 or more
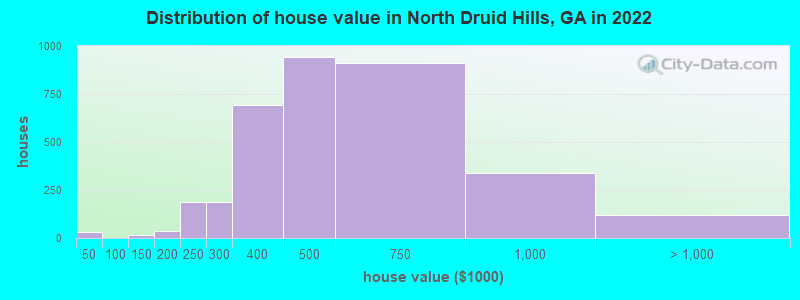
Home value of owner - occupied houses in 2022 in North Druid Hills, GA 15 Less than $10,00015 $25,000 to $29,99914 $100,000 to $124,99916 $150,000 to $174,99922 $175,000 to $199,999186 $200,000 to $249,999185 $250,000 to $299,999692 $300,000 to $399,999940 $400,000 to $499,999911 $500,000 to $749,999340 $750,000 to $999,99993 $1,000,000 to $1,499,99926 $2,000,000 or moreRent paid by renters in 2022 in North Druid Hills, GA 7 Less than $10029 $200 to $24950 $300 to $34916 $450 to $49919 $750 to $79967 $800 to $89947 $900 to $999458 $1,000 to $1,249837 $1,250 to $1,4992,435 $1,500 to $1,999587 $2,000 to $2,499233 $2,500 to $2,999149 $3,500 or more85 No cash rent
Percentage of workers working in this county: 56.4%Number of people working at home: 2,552 (26.3% of all workers )
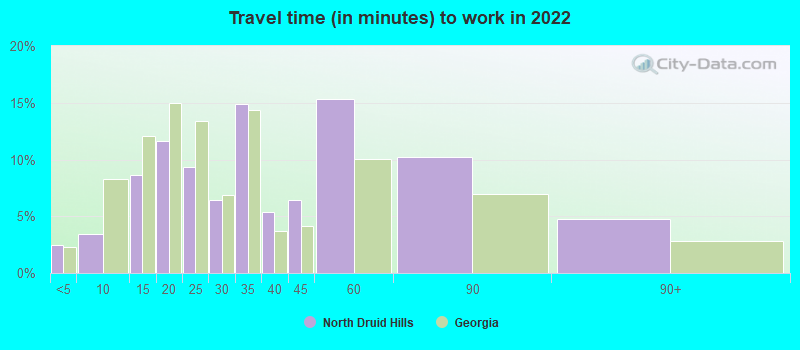
Travel time to work (commute)
Less than 5 minutes: 2755 to 9 minutes: 34710 to 14 minutes: 82715 to 19 minutes: 1,32620 to 24 minutes: 1,17225 to 29 minutes: 48330 to 34 minutes: 1,40135 to 39 minutes: 47740 to 44 minutes: 20045 to 59 minutes: 53960 to 89 minutes: 13290 or more minutes: 40
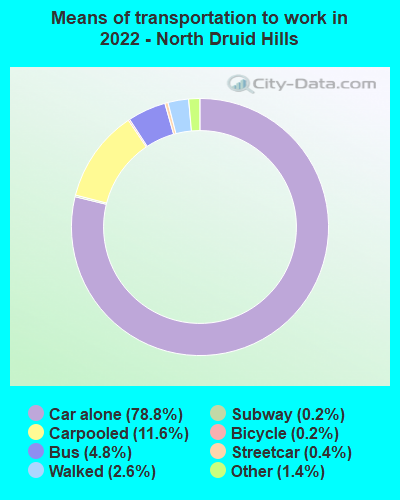
Means of transportation to work:
Drove a car alone: 7,923 (62.9%)Carpooled: 1,053 (8.4%)Bus : 391 (3.1%)Subway or elevated rail : 19 (0.2%)Long-distance train or commuter rail : 10 (0.1%)Taxi: 124 (1.0%)Bicycle: 34 (0.3%)Walked: 301 (2.4%)Worked at home: 2,552 (20.2%)
Unemployment by race in 2022
Unemployment rate for White non-Hispanic residents 3.2% Males1.1% FemalesUnemployment rate for Black residents 6.2% Males2.9% FemalesUnemployment rate for Hispanic or Latino residents 4.3% Males
Year of entry for the foreign-born population in North Druid Hills, Georgia
1,400 2010 or later 453 2000 to 2009 356 1990 to 1999 433 1980 to 1989 295 1970 to 1979 432 Before 1970
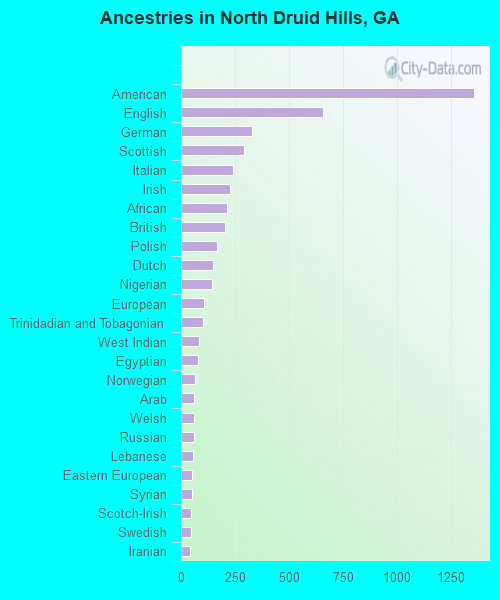
First ancestries reported:
American: 1,360 (13.6%)
English: 658 (6.6%)
German: 327 (3.3%)
Scottish: 292 (2.9%)
Italian: 243 (2.4%)
Irish: 228 (2.3%)
African: 213 (2.1%)
British: 203 (2.0%)
Polish: 166 (1.7%)
Dutch: 148 (1.5%)
Nigerian: 144 (1.4%)
European: 105 (1.0%)
Trinidadian and Tobagonian: 103 (1.0%)
West Indian: 84 (0.8%)
Egyptian: 80 (0.8%)
Norwegian: 66 (0.7%)
Arab: 62 (0.6%)
Welsh: 62 (0.6%)
Russian: 59 (0.6%)
Lebanese: 57 (0.6%)
Eastern European: 50 (0.5%)
Syrian: 49 (0.5%)
Scotch-Irish: 46 (0.5%)
Swedish: 46 (0.5%)
Iranian: 40 (0.4%)
French Canadian: 37 (0.4%)
Hungarian: 31 (0.3%)
Greek: 30 (0.3%)
Romanian: 29 (0.3%)
Israeli: 28 (0.3%)
Ugandan: 25 (0.2%)
Finnish: 24 (0.2%)
Slavic: 24 (0.2%)
South African: 24 (0.2%)
Bulgarian: 18 (0.2%)
Jamaican: 18 (0.2%)
French: 17 (0.2%)
Turkish: 17 (0.2%)
Ukrainian: 16 (0.2%)
Afghan: 11 (0.1%)
Northern European: 11 (0.1%)
Lithuanian: 6 (0.06%)
Czech: 3 (0.03%) Most common places of birth for foreign-born residents (%): China, excluding Hong Kong and Taiwan North Druid Hills:
20.4% (616)Georgia:
3.5% (39,227)
India North Druid Hills:
8.0% (241)Georgia:
9.2% (103,325)
Korea North Druid Hills:
5.3% (160)Georgia:
3.9% (43,756)
Colombia North Druid Hills:
4.3% (130)Georgia:
2.1% (23,813)
Venezuela North Druid Hills:
3.9% (118)Georgia:
1.7% (19,012)
Cuba North Druid Hills:
3.4% (103)Georgia:
1.2% (12,946)
Ethiopia North Druid Hills:
3.3% (99)Georgia:
1.6% (17,643)
Trinidad and Tobago North Druid Hills:
3.0% (92)Georgia:
0.8% (8,684)
Nigeria North Druid Hills:
2.6% (77)Georgia:
2.5% (27,846)
Other Caribbean North Druid Hills:
2.4% (73)Georgia:
0.4% (4,066)
Taiwan North Druid Hills:
2.2% (67)Georgia:
0.6% (6,160)
Hong Kong North Druid Hills:
2.2% (65)Georgia:
0.2% (2,214)
Morocco North Druid Hills:
2.1% (64)Georgia:
0.1% (1,657)
Italy North Druid Hills:
2.0% (60)Georgia:
0.2% (2,552)
Jamaica North Druid Hills:
1.9% (57)Georgia:
4.6% (51,270)
Cambodia North Druid Hills:
1.9% (56)Georgia:
0.3% (2,808)
Romania North Druid Hills:
1.8% (55)Georgia:
0.6% (6,388)
Tanzania North Druid Hills:
1.8% (53)Georgia:
0.1% (927)
Uganda North Druid Hills:
1.8% (53)Georgia:
0.2% (2,337)
United Kingdom, excluding England and Scotland North Druid Hills:
1.7% (51)Georgia:
0.8% (9,101)
Mexico North Druid Hills:
1.7% (50)Georgia:
20.0% (223,400)
Israel North Druid Hills:
1.6% (48)Georgia:
0.2% (2,671)
Place of birth for U.S.-born residents:
This state: 5,578Other state: 8,462Northeast: 1,679Midwest: 1,775South: 3,381West: 1,613 78.2% of North Druid Hills residents lived in the same house 1 years ago.
Out of people who lived in different houses, 26.9% lived in this county.
Out of people who lived in different counties, 65.4% lived in Georgia.
North Druid Hills:
78.2%State average:
86.6%
Education attainment for males 25 years and older:
No schooling: 133Nursery to 4th grade: 05th and 6th grade: 07th and 8th grade: 09th grade: 2110th grade: 811th grade: 2612th grade, no diploma: 32High school graduate (or equivalency): 713Less than 1 year of college: 224Some college more than 1 year, no degree: 627Associate degree: 235Bachelor's degree: 1,927Master's degree: 1,020Professional school degree: 671Doctorate degree: 398
Education attainment for females 25 years and older:
No schooling: 69Nursery to 4th grade: 165th and 6th grade: 07th and 8th grade: 109th grade: 1310th grade: 2011th grade: 912th grade, no diploma: 33High school graduate (or equivalency): 541Less than 1 year of college: 101Some college more than 1 year, no degree: 198Associate degree: 260Bachelor's degree: 2,698Master's degree: 1,617Professional school degree: 324Doctorate degree: 486
Housing units in structures:
One, detached: 2,694One, attached: 927Two: 123 or 4: 6185 to 9: 1,12110 to 19: 1,29520 to 49: 1,48550 or more: 1,283Mobile homes: 13Housing units lacking complete plumbing facilities in 2022: 0.4%Housing units lacking complete kitchen facilities in 2022: 0.9%House/condo owner moved in on average 7 years ago
Renter moved in on average 1 years ago
Private vs. public school enrollment:
Students in private schools in grades 1 to 8 (elementary and middle school): 575 Students in private schools in grades 9 to 12 (high school): 212 Students in private undergraduate colleges: 178