Races in North Druid Hills, Georgia (GA) Detailed Stats
Data:
Races - White alone (%)
Races - White alone (% change since 2000)
Races - Black alone (%)
Races - Black alone (% change since 2000)
Races - American Indian alone (%)
Races - American Indian alone (% change since 2000)
Races - Asian alone (%)
Races - Asian alone (% change since 2000)
Races - Hispanic (%)
Races - Hispanic (% change since 2000)
Races - Native Hawaiian and Other Pacific Islander alone (%)
Races - Native Hawaiian and Other Pacific Islander alone (% change since 2000)
Races - Two or more races(%)
Races - Two or more races(% change since 2000)
Races - Other race alone (%)
Races - Other race alone (% change since 2000)
Racial diversity
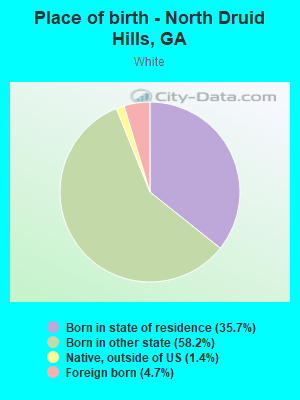
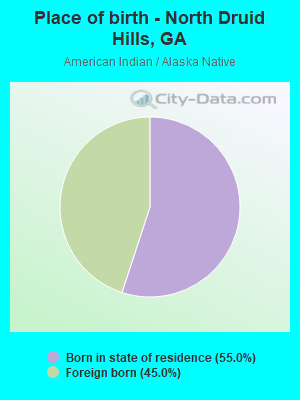
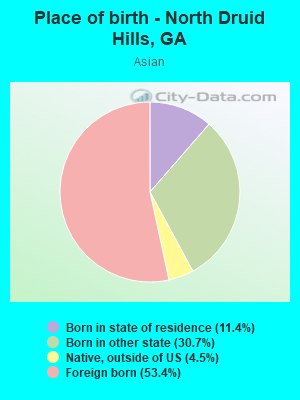
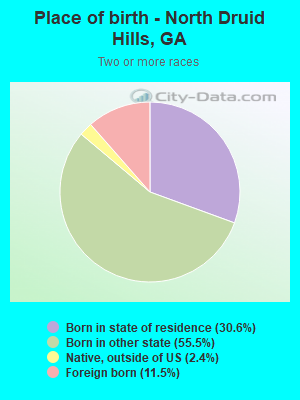
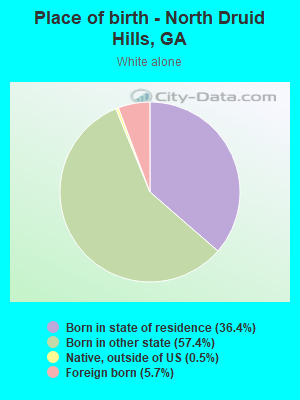
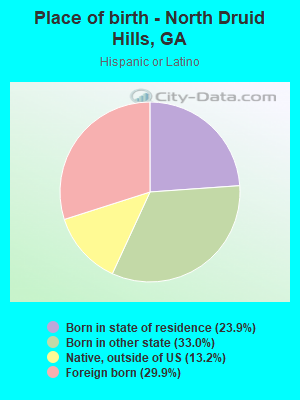
Place of birth - Born in state of residence (%)
Place of birth - Born in state of residence (%) - White
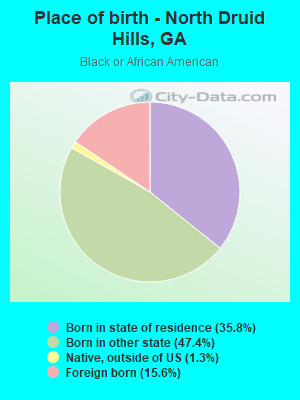
Place of birth - Born in state of residence (%) - Black or African American
Place of birth - Born in state of residence (%) - Asian
Place of birth - Born in state of residence (%) - Hispanic or Latino
Place of birth - Born in state of residence (%) - American Indian and Alaska Native
Place of birth - Born in state of residence (%) - Multirace
Place of birth - Born in state of residence (%) - Other Race
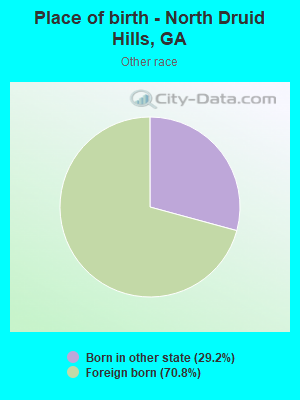
Place of birth - Born in other state (%)
Place of birth - Born in other state (%) - White
Place of birth - Born in other state (%) - Black or African American
Place of birth - Born in other state (%) - Asian
Place of birth - Born in other state (%) - Hispanic or Latino
Place of birth - Born in other state (%) - American Indian and Alaska Native
Place of birth - Born in other state (%) - Multirace
Place of birth - Born in other state (%) - Other Race
Place of birth - Native, outside of US (%)
Place of birth - Native, outside of US (%) - White
Place of birth - Native, outside of US (%) - Black or African American
Place of birth - Native, outside of US (%) - Asian
Place of birth - Native, outside of US (%) - Hispanic or Latino
Place of birth - Native, outside of US (%) - American Indian and Alaska Native
Place of birth - Native, outside of US (%) - Multirace
Place of birth - Native, outside of US (%) - Other Race
Place of birth - Foreign born (%)
Place of birth - Foreign born (%) - White
Place of birth - Foreign born (%) - Black or African American
Place of birth - Foreign born (%) - Asian
Place of birth - Foreign born (%) - Hispanic or Latino
Place of birth - Foreign born (%) - American Indian and Alaska Native
Place of birth - Foreign born (%) - Multirace
Place of birth - Foreign born (%) - Other Race
Residents speaking English at home (%)
Residents speaking English at home - Born in the United States (%)
Residents speaking English at home - Native, born elsewhere (%)
Residents speaking English at home - Foreign born (%)
Residents speaking Spanish at home (%)
Residents speaking Spanish at home - Born in the United States (%)
Residents speaking Spanish at home - Native, born elsewhere (%)
Residents speaking Spanish at home - Foreign born (%)
Residents speaking other language at home (%)
Residents speaking other language at home - Born in the United States (%)
Residents speaking other language at home - Native, born elsewhere (%)
Residents speaking other language at home - Foreign born (%)
Marital status - Never married (%)
Marital status - Now married (%)
Marital status - Separated (%)
Marital status - Widowed (%)
Marital status - Divorced (%)
Ancestries Reported - Arab (%)
Ancestries Reported - Czech (%)
Ancestries Reported - Danish (%)
Ancestries Reported - Dutch (%)
Ancestries Reported - English (%)
Ancestries Reported - French (%)
Ancestries Reported - French Canadian (%)
Ancestries Reported - German (%)
Ancestries Reported - Greek (%)
Ancestries Reported - Hungarian (%)
Ancestries Reported - Irish (%)
Ancestries Reported - Italian (%)
Ancestries Reported - Lithuanian (%)
Ancestries Reported - Norwegian (%)
Ancestries Reported - Polish (%)
Ancestries Reported - Portuguese (%)
Ancestries Reported - Russian (%)
Ancestries Reported - Scotch-Irish (%)
Ancestries Reported - Scottish (%)
Ancestries Reported - Slovak (%)
Ancestries Reported - Subsaharan African (%)
Ancestries Reported - Swedish (%)
Ancestries Reported - Swiss (%)
Ancestries Reported - Ukrainian (%)
Ancestries Reported - United States (%)
Ancestries Reported - Welsh (%)
Ancestries Reported - West Indian (%)
Ancestries Reported - Other (%)
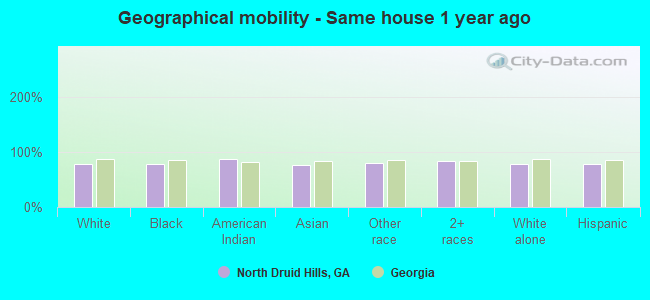
Geographical mobility - Same house 1 year ago (%)
Geographical mobility - Same house 1 year ago (%) - White
Geographical mobility - Same house 1 year ago (%) - Black or African American
Geographical mobility - Same house 1 year ago (%) - Asian
Geographical mobility - Same house 1 year ago (%) - Hispanic or Latino
Geographical mobility - Same house 1 year ago (%) - American Indian and Alaska Native
Geographical mobility - Same house 1 year ago (%) - Multirace
Geographical mobility - Same house 1 year ago (%) - Other Race
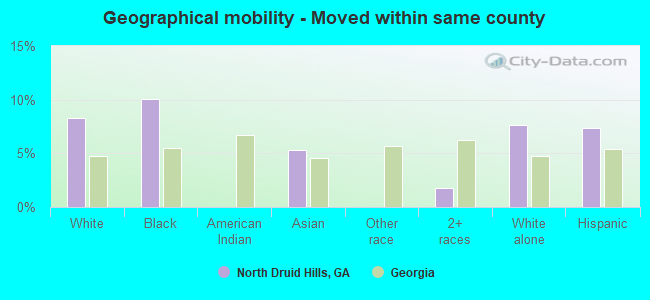
Geographical mobility - Moved within same county (%)
Geographical mobility - Moved within same county (%) - White
Geographical mobility - Moved within same county (%) - Black or African American
Geographical mobility - Moved within same county (%) - Asian
Geographical mobility - Moved within same county (%) - Hispanic or Latino
Geographical mobility - Moved within same county (%) - American Indian and Alaska Native
Geographical mobility - Moved within same county (%) - Multirace
Geographical mobility - Moved within same county (%) - Other Race
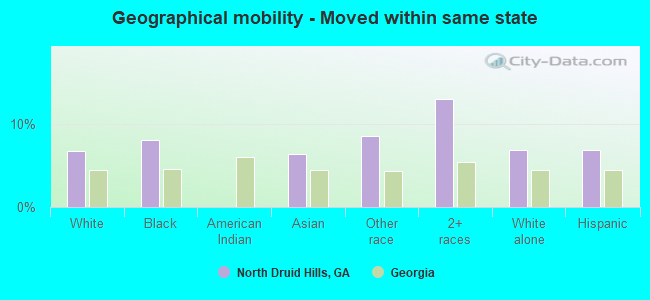
Geographical mobility - Moved from different county within same state (%)
Geographical mobility - Moved from different county within same state (%) - White
Geographical mobility - Moved from different county within same state (%) - Black or African American
Geographical mobility - Moved from different county within same state (%) - Asian
Geographical mobility - Moved from different county within same state (%) - Hispanic or Latino
Geographical mobility - Moved from different county within same state (%) - American Indian and Alaska Native
Geographical mobility - Moved from different county within same state (%) - Multirace
Geographical mobility - Moved from different county within same state (%) - Other Race
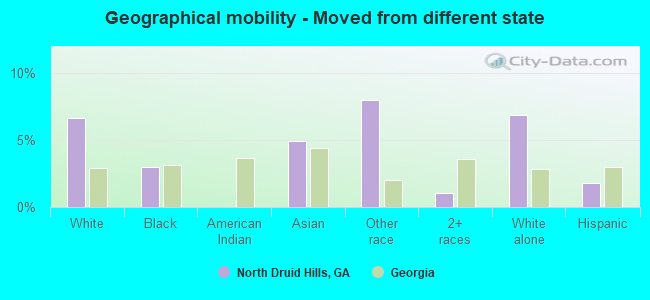
Geographical mobility - Moved from different state (%)
Geographical mobility - Moved from different state (%) - White
Geographical mobility - Moved from different state (%) - Black or African American
Geographical mobility - Moved from different state (%) - Asian
Geographical mobility - Moved from different state (%) - Hispanic or Latino
Geographical mobility - Moved from different state (%) - American Indian and Alaska Native
Geographical mobility - Moved from different state (%) - Multirace
Geographical mobility - Moved from different state (%) - Other Race
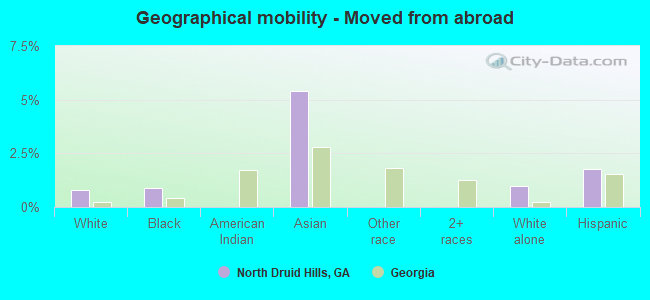
Geographical mobility - Moved from abroad (%)
Geographical mobility - Moved from abroad (%) - White
Geographical mobility - Moved from abroad (%) - Black or African American
Geographical mobility - Moved from abroad (%) - Asian
Geographical mobility - Moved from abroad (%) - Hispanic or Latino
Geographical mobility - Moved from abroad (%) - American Indian and Alaska Native
Geographical mobility - Moved from abroad (%) - Multirace
Geographical mobility - Moved from abroad (%) - Other Race
Place of birth for the foreign-born population - Ireland (%)
Place of birth for the foreign-born population - Denmark (%)
Place of birth for the foreign-born population - Norway (%)
Place of birth for the foreign-born population - Sweden (%)
Place of birth for the foreign-born population - United Kingdom (%)
Place of birth for the foreign-born population - England (%)
Place of birth for the foreign-born population - Scotland (%)
Place of birth for the foreign-born population - Other Northern Europe (%)
Place of birth for the foreign-born population - Austria (%)
Place of birth for the foreign-born population - Belgium (%)
Place of birth for the foreign-born population - France (%)
Place of birth for the foreign-born population - Germany (%)
Place of birth for the foreign-born population - Netherlands (%)
Place of birth for the foreign-born population - Switzerland (%)
Place of birth for the foreign-born population - Other Western Europe (%)
Place of birth for the foreign-born population - Greece (%)
Place of birth for the foreign-born population - Italy (%)
Place of birth for the foreign-born population - Portugal (%)
Place of birth for the foreign-born population - Spain (%)
Place of birth for the foreign-born population - Other Southern Europe (%)
Place of birth for the foreign-born population - Albania (%)
Place of birth for the foreign-born population - Belarus (%)
Place of birth for the foreign-born population - Bosnia and Herzegovina (%)
Place of birth for the foreign-born population - Bulgaria (%)
Place of birth for the foreign-born population - Croatia (%)
Place of birth for the foreign-born population - Czechoslovakia (%)
Place of birth for the foreign-born population - Hungary (%)
Place of birth for the foreign-born population - Latvia (%)
Place of birth for the foreign-born population - Lithuania (%)
Place of birth for the foreign-born population - North Macedonia (Macedonia) (%)
Place of birth for the foreign-born population - Moldova (%)
Place of birth for the foreign-born population - Poland (%)
Place of birth for the foreign-born population - Romania (%)
Place of birth for the foreign-born population - Russia (%)
Place of birth for the foreign-born population - Serbia (%)
Place of birth for the foreign-born population - Ukraine (%)
Place of birth for the foreign-born population - Other Eastern Europe (%)
Place of birth for the foreign-born population - China (%)
Place of birth for the foreign-born population - Hong Kong (%)
Place of birth for the foreign-born population - Taiwan (%)
Place of birth for the foreign-born population - Japan (%)
Place of birth for the foreign-born population - Korea (%)
Place of birth for the foreign-born population - Other Eastern Asia (%)
Place of birth for the foreign-born population - Afghanistan (%)
Place of birth for the foreign-born population - Bangladesh (%)
Place of birth for the foreign-born population - India (%)
Place of birth for the foreign-born population - Iran (%)
Place of birth for the foreign-born population - Kazakhstan (%)
Place of birth for the foreign-born population - Nepal (%)
Place of birth for the foreign-born population - Pakistan (%)
Place of birth for the foreign-born population - Sri Lanka (%)
Place of birth for the foreign-born population - Uzbekistan (%)
Place of birth for the foreign-born population - Other South Central Asia (%)
Place of birth for the foreign-born population - Burma (%)
Place of birth for the foreign-born population - Cambodia (%)
Place of birth for the foreign-born population - Indonesia (%)
Place of birth for the foreign-born population - Laos (%)
Place of birth for the foreign-born population - Malaysia (%)
Place of birth for the foreign-born population - Philippines (%)
Place of birth for the foreign-born population - Singapore (%)
Place of birth for the foreign-born population - Thailand (%)
Place of birth for the foreign-born population - Vietnam (%)
Place of birth for the foreign-born population - Other South Eastern Asia (%)
Place of birth for the foreign-born population - Armenia (%)
Place of birth for the foreign-born population - Iraq (%)
Place of birth for the foreign-born population - Israel (%)
Place of birth for the foreign-born population - Jordan (%)
Place of birth for the foreign-born population - Kuwait (%)
Place of birth for the foreign-born population - Lebanon (%)
Place of birth for the foreign-born population - Saudi Arabia (%)
Place of birth for the foreign-born population - Syria (%)
Place of birth for the foreign-born population - Turkey (%)
Place of birth for the foreign-born population - Yemen (%)
Place of birth for the foreign-born population - Other Western Asia (%)
Place of birth for the foreign-born population - Eritrea (%)
Place of birth for the foreign-born population - Ethiopia (%)
Place of birth for the foreign-born population - Kenya (%)
Place of birth for the foreign-born population - Somalia (%)
Place of birth for the foreign-born population - Uganda (%)
Place of birth for the foreign-born population - Zimbabwe (%)
Place of birth for the foreign-born population - Other Eastern Africa (%)
Place of birth for the foreign-born population - Cameroon (%)
Place of birth for the foreign-born population - Congo (%)
Place of birth for the foreign-born population - Democratic Republic of Congo (Zaire) (%)
Place of birth for the foreign-born population - Other Middle Africa (%)
Place of birth for the foreign-born population - Egypt (%)
Place of birth for the foreign-born population - Morocco (%)
Place of birth for the foreign-born population - Sudan (%)
Place of birth for the foreign-born population - Other Northern Africa (%)
Place of birth for the foreign-born population - South Africa (%)
Place of birth for the foreign-born population - Other Southern Africa (%)
Place of birth for the foreign-born population - Cabo Verde (%)
Place of birth for the foreign-born population - Ghana (%)
Place of birth for the foreign-born population - Liberia (%)
Place of birth for the foreign-born population - Nigeria (%)
Place of birth for the foreign-born population - Senegal (%)
Place of birth for the foreign-born population - Sierra Leone (%)
Place of birth for the foreign-born population - Other Western Africa (%)
Place of birth for the foreign-born population - Australia (%)
Place of birth for the foreign-born population - New Zealand (%)
Place of birth for the foreign-born population - Fiji (%)
Place of birth for the foreign-born population - Micronesia (%)
Place of birth for the foreign-born population - Bahamas (%)
Place of birth for the foreign-born population - Barbados (%)
Place of birth for the foreign-born population - Cuba (%)
Place of birth for the foreign-born population - Dominica (%)
Place of birth for the foreign-born population - Dominican Republic (%)
Place of birth for the foreign-born population - Grenada (%)
Place of birth for the foreign-born population - Haiti (%)
Place of birth for the foreign-born population - Jamaica (%)
Place of birth for the foreign-born population - St. Vincent and the Grenadines (%)
Place of birth for the foreign-born population - Trinidad and Tobago (%)
Place of birth for the foreign-born population - West Indies (%)
Place of birth for the foreign-born population - Other Caribbean (%)
Place of birth for the foreign-born population - Belize (%)
Place of birth for the foreign-born population - Costa Rica (%)
Place of birth for the foreign-born population - El Salvador (%)
Place of birth for the foreign-born population - Guatemala (%)
Place of birth for the foreign-born population - Honduras (%)
Place of birth for the foreign-born population - Mexico (%)
Place of birth for the foreign-born population - Nicaragua (%)
Place of birth for the foreign-born population - Panama (%)
Place of birth for the foreign-born population - Other Central America (%)
Place of birth for the foreign-born population - Argentina (%)
Place of birth for the foreign-born population - Bolivia (%)
Place of birth for the foreign-born population - Brazil (%)
Place of birth for the foreign-born population - Chile (%)
Place of birth for the foreign-born population - Colombia (%)
Place of birth for the foreign-born population - Ecuador (%)
Place of birth for the foreign-born population - Guyana (%)
Place of birth for the foreign-born population - Peru (%)
Place of birth for the foreign-born population - Uruguay (%)
Place of birth for the foreign-born population - Venezuela (%)
Place of birth for the foreign-born population - Other South America (%)
Place of birth for the foreign-born population - Canada (%)
Place of birth for the foreign-born population - Other Northern America (%)
Place of birth for the foreign-born population - Other (%)
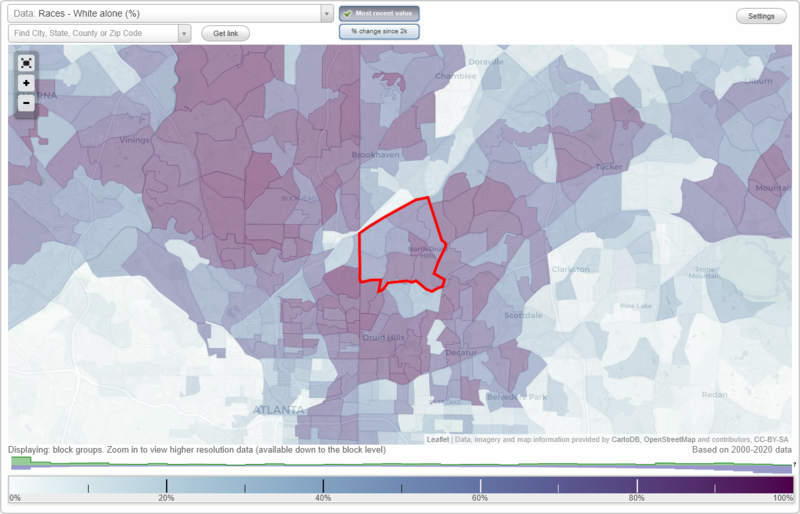
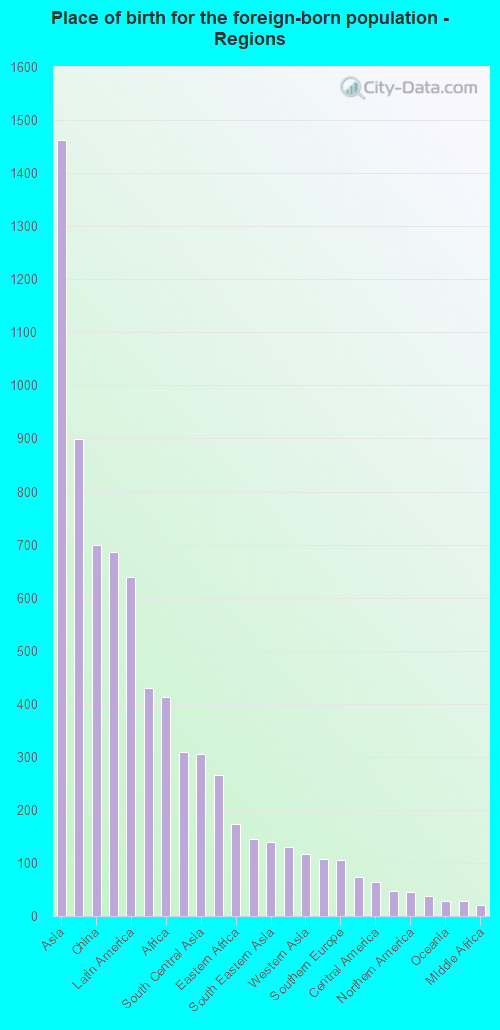
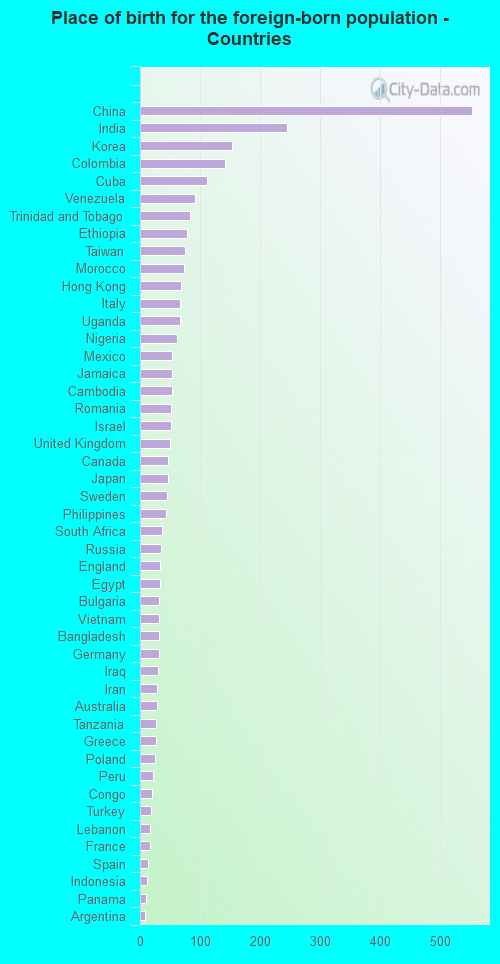
According to 2022 data, the most numerous races in North Druid Hills, GA are White alone (9,869 residents), Black alone (3,232 residents), and Hispanic (1,229 residents). 77.9% of North Druid Hills residents speak English at home. 17.5% of North Druid Hills, GA residents are foreign-born (8.1% born in Asia, 3.6% born in Latin America, 2.4% born in Europe, 2.3% born in Africa), which is 42.8% greater than the foreign-born rate of 10.0% across the entire state of Georgia.
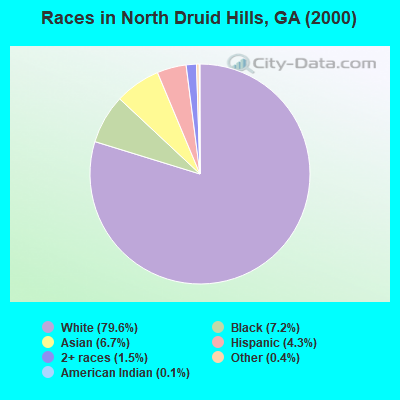
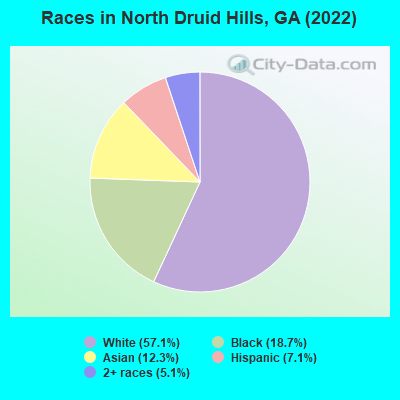
Race distribution in North Druid Hills
2000 2022
5,128,661 62.6% White alone 2,331,465 28.5% Black alone 435,227 5.3% Hispanic 171,513 2.1% Asian alone 87,364 1.1% Two or more races 17,670 0.2% American Indian alone 11,275 0.1% Other race alone 3,278 0.04% Native Hawaiian and Other
5,415,657 49.6% White alone 3,349,240 30.7% Black alone 1,132,604 10.4% Hispanic 479,156 4.4% Asian alone 462,923 4.2% Two or more races 54,416 0.5% Other race alone 11,923 0.1% American Indian alone 6,957 0.06% Native Hawaiian and Other
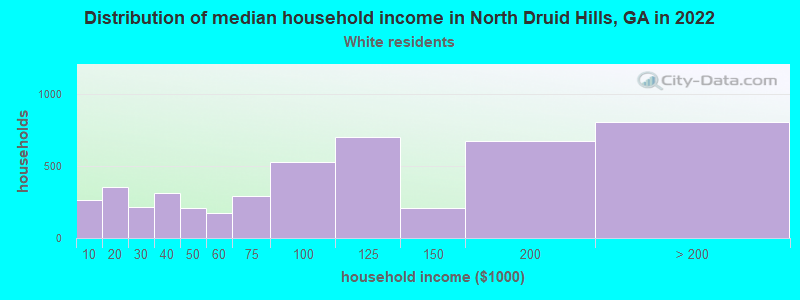
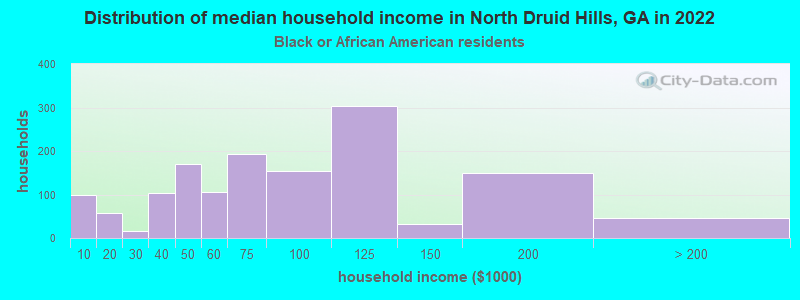
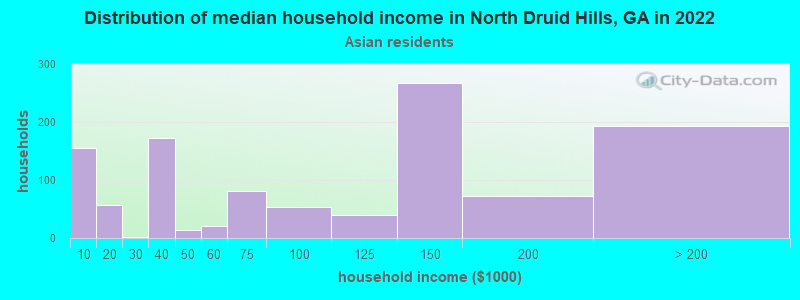
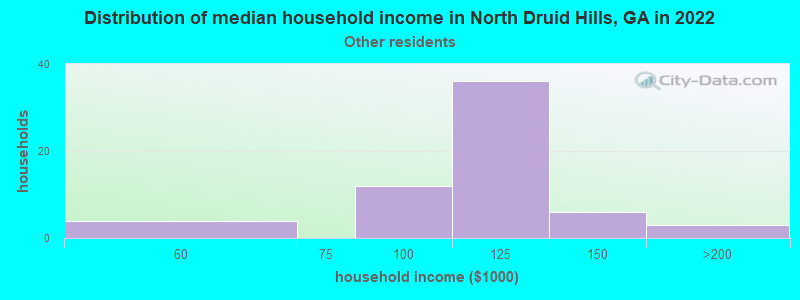
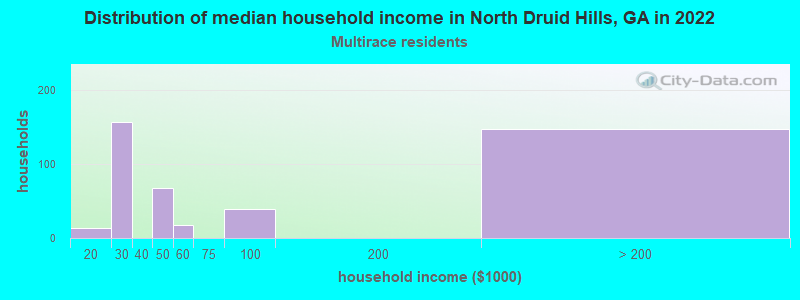
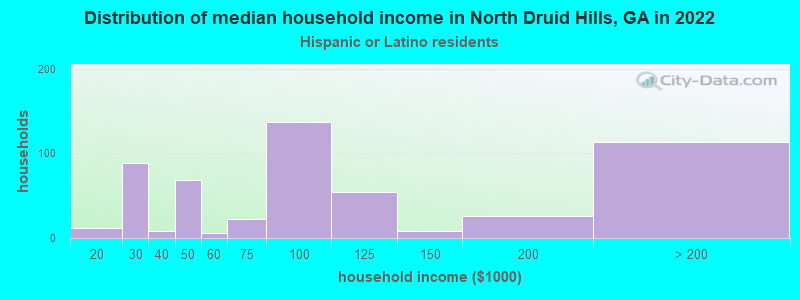
Income and house value in North Druid Hills Median household income in 2022 $105,642 White non-Hispanic householders$76,730 Black householders$141,993 Asian householders$92,262 Some other race householders$53,236 Two or more races householders$84,243 Hispanic or Latino race householdersMedian 2022 house value $570,786 White Non-Hispanic householders$841,884 Black or African American householders $770,159 Asian householders$344,829 Native Hawaiian and other Pacific Islander householders$213,167 Some other race householders$470,221 Two or more races householders$510,096 Hispanic or Latino householders
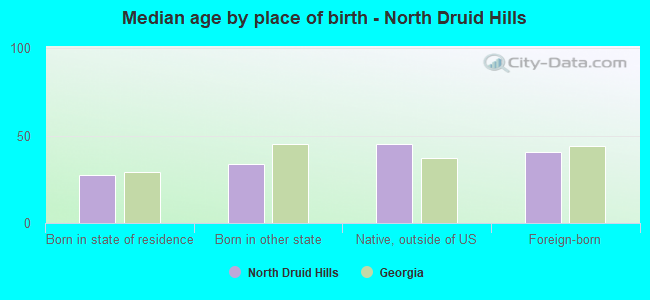
Median age by race in North Druid Hills
37.2 Median age for White residents39.7 33.6 31.8 Median age for Black or African American residents32.1 33.3 15.1 Median age for American Indian / Alaska Native residents-658,914,728.0 -565,432,098.2 32.7 Median age for Asian residents31.3 33.8 -657,243,815.6 Median age for Native Hawaiian / Pacific Islander residents-693,227,090.9 -776,776,776.0 50.6 Median age for Other race residents52.4 30.4 23.8 Median age for Two or more races residents19.2 25.6 34.8 Median age for White alone residents38.1 31.3 39.0 Median age for Hispanic or Latino residents32.0 43.3
Owner/renter occupied households by race in North Druid Hills
House owners and renters - White residents 2,230 47.8% Owner occupied2,440 52.2% Renter occupiedHouse owners and renters - Black or African American residents 153 11.4% Owner occupied1,185 88.6% Renter occupiedHouse owners and renters - American Indian / Alaska Native residents 28 100.0% Renter occupiedHouse owners and renters - Asian residents 536 52.2% Owner occupied491 47.8% Renter occupiedHouse owners and renters - Other race residents 56 69.2% Owner occupied25 30.8% Renter occupiedHouse owners and renters - Two or more races residents 160 37.0% Owner occupied273 63.0% Renter occupiedHouse owners and renters - White alone residents 2,103 46.4% Owner occupied2,429 53.6% Renter occupiedHouse owners and renters - Hispanic or Latino residents 298 52.2% Owner occupied273 47.8% Renter occupied
Language usage in North Druid Hills
English speakers - Total 77.9% of residents of North Druid Hills speak English at home.
6.7% of residents speak Spanish at home 965 89.9% Speak English very well109 10.1% Speak English less than very well16.1% of residents speak other language at home 1,919 73.9% Speak English very well679 26.1% Speak English less than very well
English speakers - Born in the United States 89.2% of residents of North Druid Hills speak English at home.
3.4% of residents speak Spanish at home 277 100.0% Speak English very well7.9% of residents speak other language at home 524 82.4% Speak English very well112 17.6% Speak English less than very well
English speakers - Native, born elsewhere 37.1% of residents of North Druid Hills speak English at home.
48.3% of residents speak Spanish at home 155 100.0% Speak English very well8.7% of residents speak other language at home 28 100.0% Speak English very well
English speakers - Foreign-born 32.5% of residents of North Druid Hills speak English at home.
13.9% of residents speak Spanish at home 312 79.6% Speak English very well80 20.4% Speak English less than very well56.6% of residents speak other language at home 1,018 64.0% Speak English very well573 36.0% Speak English less than very well
White (Caucasian) - Speak only English Native:
94.1% (8,368)Foreign-born:
49.6% (231)
White (Caucasian) - Speak another language Native:
5.1% (453)Foreign-born:
57.0% (266)
Black or African American - Speak only English Native:
97.5% (2,568)Foreign-born:
77.8% (389)
Black or African American - Speak another language Native:
2.3% (60)Foreign-born:
23.3% (117)
American Indian / Alaska Native - Speak another language Native:
53.9% (22)Foreign-born:
99.9% (26)
Asian - Speak only English Native:
32.3% (317)Foreign-born:
13.7% (165)
Asian - Speak another language Native:
67.1% (660)Foreign-born:
84.8% (1,025)
Other race - Speak another language Native:
94.7% (35)Foreign-born:
100.0% (70)
Two or more races - Speak only English Native:
73.8% (612)Foreign-born:
8.0% (13)
Two or more races - Speak another language Native:
25.7% (213)Foreign-born:
89.6% (143)
White alone - Speak only English Native:
95.3% (8,181)Foreign-born:
36.9% (207)
White alone - Speak another language Native:
4.2% (358)Foreign-born:
62.5% (350)
Hispanic or Latino - Speak only English Native:
35.6% (306)Foreign-born:
13.0% (49)
Hispanic or Latino - Speak another language Native:
63.2% (544)Foreign-born:
88.2% (334)
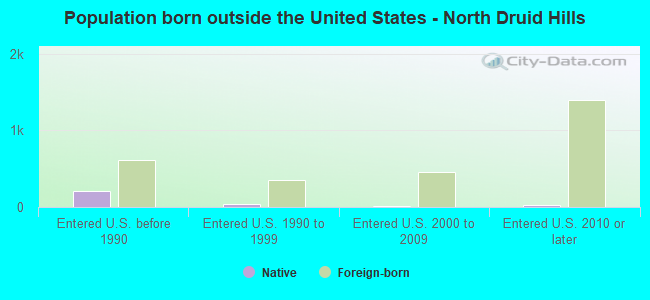
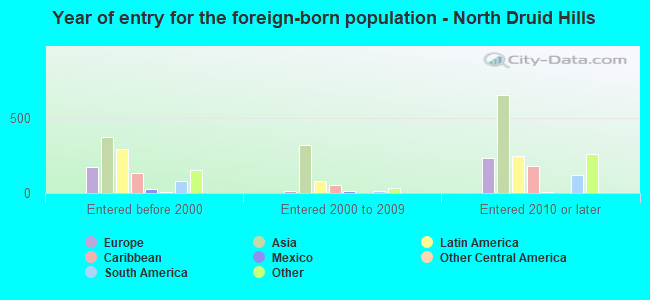
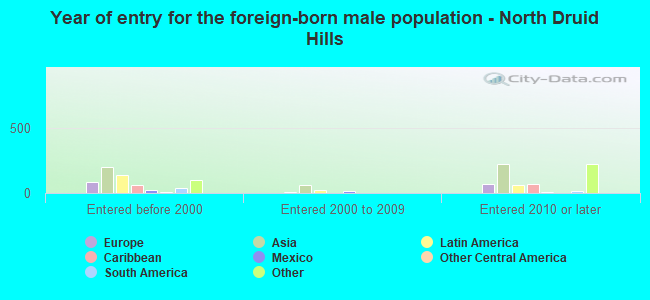
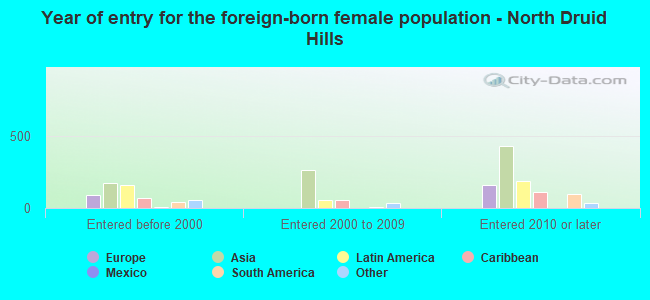
Foreign-born residents in North Druid Hills 3,019 residents are foreign born (8.1% Asia , 3.6% Latin America , 2.4% Europe , 2.3% Africa ).
This city:
17.5%Georgia:
10.4%
Marital status for residents in North Druid Hills Marital status - White (Caucasian) population 15 years and over
Males 47.6% Never married44.7% Now married0.0% Separated1.8% Widowed5.8% DivorcedFemales 41.2% Never married35.2% Now married0.2% Separated8.5% Widowed14.8% DivorcedWomen who gave birth in the past 12 months Now married:
100.0% (151)Unmarried:
0.0% (0)
Women who did not give birth in the past 12 months Now married:
28.4% (721)Unmarried:
71.6% (1,819)
Marital status - Black or African American population 15 years and over
Males 70.7% Never married18.8% Now married0.0% Separated0.0% Widowed10.5% DivorcedFemales 56.4% Never married25.1% Now married2.7% Separated1.3% Widowed14.5% DivorcedWomen who gave birth in the past 12 months Now married:
35.8% (19)Unmarried:
64.2% (34)
Women who did not give birth in the past 12 months Now married:
33.5% (336)Unmarried:
66.5% (668)
Marital status - American Indian / Alaska Native population 15 years and over
Males 38.9% Never married0.0% Now married0.0% Separated61.1% Widowed0.0% DivorcedFemales 100.0% Never married0.0% Now married0.0% Separated0.0% Widowed0.0% DivorcedWomen who did not give birth in the past 12 months Now married:
0.0% (0)Unmarried:
100.0% (62)
Marital status - Asian population 15 years and over
Males 62.3% Never married37.7% Now married0.0% Separated0.0% Widowed0.0% DivorcedFemales 47.1% Never married22.1% Now married0.0% Separated4.8% Widowed26.0% DivorcedWomen who gave birth in the past 12 months Now married:
100.0% (10)Unmarried:
0.0% (0)
Women who did not give birth in the past 12 months Now married:
17.8% (187)Unmarried:
82.2% (866)
Marital status - Other race population 15 years and over
Males 30.4% Never married0.0% Now married0.0% Separated69.6% Widowed0.0% DivorcedFemales 58.8% Never married41.2% Now married0.0% Separated0.0% Widowed0.0% DivorcedWomen who did not give birth in the past 12 months Now married:
0.0% (0)Unmarried:
100.0% (15)
Marital status - Two or more races population 15 years and over
Males 67.3% Never married32.7% Now married0.0% Separated0.0% Widowed0.0% DivorcedFemales 70.3% Never married25.6% Now married4.1% Separated0.0% Widowed0.0% DivorcedWomen who did not give birth in the past 12 months Now married:
27.4% (140)Unmarried:
72.6% (370)
Marital status - White alone, not Hispanic / Latino population 15 years and over
Males 48.1% Never married43.9% Now married0.0% Separated1.9% Widowed6.1% DivorcedFemales 41.9% Never married35.9% Now married0.0% Separated8.2% Widowed14.0% DivorcedWomen who gave birth in the past 12 months Now married:
100.0% (159)Unmarried:
0.0% (0)
Women who did not give birth in the past 12 months Now married:
28.7% (722)Unmarried:
71.3% (1,797)
Marital status - Hispanic or Latino population 15 years and over
Males 44.7% Never married41.9% Now married0.0% Separated13.4% Widowed0.0% DivorcedFemales 46.1% Never married31.4% Now married1.7% Separated6.7% Widowed14.1% DivorcedWomen who did not give birth in the past 12 months Now married:
28.5% (117)Unmarried:
71.5% (294)
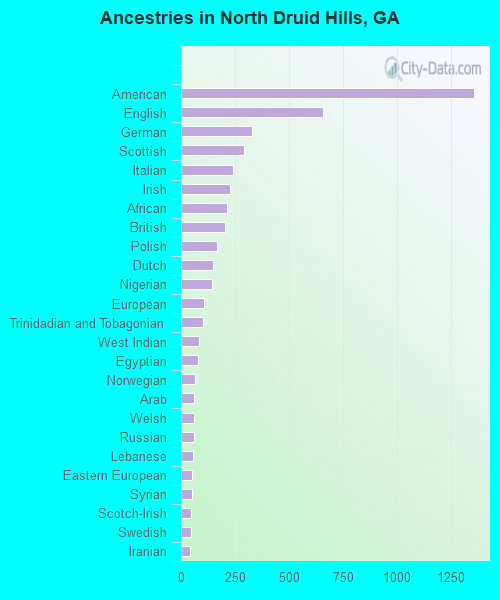
Ancestries in North Druid Hills
1,360 13.6% American658 6.6% English327 3.3% German292 2.9% Scottish243 2.4% Italian228 2.3% Irish213 2.1% African203 2.0% British166 1.7% Polish148 1.5% Dutch144 1.4% Nigerian105 1.0% European103 1.0% Trinidadian and Tobagonian84 0.8% West Indian80 0.8% Egyptian66 0.7% Norwegian62 0.6% Arab62 0.6% Welsh59 0.6% Russian57 0.6% Lebanese50 0.5% Eastern European49 0.5% Syrian46 0.5% Scotch-Irish46 0.5% Swedish40 0.4% Iranian37 0.4% French Canadian31 0.3% Hungarian30 0.3% Greek29 0.3% Romanian28 0.3% Israeli25 0.2% Ugandan24 0.2% Finnish24 0.2% Slavic24 0.2% South African18 0.2% Bulgarian18 0.2% Jamaican17 0.2% French17 0.2% Turkish16 0.2% Ukrainian11 0.1% Afghan11 0.1% Northern European6 0.06% Lithuanian3 0.03% Czech
Geographical mobility in North Druid Hills Same house 1 year ago 7,618 77.8% White (Caucasian)2,522 78.0% Black or African American56 87.7% American Indian / Alaska Native1,603 76.6% Asian84 79.7% Other race1,059 83.9% Two or more races7,564 78.0% White alone, not Hispanic / Latino954 78.1% Hispanic or LatinoMoved within same county 807 8.2% White / Caucasian325 10.1% Black or African American112 5.3% Asian22 1.7% Two or more races745 7.7% White alone, not Hispanic / Latino90 7.3% Hispanic or LatinoMoved within same state 662 6.8% White / Caucasian261 8.1% Black or African American135 6.5% Asian9 8.6% Other race165 13.1% Two or more races668 6.9% White alone, not Hispanic / Latino84 6.9% Hispanic or LatinoMoved from different state 649 6.6% White / Caucasian96 3.0% Black or African American103 4.9% Asian8 8.0% Other race14 1.1% Two or more races664 6.8% White alone, not Hispanic / Latino22 1.8% Hispanic or LatinoMoved from abroad 77 0.8% White29 0.9% Black or African American113 5.4% Asian93 1.0% White alone, not Hispanic / Latino22 1.8% Hispanic or Latino
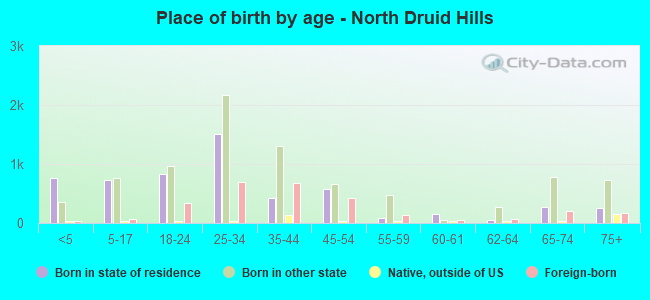
Children Nativity (place of birth) in North Druid Hills
Children under 6 years - Living with two parents Both parents native 781 100.0% NativeBoth parents foreign-born 14 100.0% NativeOne native, one foreign-born parent 105 100.0% NativeChildren under 6 years - Living with one parent Native parent 328 100.0% NativeChildren 6 to 17 years - Living with two parents Both parents native 1,106 100.0% NativeBoth parents foreign-born 14 22.3% Native50 77.7% Foreign-bornOne native, one foreign-born parent 124 100.0% NativeChildren 6 to 17 years - Living with one parent Native parent 55 100.0% NativeForeign-born parent 67 54.1% Native57 45.9% Foreign-born