New Port Richey, FL (Florida) Houses and Residents
Estimated median house or condo value in 2022: $183,034 (it was $53,800 in 2000 )
New Port Richey:
$183,034Florida:
$354,100
Lower value quartile - upper value quartile: $93,920 - $253,743Mean price in 2022: Detached houses: $245,893 Here:
$245,893State:
$500,941
Townhouses or other attached units: $207,334 Here:
$207,334State:
$370,869
In 3-to-4-unit structures: $115,468 Here:
$115,468State:
$309,944
In 5-or-more-unit structures: $143,311 Here:
$143,311State:
$447,145
Mobile homes: $22,082 Here:
$22,082State:
$113,202
Total population: 15,527 (All urban)
Houses: 9,609 (8,040 occupied: 4,721 owner occupied, 3,533 renter occupied )
% of renters here:
43%State:
33%
Housing density: 2,130 houses/condos per square mile
Median price asked for vacant for-sale houses and condos in 2022: $155,507.
Median contract rent in 2022: $998 (lower quartile is $773, upper quartile is $1,245)
Median rent asked for vacant for-rent units in 2022: $787
Median gross rent in New Port Richey, FL in 2022: $1,176
Housing units in New Port Richey with a mortgage: 2,216 (117 second mortgage, 0 home equity loan, 92 both second mortgage and home equity loan )Houses without a mortgage: 46
Median household income for houses/condos with a mortgage: $65,163
Median household income for apartments without a mortgage: $40,264
Median monthly housing costs: $1,014
Data:
Median house or condo value ($)
Median house or condo value ($ change since 2000)
Median house or condo value ($) - White
Median house or condo value ($) - Black or African American
Median house or condo value ($) - Asian
Median house or condo value ($) - Hispanic or Latino
Median house or condo value ($) - American Indian and Alaska Native
Median house or condo value ($) - Multirace
Median house or condo value ($) - Other Race
Median price asked for mobile homes ($)
Household density (households per square mile)
Mean house or condo value by units in structure - 1, detached ($)
Mean house or condo value by units in structure - 1, attached ($)
Mean house or condo value by units in structure - 2 ($)
Mean house or condo value by units in structure by units in structure - 3 or 4 ($)
Mean house or condo value by units in structure - 5 or more ($)
Mean house or condo value by units in structure - Boat, RV, van, etc. ($)
Mean house or condo value by units in structure - Mobile home ($)
Median contract rent ($)
Median contract rent - Lower quartile ($)
Median contract rent - Upper quartile ($)
Median gross rent ($)
Urban houses (%)
Rural houses (%)
Houses occupied (%)
Houses occupied (% change since 2000)
Houses owner occupied (%)
Houses owner occupied (% change since 2000)
Houses renter occupied (%)
Houses renter occupied (% change since 2000)
Vacant housing units - For rent (%)
Vacant housing units - For rent (% change since 2000)
Vacant housing units - For sale only (%)
Vacant housing units - For sale only (% change since 2000)
Vacant housing units - Rented or sold, not occupied (%)
Vacant housing units - Rented or sold, not occupied (% change since 2000)
Vacant housing units - For seasonal, recreational, or occasional use (%)
Vacant housing units - For seasonal, recreational, or occasional use (% change since 2000)
Vacant housing units - For migrant workers (%)
Vacant housing units - For migrant workers (% change since 2000)
Vacant housing units - Other vacant (%)
Vacant housing units - Other vacant (% change since 2000)
Median monthly housing costs ($)
Median household income for houses/condos with a mortgage ($)
Median household income for houses/condos without a mortgage ($)
Median household income ($)
Median household income ($) - White
Median household income ($) - Black or African American
Median household income ($) - Asian
Median household income ($) - Hispanic or Latino
Median household income ($) - American Indian and Alaska Native
Median household income ($) - Multirace
Median household income ($) - Other Race
Mortgage status - with mortgage (%)
Mortgage status - with second mortgage (%)
Mortgage status - with home equity loan (%)
Mortgage status - with both second mortgage and home equity loan (%)
Mortgage status - without a mortgage (%)
Median year house/condo built
Median year apartment built
Household type by relationship - Male householder living alone (%)
Household type by relationship - Male householder not living alone (%)
Household type by relationship - Female householder living alone (%)
Household type by relationship - Female householder not living alone (%)
Household type by relationship - Opposite-Sex spouse (%)
Household type by relationship - Same-Sex spouse (%)
Household type by relationship - Opposite-Sex unmarried partner (%)
Household type by relationship - Same-Sex unmarried partner (%)
Household type by relationship - In group quarters (%)
Size of family households - 2-person household (%)
Size of family households - 3-person household (%)
Size of family households - 4-person household (%)
Size of family households - 5-person household (%)
Size of family households - 6-person household (%)
Size of family households - 7-or-more-person household (%)
Size of nonfamily households - 1-person household (%)
Size of nonfamily households - 2-person household (%)
Size of nonfamily households - 3-person household (%)
Size of nonfamily households - 4-person household (%)
Size of nonfamily households - 5-person household (%)
Size of nonfamily households - 6-person household (%)
Size of nonfamily households - 7-or-moreperson household (%)
Year house built - Built 2010 or later (%)
Year house built - Built 2000 to 2009 (%)
Year house built - Built 1990 to 1999 (%)
Year house built - Built 1980 to 1989 (%)
Year house built - Built 1970 to 1979 (%)
Year house built - Built 1960 to 1969 (%)
Year house built - Built 1950 to 1959 (%)
Year house built - Built 1940 to 1949 (%)
Year house built - Built 1939 or earlier (%)
Median number of rooms in houses and condos
Median number of rooms in apartments
Median number of bedrooms in owner occupied houses
Mean number of bedrooms in owner occupied houses
Median number of bedrooms in renter occupied houses
Mean number of bedrooms in renter occupied houses
Median number of vehichles in owner occupied houses
Mean number of vehichles in owner occupied houses
Median number of vehichles in renter occupied houses
Mean number of vehichles in renter occupied houses
Rooms in owner-occupied houses - 1 room (%)
Rooms in owner-occupied houses - 2 rooms (%)
Rooms in owner-occupied houses - 3 rooms (%)
Rooms in owner-occupied houses - 4 rooms (%)
Rooms in owner-occupied houses - 5 rooms (%)
Rooms in owner-occupied houses - 6 rooms (%)
Rooms in owner-occupied houses - 7 rooms (%)
Rooms in owner-occupied houses - 8 rooms (%)
Rooms in owner-occupied houses - 9+ rooms (%)
Rooms in renter-occupied houses - 1 room (%)
Rooms in renter-occupied houses - 2 rooms (%)
Rooms in renter-occupied houses - 3 rooms (%)
Rooms in renter-occupied houses - 4 rooms (%)
Rooms in renter-occupied houses - 5 rooms (%)
Rooms in renter-occupied houses - 6 rooms (%)
Rooms in renter-occupied houses - 7 rooms (%)
Rooms in renter-occupied houses - 8 rooms (%)
Rooms in renter-occupied houses - 9+ rooms (%)
Bedrooms in owner-occupied houses - no bedrooms (%)
Bedrooms in owner-occupied houses - 1 bedroom (%)
Bedrooms in owner-occupied houses - 2 bedrooms (%)
Bedrooms in owner-occupied houses - 3 bedrooms (%)
Bedrooms in owner-occupied houses - 4 bedrooms (%)
Bedrooms in owner-occupied houses - 5+ bedrooms (%)
Bedrooms in renter-occupied houses - no bedrooms (%)
Bedrooms in renter-occupied houses - 1 bedroom (%)
Bedrooms in renter-occupied houses - 2 bedrooms (%)
Bedrooms in renter-occupied houses - 3 bedrooms (%)
Bedrooms in renter-occupied houses - 4 bedrooms (%)
Bedrooms in renter-occupied houses - 5+ bedrooms (%)
Vehicles available in owner-occupied houses - no vehicle available (%)
Vehicles available in owner-occupied houses - 1 vehicle available(%)
Vehicles available in owner-occupied houses - 2 Vehicles available (%)
Vehicles available in owner-occupied houses - 3 Vehicles available (%)
Vehicles available in owner-occupied houses - 4 Vehicles available (%)
Vehicles available in owner-occupied houses - 5+ Vehicles available (%)
Vehicles available in renter-occupied houses - no vehicle available (%)
Vehicles available in renter-occupied houses - 1 vehicle available (%)
Vehicles available in renter-occupied houses - 2 Vehicles available (%)
Vehicles available in renter-occupied houses - 3 Vehicles available (%)
Vehicles available in renter-occupied houses - 4 Vehicles available (%)
Vehicles available in renter-occupied houses - 5+ Vehicles available (%)
Housing units in structures - 1, detached (%)
Housing units in structures - 1, attached (%)
Housing units in structures - 2 (%)
Housing units in structures - 3 or 4 (%)
Housing units in structures - 5 to 9 (%)
Housing units in structures - 10 to 19 (%)
Housing units in structures - 20 to 49 (%)
Housing units in structures - 50 or more (%)
Housing units in structures - Mobile home (%)
Housing units in structures - Boat, RV, van, etc. (%)
Housing units in structures - Owners - 1, detached (%)
Housing units in structures - Owners - 1, attached (%)
Housing units in structures - Owners - 2 (%)
Housing units in structures - Owners - 3 or 4 (%)
Housing units in structures - Owners - 5 to 9 (%)
Housing units in structures - Owners - 10 to 19 (%)
Housing units in structures - Owners - 20 to 49 (%)
Housing units in structures - Owners - 50 or more (%)
Housing units in structures - Owners - Mobile home (%)
Housing units in structures - Owners - Boat, RV, van, etc. (%)
Housing units in structures - Renters - 1, detached (%)
Housing units in structures - Renters - 1, attached (%)
Housing units in structures - Renters - 2 (%)
Housing units in structures - Renters - 3 or 4 (%)
Housing units in structures - Renters - 5 to 9 (%)
Housing units in structures - Renters - 10 to 19 (%)
Housing units in structures - Renters - 20 to 49 (%)
Housing units in structures - Renters - 50 or more (%)
Housing units in structures - Renters - Mobile home (%)
Housing units in structures - Renters - Boat, RV, van, etc. (%)
House/condo owner moved in on average (years ago)
Renter moved in on average (years ago)
Year householder moved into unit - Moved in 1999 to March 2000 (%)
Year householder moved into unit - Moved in 1999 to March 2000 (%) - White
Year householder moved into unit - Moved in 1999 to March 2000 (%) - Black or African American
Year householder moved into unit - Moved in 1999 to March 2000 (%) - Asian
Year householder moved into unit - Moved in 1999 to March 2000 (%) - Hispanic or Latino
Year householder moved into unit - Moved in 1999 to March 2000 (%) - American Indian and Alaska Native
Year householder moved into unit - Moved in 1999 to March 2000 (%) - Multirace
Year householder moved into unit - Moved in 1999 to March 2000 (%) - Other Race
Year householder moved into unit - Moved in 1995 to 1998 (%)
Year householder moved into unit - Moved in 1995 to 1998 (%) - White
Year householder moved into unit - Moved in 1995 to 1998 (%) - Black or African American
Year householder moved into unit - Moved in 1995 to 1998 (%) - Asian
Year householder moved into unit - Moved in 1995 to 1998 (%) - Hispanic or Latino
Year householder moved into unit - Moved in 1995 to 1998 (%) - American Indian and Alaska Native
Year householder moved into unit - Moved in 1995 to 1998 (%) - Multirace
Year householder moved into unit - Moved in 1995 to 1998 (%) - Other Race
Year householder moved into unit - Moved in 1990 to 1994 (%)
Year householder moved into unit - Moved in 1990 to 1994 (%) - White
Year householder moved into unit - Moved in 1990 to 1994 (%) - Black or African American
Year householder moved into unit - Moved in 1990 to 1994 (%) - Asian
Year householder moved into unit - Moved in 1990 to 1994 (%) - Hispanic or Latino
Year householder moved into unit - Moved in 1990 to 1994 (%) - American Indian and Alaska Native
Year householder moved into unit - Moved in 1990 to 1994 (%) - Multirace
Year householder moved into unit - Moved in 1990 to 1994 (%) - Other Race
Year householder moved into unit - Moved in 1980 to 1989 (%)
Year householder moved into unit - Moved in 1980 to 1989 (%) - White
Year householder moved into unit - Moved in 1980 to 1989 (%) - Black or African American
Year householder moved into unit - Moved in 1980 to 1989 (%) - Asian
Year householder moved into unit - Moved in 1980 to 1989 (%) - Hispanic or Latino
Year householder moved into unit - Moved in 1980 to 1989 (%) - American Indian and Alaska Native
Year householder moved into unit - Moved in 1980 to 1989 (%) - Multirace
Year householder moved into unit - Moved in 1980 to 1989 (%) - Other Race
Year householder moved into unit - Moved in 1970 to 1979 (%)
Year householder moved into unit - Moved in 1970 to 1979 (%) - White
Year householder moved into unit - Moved in 1970 to 1979 (%) - Black or African American
Year householder moved into unit - Moved in 1970 to 1979 (%) - Asian
Year householder moved into unit - Moved in 1970 to 1979 (%) - Hispanic or Latino
Year householder moved into unit - Moved in 1970 to 1979 (%) - American Indian and Alaska Native
Year householder moved into unit - Moved in 1970 to 1979 (%) - Multirace
Year householder moved into unit - Moved in 1970 to 1979 (%) - Other Race
Year householder moved into unit - Moved in 1969 or earlier (%)
Year householder moved into unit - Moved in 1969 or earlier (%) - White
Year householder moved into unit - Moved in 1969 or earlier (%) - Black or African American
Year householder moved into unit - Moved in 1969 or earlier (%) - Asian
Year householder moved into unit - Moved in 1969 or earlier (%) - Hispanic or Latino
Year householder moved into unit - Moved in 1969 or earlier (%) - American Indian and Alaska Native
Year householder moved into unit - Moved in 1969 or earlier (%) - Multirace
Year householder moved into unit - Moved in 1969 or earlier (%) - Other Race
Housing units lacking complete plumbing facilities (%)
Housing units lacking complete kitchen facilities (%)
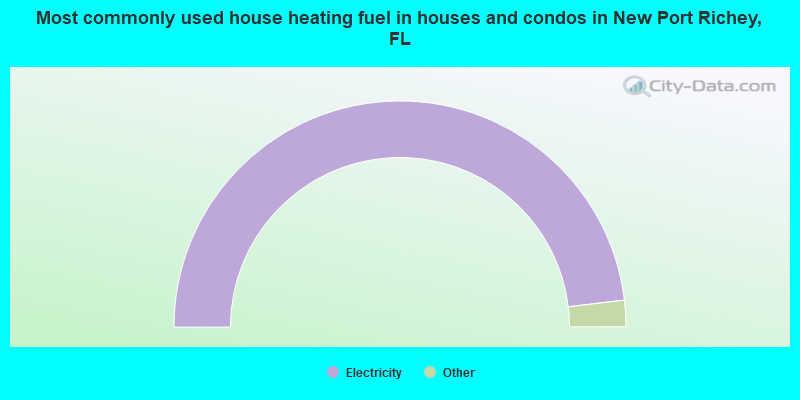
House heating fuel used in houses and condos - Utility gas (%)
House heating fuel used in houses and condos - Bottled, tank, or LP gas (%)
House heating fuel used in houses and condos - Electricity (%)
House heating fuel used in houses and condos - Fuel oil, kerosene, etc. (%)
House heating fuel used in houses and condos - Coal or coke (%)
House heating fuel used in houses and condos - Wood (%)
House heating fuel used in houses and condos - Solar energy (%)
House heating fuel used in houses and condos - Other fuel (%)
House heating fuel used in houses and condos - No fuel used (%)
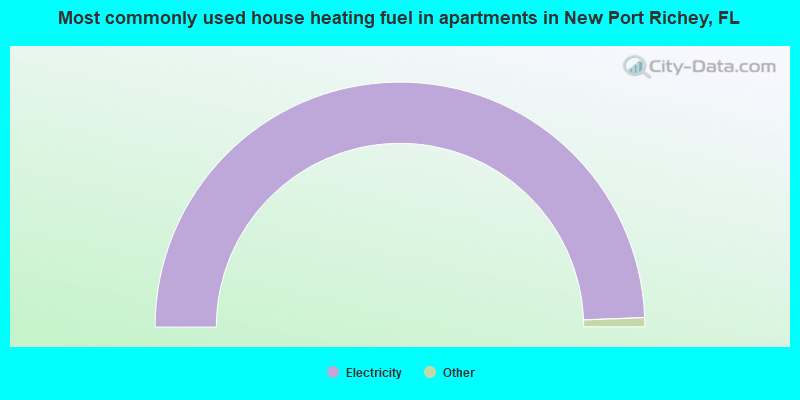
House heating fuel used in apartments - Utility gas (%)
House heating fuel used in apartments - Bottled, tank, or LP gas (%)
House heating fuel used in apartments - Electricity (%)
House heating fuel used in apartments - Fuel oil, kerosene, etc. (%)
House heating fuel used in apartments - Coal or coke (%)
House heating fuel used in apartments - Wood (%)
House heating fuel used in apartments - Solar energy (%)
House heating fuel used in apartments - Other fuel (%)
House heating fuel used in apartments - No fuel used (%)
Median year house/condo built: 1981Median year apartment built: 1982Household type by relationship:
Households: 17,906
Male householders: 3,673 (1,463 living alone ), Female householders: 4,516 (1,729 living alone )2,724 spouses (2,704 opposite-sex spouses ), 598 unmarried partners , (533 opposite-sex unmarried partners ), 3,461 children (3,133 natural , 187 adopted , 140 stepchildren ), 242 grandchildren , 318 brothers or sisters , 428 parents , 8 foster children , 240 other relatives , 875 non-relatives In group quarters: 816
Size of family households: 2,747 2-persons , 878 3-persons , 524 4-persons , 117 5-persons , 97 6-persons , 23 7-or-more-persons .
Size of nonfamily households: 3,160 1-person , 704 2-persons , 24 7-or-more-persons .
1,105 married couples with children. single-parent households (236 men , 569 women ).
83.3% of residents of New Port Richey speak English at home. of residents speak Spanish at home (64% speak English very well , 14% speak English well , 14% speak English not well , 8% don't speak English at all ).of residents speak other Indo-European language at home (80% speak English very well , 20% speak English well ).of residents speak Asian or Pacific Island language at home (15% speak English very well , 68% speak English well , 17% speak English not well ).of residents speak other language at home (88% speak English very well , 12% speak English well ).
Foreign born population: 1,770 (9.9%)of them are naturalized citizens )
Median number of rooms in houses and condos:
Median number of rooms in apartments
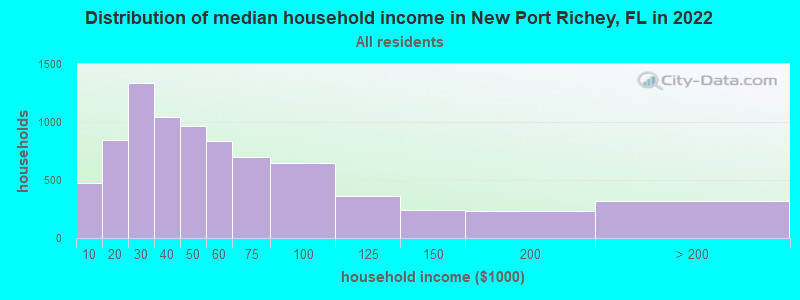
New Port Richey, FL household income distribution 472 Less than $10,000842 $10,000 to $19,9991,340 $20,000 to $29,9991,044 $30,000 to $39,999962 $40,000 to $49,999836 $50,000 to $59,999694 $60,000 to $74,999650 $75,000 to $99,999364 $100,000 to $124,999243 $125,000 to $149,999233 $150,000 to $199,999316 $200,000 or more
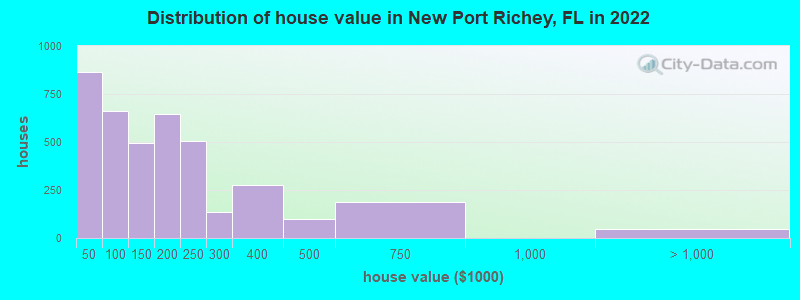
Home value of owner - occupied houses in 2022 in New Port Richey, FL 135 Less than $10,000138 $10,000 to $14,999129 $15,000 to $19,99920 $20,000 to $24,999117 $25,000 to $29,999114 $30,000 to $34,99981 $35,000 to $39,999126 $40,000 to $49,99947 $50,000 to $59,99976 $60,000 to $69,999140 $70,000 to $79,999150 $80,000 to $89,999121 $90,000 to $99,999249 $100,000 to $124,999246 $125,000 to $149,999388 $150,000 to $174,999255 $175,000 to $199,999503 $200,000 to $249,999136 $250,000 to $299,999277 $300,000 to $399,99997 $400,000 to $499,999186 $500,000 to $749,99948 $1,000,000 to $1,499,999Rent paid by renters in 2022 in New Port Richey, FL 6 Less than $1005 $100 to $14948 $150 to $19937 $200 to $2495 $250 to $29931 $300 to $34915 $350 to $39911 $400 to $449126 $500 to $54928 $550 to $59999 $600 to $649158 $650 to $699235 $700 to $749372 $750 to $799393 $800 to $899461 $900 to $999583 $1,000 to $1,249242 $1,250 to $1,499250 $1,500 to $1,99979 $2,000 to $2,49974 No cash rent
Percentage of workers working in this county: 72.7%Number of people working at home: 1,129 (15.8% of all workers )
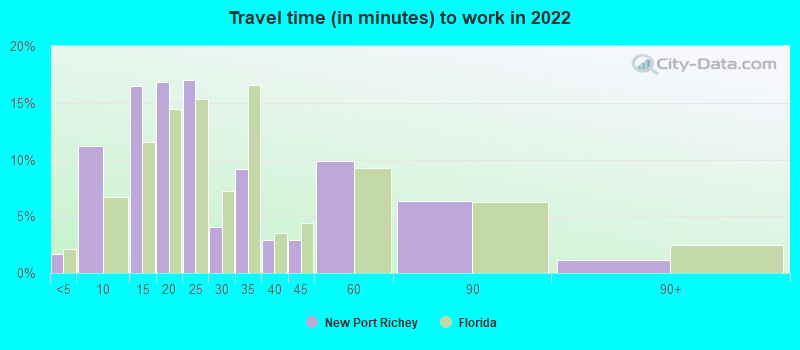
Travel time to work (commute)
Less than 5 minutes: 3335 to 9 minutes: 84710 to 14 minutes: 84715 to 19 minutes: 65020 to 24 minutes: 57225 to 29 minutes: 31230 to 34 minutes: 34635 to 39 minutes: 21240 to 44 minutes: 19745 to 59 minutes: 70360 to 89 minutes: 70890 or more minutes: 99
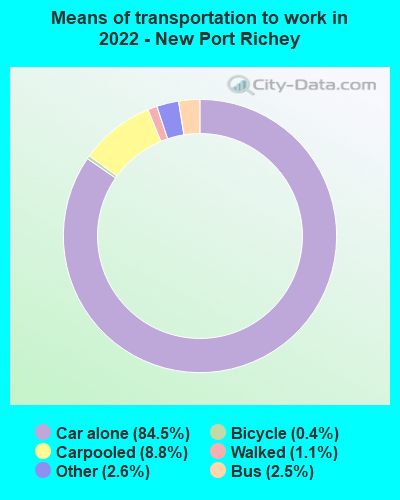
Means of transportation to work:
Drove a car alone: 9,754 (72.5%)Carpooled: 897 (6.7%)Bus : 208 (1.5%)Taxi: 285 (2.1%)Bicycle: 90 (0.7%)Walked: 128 (1.0%)Worked at home: 1,129 (8.4%)
Unemployment by race in 2022
Unemployment rate for White non-Hispanic residents 1.9% Males4.1% FemalesUnemployment rate for Black residents 2.9% Males6.1% FemalesUnemployment rate for two or more race residents 3.2% Males3.7% FemalesUnemployment rate for Hispanic or Latino residents 2.3% Males10.2% Females
Year of entry for the foreign-born population in New Port Richey, Florida
585 2010 or later 379 2000 to 2009 237 1990 to 1999 101 1980 to 1989 76 1970 to 1979 388 Before 1970
First ancestries reported:
American: 3,372 (33.3%)
Irish: 682 (6.7%)
English: 605 (6.0%)
German: 498 (4.9%)
Italian: 317 (3.1%)
Polish: 282 (2.8%)
Welsh: 165 (1.6%)
Norwegian: 148 (1.5%)
French Canadian: 122 (1.2%)
Moroccan: 99 (1.0%)
French: 85 (0.8%)
British: 82 (0.8%)
Hungarian: 76 (0.8%)
Ukrainian: 75 (0.7%)
Scottish: 71 (0.7%)
European: 63 (0.6%)
Swedish: 50 (0.5%)
Danish: 44 (0.4%)
West Indian: 41 (0.4%)
Croatian: 35 (0.3%)
Haitian: 34 (0.3%)
Jamaican: 34 (0.3%)
Greek: 33 (0.3%)
Eastern European: 32 (0.3%)
Portuguese: 31 (0.3%)
Dutch: 30 (0.3%)
Scandinavian: 29 (0.3%)
Canadian: 29 (0.3%)
Czechoslovakian: 26 (0.3%)
Iraqi: 22 (0.2%)
Czech: 21 (0.2%)
Finnish: 19 (0.2%)
Scotch-Irish: 18 (0.2%)
African: 18 (0.2%)
Northern European: 14 (0.1%)
Icelander: 12 (0.1%)
Austrian: 6 (0.06%)
Slavic: 6 (0.06%)
Cape Verdean: 5 (0.05%)
Israeli: 4 (0.04%)
Russian: 4 (0.04%) Most common places of birth for foreign-born residents (%): Cuba New Port Richey:
15.3% (237)Florida:
22.0% (1,006,576)
Colombia New Port Richey:
14.3% (222)Florida:
6.5% (298,669)
Peru New Port Richey:
11.2% (173)Florida:
2.1% (96,693)
Mexico New Port Richey:
9.6% (149)Florida:
5.6% (257,152)
Canada New Port Richey:
6.3% (98)Florida:
2.4% (109,132)
Argentina New Port Richey:
4.7% (73)Florida:
1.3% (57,263)
Spain New Port Richey:
3.4% (52)Florida:
0.5% (21,571)
Jamaica New Port Richey:
3.0% (46)Florida:
5.0% (227,319)
England New Port Richey:
2.6% (40)Florida:
0.8% (37,723)
Nicaragua New Port Richey:
2.3% (36)Florida:
2.3% (105,066)
Azerbaijan New Port Richey:
2.2% (34)Florida:
0.0% (1,070)
Haiti New Port Richey:
2.1% (33)Florida:
7.5% (342,375)
Ireland New Port Richey:
2.1% (32)Florida:
0.2% (9,421)
Philippines New Port Richey:
2.0% (31)Florida:
1.8% (84,403)
Vietnam New Port Richey:
1.9% (30)Florida:
1.3% (60,604)
Brazil New Port Richey:
1.5% (24)Florida:
2.7% (122,906)
Place of birth for U.S.-born residents:
This state: 5,467Other state: 9,900Northeast: 4,794Midwest: 3,090South: 1,500West: 540 87.3% of New Port Richey residents lived in the same house 1 years ago.
Out of people who lived in different houses, 26.7% lived in this county.
Out of people who lived in different counties, 46.3% lived in Florida.
New Port Richey:
87.3%State average:
86.3%
Education attainment for males 25 years and older:
No schooling: 105Nursery to 4th grade: 365th and 6th grade: 57th and 8th grade: 229th grade: 6010th grade: 13311th grade: 6612th grade, no diploma: 170High school graduate (or equivalency): 2,954Less than 1 year of college: 422Some college more than 1 year, no degree: 1,017Associate degree: 654Bachelor's degree: 624Master's degree: 193Professional school degree: 15Doctorate degree: 80
Education attainment for females 25 years and older:
No schooling: 105Nursery to 4th grade: 335th and 6th grade: 07th and 8th grade: 1079th grade: 7210th grade: 12011th grade: 2512th grade, no diploma: 103High school graduate (or equivalency): 2,999Less than 1 year of college: 768Some college more than 1 year, no degree: 924Associate degree: 1,039Bachelor's degree: 984Master's degree: 548Professional school degree: 20Doctorate degree: 6
Housing units in structures:
One, detached: 4,500One, attached: 1,001Two: 4293 or 4: 5955 to 9: 78210 to 19: 44820 to 49: 25950 or more: 233Mobile homes: 1,359Median worth of mobile homes: $22,475
Housing units lacking complete plumbing facilities in 2022: 1.6%Housing units lacking complete kitchen facilities in 2022: 1.8%House/condo owner moved in on average 7 years ago
Renter moved in on average 5 years ago
Private vs. public school enrollment:
Students in private schools in grades 1 to 8 (elementary and middle school): 175 Students in private schools in grades 9 to 12 (high school): 30 Students in private undergraduate colleges: 63