Races in New Port Richey, Florida (FL) Detailed Stats
Data:
Races - White alone (%)
Races - White alone (% change since 2000)
Races - Black alone (%)
Races - Black alone (% change since 2000)
Races - American Indian alone (%)
Races - American Indian alone (% change since 2000)
Races - Asian alone (%)
Races - Asian alone (% change since 2000)
Races - Hispanic (%)
Races - Hispanic (% change since 2000)
Races - Native Hawaiian and Other Pacific Islander alone (%)
Races - Native Hawaiian and Other Pacific Islander alone (% change since 2000)
Races - Two or more races(%)
Races - Two or more races(% change since 2000)
Races - Other race alone (%)
Races - Other race alone (% change since 2000)
Racial diversity
Place of birth - Born in state of residence (%)
Place of birth - Born in state of residence (%) - White
Place of birth - Born in state of residence (%) - Black or African American
Place of birth - Born in state of residence (%) - Asian
Place of birth - Born in state of residence (%) - Hispanic or Latino
Place of birth - Born in state of residence (%) - American Indian and Alaska Native
Place of birth - Born in state of residence (%) - Multirace
Place of birth - Born in state of residence (%) - Other Race
Place of birth - Born in other state (%)
Place of birth - Born in other state (%) - White
Place of birth - Born in other state (%) - Black or African American
Place of birth - Born in other state (%) - Asian
Place of birth - Born in other state (%) - Hispanic or Latino
Place of birth - Born in other state (%) - American Indian and Alaska Native
Place of birth - Born in other state (%) - Multirace
Place of birth - Born in other state (%) - Other Race
Place of birth - Native, outside of US (%)
Place of birth - Native, outside of US (%) - White
Place of birth - Native, outside of US (%) - Black or African American
Place of birth - Native, outside of US (%) - Asian
Place of birth - Native, outside of US (%) - Hispanic or Latino
Place of birth - Native, outside of US (%) - American Indian and Alaska Native
Place of birth - Native, outside of US (%) - Multirace
Place of birth - Native, outside of US (%) - Other Race
Place of birth - Foreign born (%)
Place of birth - Foreign born (%) - White
Place of birth - Foreign born (%) - Black or African American
Place of birth - Foreign born (%) - Asian
Place of birth - Foreign born (%) - Hispanic or Latino
Place of birth - Foreign born (%) - American Indian and Alaska Native
Place of birth - Foreign born (%) - Multirace
Place of birth - Foreign born (%) - Other Race
Residents speaking English at home (%)
Residents speaking English at home - Born in the United States (%)
Residents speaking English at home - Native, born elsewhere (%)
Residents speaking English at home - Foreign born (%)
Residents speaking Spanish at home (%)
Residents speaking Spanish at home - Born in the United States (%)
Residents speaking Spanish at home - Native, born elsewhere (%)
Residents speaking Spanish at home - Foreign born (%)
Residents speaking other language at home (%)
Residents speaking other language at home - Born in the United States (%)
Residents speaking other language at home - Native, born elsewhere (%)
Residents speaking other language at home - Foreign born (%)
Marital status - Never married (%)
Marital status - Now married (%)
Marital status - Separated (%)
Marital status - Widowed (%)
Marital status - Divorced (%)
Ancestries Reported - Arab (%)
Ancestries Reported - Czech (%)
Ancestries Reported - Danish (%)
Ancestries Reported - Dutch (%)
Ancestries Reported - English (%)
Ancestries Reported - French (%)
Ancestries Reported - French Canadian (%)
Ancestries Reported - German (%)
Ancestries Reported - Greek (%)
Ancestries Reported - Hungarian (%)
Ancestries Reported - Irish (%)
Ancestries Reported - Italian (%)
Ancestries Reported - Lithuanian (%)
Ancestries Reported - Norwegian (%)
Ancestries Reported - Polish (%)
Ancestries Reported - Portuguese (%)
Ancestries Reported - Russian (%)
Ancestries Reported - Scotch-Irish (%)
Ancestries Reported - Scottish (%)
Ancestries Reported - Slovak (%)
Ancestries Reported - Subsaharan African (%)
Ancestries Reported - Swedish (%)
Ancestries Reported - Swiss (%)
Ancestries Reported - Ukrainian (%)
Ancestries Reported - United States (%)
Ancestries Reported - Welsh (%)
Ancestries Reported - West Indian (%)
Ancestries Reported - Other (%)
Geographical mobility - Same house 1 year ago (%)
Geographical mobility - Same house 1 year ago (%) - White
Geographical mobility - Same house 1 year ago (%) - Black or African American
Geographical mobility - Same house 1 year ago (%) - Asian
Geographical mobility - Same house 1 year ago (%) - Hispanic or Latino
Geographical mobility - Same house 1 year ago (%) - American Indian and Alaska Native
Geographical mobility - Same house 1 year ago (%) - Multirace
Geographical mobility - Same house 1 year ago (%) - Other Race
Geographical mobility - Moved within same county (%)
Geographical mobility - Moved within same county (%) - White
Geographical mobility - Moved within same county (%) - Black or African American
Geographical mobility - Moved within same county (%) - Asian
Geographical mobility - Moved within same county (%) - Hispanic or Latino
Geographical mobility - Moved within same county (%) - American Indian and Alaska Native
Geographical mobility - Moved within same county (%) - Multirace
Geographical mobility - Moved within same county (%) - Other Race
Geographical mobility - Moved from different county within same state (%)
Geographical mobility - Moved from different county within same state (%) - White
Geographical mobility - Moved from different county within same state (%) - Black or African American
Geographical mobility - Moved from different county within same state (%) - Asian
Geographical mobility - Moved from different county within same state (%) - Hispanic or Latino
Geographical mobility - Moved from different county within same state (%) - American Indian and Alaska Native
Geographical mobility - Moved from different county within same state (%) - Multirace
Geographical mobility - Moved from different county within same state (%) - Other Race
Geographical mobility - Moved from different state (%)
Geographical mobility - Moved from different state (%) - White
Geographical mobility - Moved from different state (%) - Black or African American
Geographical mobility - Moved from different state (%) - Asian
Geographical mobility - Moved from different state (%) - Hispanic or Latino
Geographical mobility - Moved from different state (%) - American Indian and Alaska Native
Geographical mobility - Moved from different state (%) - Multirace
Geographical mobility - Moved from different state (%) - Other Race
Geographical mobility - Moved from abroad (%)
Geographical mobility - Moved from abroad (%) - White
Geographical mobility - Moved from abroad (%) - Black or African American
Geographical mobility - Moved from abroad (%) - Asian
Geographical mobility - Moved from abroad (%) - Hispanic or Latino
Geographical mobility - Moved from abroad (%) - American Indian and Alaska Native
Geographical mobility - Moved from abroad (%) - Multirace
Geographical mobility - Moved from abroad (%) - Other Race
Place of birth for the foreign-born population - Ireland (%)
Place of birth for the foreign-born population - Denmark (%)
Place of birth for the foreign-born population - Norway (%)
Place of birth for the foreign-born population - Sweden (%)
Place of birth for the foreign-born population - United Kingdom (%)
Place of birth for the foreign-born population - England (%)
Place of birth for the foreign-born population - Scotland (%)
Place of birth for the foreign-born population - Other Northern Europe (%)
Place of birth for the foreign-born population - Austria (%)
Place of birth for the foreign-born population - Belgium (%)
Place of birth for the foreign-born population - France (%)
Place of birth for the foreign-born population - Germany (%)
Place of birth for the foreign-born population - Netherlands (%)
Place of birth for the foreign-born population - Switzerland (%)
Place of birth for the foreign-born population - Other Western Europe (%)
Place of birth for the foreign-born population - Greece (%)
Place of birth for the foreign-born population - Italy (%)
Place of birth for the foreign-born population - Portugal (%)
Place of birth for the foreign-born population - Spain (%)
Place of birth for the foreign-born population - Other Southern Europe (%)
Place of birth for the foreign-born population - Albania (%)
Place of birth for the foreign-born population - Belarus (%)
Place of birth for the foreign-born population - Bosnia and Herzegovina (%)
Place of birth for the foreign-born population - Bulgaria (%)
Place of birth for the foreign-born population - Croatia (%)
Place of birth for the foreign-born population - Czechoslovakia (%)
Place of birth for the foreign-born population - Hungary (%)
Place of birth for the foreign-born population - Latvia (%)
Place of birth for the foreign-born population - Lithuania (%)
Place of birth for the foreign-born population - North Macedonia (Macedonia) (%)
Place of birth for the foreign-born population - Moldova (%)
Place of birth for the foreign-born population - Poland (%)
Place of birth for the foreign-born population - Romania (%)
Place of birth for the foreign-born population - Russia (%)
Place of birth for the foreign-born population - Serbia (%)
Place of birth for the foreign-born population - Ukraine (%)
Place of birth for the foreign-born population - Other Eastern Europe (%)
Place of birth for the foreign-born population - China (%)
Place of birth for the foreign-born population - Hong Kong (%)
Place of birth for the foreign-born population - Taiwan (%)
Place of birth for the foreign-born population - Japan (%)
Place of birth for the foreign-born population - Korea (%)
Place of birth for the foreign-born population - Other Eastern Asia (%)
Place of birth for the foreign-born population - Afghanistan (%)
Place of birth for the foreign-born population - Bangladesh (%)
Place of birth for the foreign-born population - India (%)
Place of birth for the foreign-born population - Iran (%)
Place of birth for the foreign-born population - Kazakhstan (%)
Place of birth for the foreign-born population - Nepal (%)
Place of birth for the foreign-born population - Pakistan (%)
Place of birth for the foreign-born population - Sri Lanka (%)
Place of birth for the foreign-born population - Uzbekistan (%)
Place of birth for the foreign-born population - Other South Central Asia (%)
Place of birth for the foreign-born population - Burma (%)
Place of birth for the foreign-born population - Cambodia (%)
Place of birth for the foreign-born population - Indonesia (%)
Place of birth for the foreign-born population - Laos (%)
Place of birth for the foreign-born population - Malaysia (%)
Place of birth for the foreign-born population - Philippines (%)
Place of birth for the foreign-born population - Singapore (%)
Place of birth for the foreign-born population - Thailand (%)
Place of birth for the foreign-born population - Vietnam (%)
Place of birth for the foreign-born population - Other South Eastern Asia (%)
Place of birth for the foreign-born population - Armenia (%)
Place of birth for the foreign-born population - Iraq (%)
Place of birth for the foreign-born population - Israel (%)
Place of birth for the foreign-born population - Jordan (%)
Place of birth for the foreign-born population - Kuwait (%)
Place of birth for the foreign-born population - Lebanon (%)
Place of birth for the foreign-born population - Saudi Arabia (%)
Place of birth for the foreign-born population - Syria (%)
Place of birth for the foreign-born population - Turkey (%)
Place of birth for the foreign-born population - Yemen (%)
Place of birth for the foreign-born population - Other Western Asia (%)
Place of birth for the foreign-born population - Eritrea (%)
Place of birth for the foreign-born population - Ethiopia (%)
Place of birth for the foreign-born population - Kenya (%)
Place of birth for the foreign-born population - Somalia (%)
Place of birth for the foreign-born population - Uganda (%)
Place of birth for the foreign-born population - Zimbabwe (%)
Place of birth for the foreign-born population - Other Eastern Africa (%)
Place of birth for the foreign-born population - Cameroon (%)
Place of birth for the foreign-born population - Congo (%)
Place of birth for the foreign-born population - Democratic Republic of Congo (Zaire) (%)
Place of birth for the foreign-born population - Other Middle Africa (%)
Place of birth for the foreign-born population - Egypt (%)
Place of birth for the foreign-born population - Morocco (%)
Place of birth for the foreign-born population - Sudan (%)
Place of birth for the foreign-born population - Other Northern Africa (%)
Place of birth for the foreign-born population - South Africa (%)
Place of birth for the foreign-born population - Other Southern Africa (%)
Place of birth for the foreign-born population - Cabo Verde (%)
Place of birth for the foreign-born population - Ghana (%)
Place of birth for the foreign-born population - Liberia (%)
Place of birth for the foreign-born population - Nigeria (%)
Place of birth for the foreign-born population - Senegal (%)
Place of birth for the foreign-born population - Sierra Leone (%)
Place of birth for the foreign-born population - Other Western Africa (%)
Place of birth for the foreign-born population - Australia (%)
Place of birth for the foreign-born population - New Zealand (%)
Place of birth for the foreign-born population - Fiji (%)
Place of birth for the foreign-born population - Micronesia (%)
Place of birth for the foreign-born population - Bahamas (%)
Place of birth for the foreign-born population - Barbados (%)
Place of birth for the foreign-born population - Cuba (%)
Place of birth for the foreign-born population - Dominica (%)
Place of birth for the foreign-born population - Dominican Republic (%)
Place of birth for the foreign-born population - Grenada (%)
Place of birth for the foreign-born population - Haiti (%)
Place of birth for the foreign-born population - Jamaica (%)
Place of birth for the foreign-born population - St. Vincent and the Grenadines (%)
Place of birth for the foreign-born population - Trinidad and Tobago (%)
Place of birth for the foreign-born population - West Indies (%)
Place of birth for the foreign-born population - Other Caribbean (%)
Place of birth for the foreign-born population - Belize (%)
Place of birth for the foreign-born population - Costa Rica (%)
Place of birth for the foreign-born population - El Salvador (%)
Place of birth for the foreign-born population - Guatemala (%)
Place of birth for the foreign-born population - Honduras (%)
Place of birth for the foreign-born population - Mexico (%)
Place of birth for the foreign-born population - Nicaragua (%)
Place of birth for the foreign-born population - Panama (%)
Place of birth for the foreign-born population - Other Central America (%)
Place of birth for the foreign-born population - Argentina (%)
Place of birth for the foreign-born population - Bolivia (%)
Place of birth for the foreign-born population - Brazil (%)
Place of birth for the foreign-born population - Chile (%)
Place of birth for the foreign-born population - Colombia (%)
Place of birth for the foreign-born population - Ecuador (%)
Place of birth for the foreign-born population - Guyana (%)
Place of birth for the foreign-born population - Peru (%)
Place of birth for the foreign-born population - Uruguay (%)
Place of birth for the foreign-born population - Venezuela (%)
Place of birth for the foreign-born population - Other South America (%)
Place of birth for the foreign-born population - Canada (%)
Place of birth for the foreign-born population - Other Northern America (%)
Place of birth for the foreign-born population - Other (%)
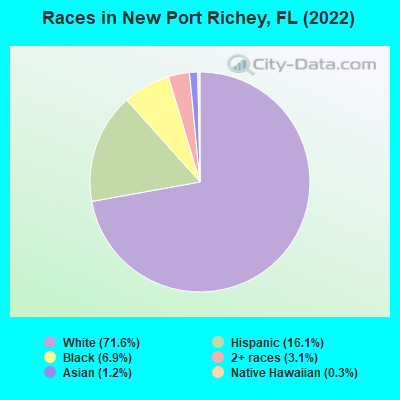
According to 2022 data, the most numerous races in New Port Richey, FL are White alone (12,819 residents), Hispanic (2,878 residents), and Black alone (1,227 residents). 83.5% of New Port Richey residents speak English at home. 8.7% of New Port Richey, FL residents are foreign-born (5.9% born in Latin America, 1.4% born in Europe, 1.0% born in Asia), which is 142.4% less than the foreign-born rate of 21.0% across the entire state of Florida.
Race distribution in New Port Richey
2000 2022
10,458,509 65.4% White alone 2,682,715 16.8% Hispanic 2,264,268 14.2% Black alone 261,693 1.6% Asian alone 236,954 1.5% Two or more races 42,358 0.3% American Indian alone 28,994 0.2% Other race alone 6,887 0.04% Native Hawaiian and Other
11,309,403 50.8% White alone 6,025,039 27.1% Hispanic 3,241,015 14.6% Black alone 861,630 3.9% Two or more races 623,692 2.8% Asian alone 152,054 0.7% Other race alone 22,504 0.1% American Indian alone 9,486 0.04% Native Hawaiian and Other
Income and house value in New Port Richey Median household income in 2022 $46,656 White non-Hispanic householders$24,557 Black householders$54,945 Asian householders$26,408 Some other race householders$35,647 Two or more races householders$33,899 Hispanic or Latino race householdersMedian 2022 house value $208,890 White Non-Hispanic householders$255,158 American Indian or Alaska Native householders$289,180 Some other race householders$190,518 Two or more races householders$165,343 Hispanic or Latino householders
Median age by race in New Port Richey
57.9 Median age for White residents57.1 59.3 37.6 Median age for Black or African American residents37.1 36.5 51.8 Median age for American Indian / Alaska Native residents-769,874,476.2 52.7 37.6 Median age for Asian residents34.1 41.4 -835,555,554.7 Median age for Native Hawaiian / Pacific Islander residents-858,307,848.3 -444,051,825.2 60.7 Median age for Other race residents55.0 57.2 42.9 Median age for Two or more races residents24.6 54.7 58.0 Median age for White alone residents57.4 60.0 43.2 Median age for Hispanic or Latino residents37.0 53.0
Owner/renter occupied households by race in New Port Richey
House owners and renters - White residents 3,906 58.9% Owner occupied2,725 41.1% Renter occupiedHouse owners and renters - Black or African American residents 62 14.9% Owner occupied358 85.1% Renter occupiedHouse owners and renters - American Indian / Alaska Native residents 31 100.0% Renter occupiedHouse owners and renters - Asian residents 79 94.5% Owner occupied5 5.5% Renter occupiedHouse owners and renters - Other race residents 183 52.6% Owner occupied165 47.4% Renter occupiedHouse owners and renters - Two or more races residents 363 50.7% Owner occupied354 49.3% Renter occupiedHouse owners and renters - White alone residents 3,806 58.9% Owner occupied2,657 41.1% Renter occupiedHouse owners and renters - Hispanic or Latino residents 536 53.6% Owner occupied464 46.4% Renter occupied
Language usage in New Port Richey
English speakers - Total 83.5% of residents of New Port Richey speak English at home.
13.5% of residents speak Spanish at home 1,468 62.9% Speak English very well867 37.1% Speak English less than very well2.9% of residents speak other language at home 323 63.6% Speak English very well185 36.4% Speak English less than very well
English speakers - Born in the United States 93.6% of residents of New Port Richey speak English at home.
5.1% of residents speak Spanish at home 464 91.3% Speak English very well44 8.7% Speak English less than very well1.1% of residents speak other language at home 95 88.0% Speak English very well13 12.0% Speak English less than very well
English speakers - Native, born elsewhere 22.0% of residents of New Port Richey speak English at home.
74.6% of residents speak Spanish at home 218 46.6% Speak English very well250 53.4% Speak English less than very well0.8% of residents speak other language at home 5 100.0% Speak English very well
English speakers - Foreign-born 16.4% of residents of New Port Richey speak English at home.
63.0% of residents speak Spanish at home 629 56.7% Speak English very well481 43.3% Speak English less than very well22.2% of residents speak other language at home 242 61.7% Speak English very well150 38.3% Speak English less than very well
White (Caucasian) - Speak only English Native:
97.6% (12,177)Foreign-born:
37.4% (162)
White (Caucasian) - Speak another language Native:
3.1% (388)Foreign-born:
62.6% (272)
Black or African American - Speak only English Native:
99.0% (925)Foreign-born:
63.4% (83)
Asian - Speak only English Native:
20.8% (11)Foreign-born:
5.2% (7)
Asian - Speak another language Native:
57.5% (32)Foreign-born:
90.2% (124)
Other race - Speak another language Native:
93.7% (542)Foreign-born:
99.9% (216)
Two or more races - Speak another language Native:
39.5% (456)Foreign-born:
100.0% (1,121)
White alone - Speak only English Native:
98.1% (11,991)Foreign-born:
40.6% (133)
White alone - Speak another language Native:
1.9% (235)Foreign-born:
59.0% (193)
Hispanic or Latino - Speak only English Native:
33.2% (517)Foreign-born:
4.1% (47)
Hispanic or Latino - Speak another language Native:
67.7% (1,054)Foreign-born:
98.1% (1,118)
Foreign-born residents in New Port Richey 1,551 residents are foreign born (5.9% Latin America , 1.4% Europe , 1.0% Asia ).
This city:
8.7%Florida:
21.1%
Marital status for residents in New Port Richey Marital status - White (Caucasian) population 15 years and over
Males 30.2% Never married40.0% Now married1.2% Separated5.5% Widowed23.2% DivorcedFemales 23.4% Never married34.9% Now married1.3% Separated18.9% Widowed21.5% DivorcedWomen who gave birth in the past 12 months Now married:
86.8% (63)Unmarried:
13.2% (9)
Women who did not give birth in the past 12 months Now married:
34.7% (721)Unmarried:
65.3% (1,358)
Marital status - Black or African American population 15 years and over
Males 34.3% Never married49.3% Now married8.9% Separated2.0% Widowed5.5% DivorcedFemales 53.2% Never married27.2% Now married0.0% Separated7.6% Widowed12.1% DivorcedWomen who did not give birth in the past 12 months Now married:
15.0% (54)Unmarried:
85.0% (309)
Marital status - American Indian / Alaska Native population 15 years and over
Males 71.4% Never married0.0% Now married0.0% Separated0.0% Widowed28.6% DivorcedFemales 28.6% Never married25.0% Now married0.0% Separated17.9% Widowed28.6% DivorcedMarital status - Asian population 15 years and over
Males 38.3% Never married61.7% Now married0.0% Separated0.0% Widowed0.0% DivorcedFemales 0.0% Never married81.7% Now married0.0% Separated18.3% Widowed0.0% DivorcedWomen who gave birth in the past 12 months Now married:
100.0% (6)Unmarried:
0.0% (0)
Women who did not give birth in the past 12 months Now married:
100.0% (42)Unmarried:
0.0% (0)
Marital status - Other race population 15 years and over
Males 17.0% Never married52.3% Now married0.0% Separated0.0% Widowed30.7% DivorcedFemales 10.9% Never married52.7% Now married0.0% Separated0.0% Widowed36.4% DivorcedWomen who did not give birth in the past 12 months Now married:
38.3% (41)Unmarried:
61.7% (66)
Marital status - Two or more races population 15 years and over
Males 51.2% Never married39.7% Now married2.6% Separated0.0% Widowed6.6% DivorcedFemales 32.5% Never married27.5% Now married0.0% Separated19.9% Widowed20.1% DivorcedWomen who did not give birth in the past 12 months Now married:
47.0% (171)Unmarried:
53.0% (193)
Marital status - White alone, not Hispanic / Latino population 15 years and over
Males 30.6% Never married39.1% Now married1.2% Separated5.4% Widowed23.7% DivorcedFemales 24.3% Never married33.8% Now married0.9% Separated19.1% Widowed21.8% DivorcedWomen who gave birth in the past 12 months Now married:
78.7% (37)Unmarried:
21.3% (10)
Women who did not give birth in the past 12 months Now married:
32.5% (659)Unmarried:
67.5% (1,368)
Marital status - Hispanic or Latino population 15 years and over
Males 32.4% Never married50.1% Now married1.6% Separated2.1% Widowed13.8% DivorcedFemales 21.7% Never married41.1% Now married2.7% Separated12.7% Widowed21.8% DivorcedWomen who gave birth in the past 12 months Now married:
100.0% (34)Unmarried:
0.0% (0)
Women who did not give birth in the past 12 months Now married:
53.9% (234)Unmarried:
46.1% (201)
Ancestries in New Port Richey
3,372 33.3% American682 6.7% Irish605 6.0% English498 4.9% German317 3.1% Italian282 2.8% Polish165 1.6% Welsh148 1.5% Norwegian122 1.2% French Canadian99 1.0% Moroccan85 0.8% French82 0.8% British76 0.8% Hungarian75 0.7% Ukrainian71 0.7% Scottish63 0.6% European50 0.5% Swedish44 0.4% Danish41 0.4% West Indian35 0.3% Croatian34 0.3% Haitian34 0.3% Jamaican33 0.3% Greek32 0.3% Eastern European31 0.3% Portuguese30 0.3% Dutch29 0.3% Scandinavian29 0.3% Canadian26 0.3% Czechoslovakian22 0.2% Iraqi21 0.2% Czech19 0.2% Finnish18 0.2% Scotch-Irish18 0.2% African14 0.1% Northern European12 0.1% Icelander6 0.06% Austrian6 0.06% Slavic5 0.05% Cape Verdean4 0.04% Israeli4 0.04% Russian
Geographical mobility in New Port Richey Same house 1 year ago 11,582 87.9% White (Caucasian)1,103 90.1% Black or African American65 86.4% American Indian / Alaska Native188 92.9% Asian719 91.3% Other race1,926 85.3% Two or more races11,204 87.5% White alone, not Hispanic / Latino2,726 94.9% Hispanic or LatinoMoved within same county 630 4.8% White / Caucasian24 1.9% Black or African American5 0.6% Other race82 3.6% Two or more races652 5.1% White alone, not Hispanic / Latino38 1.3% Hispanic or LatinoMoved within same state 307 2.3% White / Caucasian74 6.1% Black or African American69 100.0% Native Hawaiian / Pacific Islander14 1.8% Other race85 3.8% Two or more races288 2.2% White alone, not Hispanic / Latino43 1.5% Hispanic or LatinoMoved from different state 507 3.8% White / Caucasian33 2.7% Black or African American173 7.6% Two or more races505 3.9% White alone, not Hispanic / Latino22 0.8% Hispanic or LatinoMoved from abroad 91 0.7% White16 20.9% American Indian / Alaska Native9 0.4% Two or more races112 0.9% White alone, not Hispanic / Latino22 0.8% Hispanic or Latino
Children Nativity (place of birth) in New Port Richey
Children under 6 years - Living with two parents Both parents native 418 100.0% NativeBoth parents foreign-born 31 100.0% NativeOne native, one foreign-born parent 4 100.0% NativeChildren under 6 years - Living with one parent Native parent 359 100.0% NativeChildren 6 to 17 years - Living with two parents Both parents native 506 98.7% Native7 1.3% Foreign-bornBoth parents foreign-born 86 54.0% Native73 46.0% Foreign-bornOne native, one foreign-born parent 22 100.0% NativeChildren 6 to 17 years - Living with one parent Native parent 627 100.0% NativeForeign-born parent 8 45.6% Native9 54.4% Foreign-born
Grandparents responsible for own grandchildren in New Port Richey
Grandparents (30 to 59 years) White / Caucasian 25 57.7% Responsible for grandchildren18 42.3% Not responsible for grandchildrenOther race 4 100.0% Not responsible for grandchildrenWhite alone, not Hispanic / Latino 26 86.5% Responsible for grandchildren4 13.5% Not responsible for grandchildrenHispanic or Latino 21 100.0% Not responsible for grandchildrenGrandparents (60 years and over) White / Caucasian 72 90.5% Responsible for grandchildren8 9.5% Not responsible for grandchildrenOther race 6 100.0% Not responsible for grandchildrenWhite alone, not Hispanic / Latino 61 88.2% Responsible for grandchildren8 11.8% Not responsible for grandchildrenHispanic or Latino 12 68.0% Responsible for grandchildren6 32.0% Not responsible for grandchildren