Mount Vernon, OH (Ohio) Houses and Residents
| Mount Vernon: | $166,130 |
| Ohio: | $204,100 |
Mean price in 2022:
Detached houses: $190,987
Here: $190,987 State: $254,366 Townhouses or other attached units: $288,660
Here: $288,660 State: $225,733 In 2-unit structures: $152,598
Here: $152,598 State: $144,384 In 3-to-4-unit structures: $88,508
Here: $88,508 State: $203,002 Mobile homes: $16,311
Here: $16,311 State: $62,719
Total population: 16,788 (Urban population: 14,093 (all inside urban clusters), Rural population: 468 (all nonfarm))
Houses: 7,987 (7,238 occupied: 3,793 owner occupied, 3,521 renter occupied)
| % of renters here: | 48% |
| State: | 33% |
Housing density: 950 houses/condos per square mile
Median price asked for vacant for-sale houses and condos in 2022 in this county: $266,912.
Median contract rent in 2022: $705 (lower quartile is $555, upper quartile is $850)
Median rent asked for vacant for-rent units in 2022: $571
Median gross rent in Mount Vernon, OH in 2022: $855
Housing units in Mount Vernon with a mortgage: 2,190 (198 second mortgage, 0 home equity loan, 185 both second mortgage and home equity loan)
Houses without a mortgage: 109
Median household income for houses/condos with a mortgage: $74,794
Median household income for apartments without a mortgage: $57,633
Median monthly housing costs: $831
Compare current foreclosures in Mount Vernon, OH:
| Photo | Address | Area | Beds / Baths | Price | Details |
|---|---|---|---|---|---|

|
#1
Sycamore Rd
Mount Vernon, OH 43050
|
1,566 sq. feet
|
2 baths 3 beds |
show details | |

|
#2
Pine St
Mount Vernon, OH 43050
|
807 sq. feet
|
2 baths 2 beds |
show details | |

|
#3
Braddock St
Mount Vernon, OH 43050
|
1,592 sq. feet
|
2 baths 3 beds |
show details | |

|
#4
Jacobs Dr
Mount Vernon, OH 43050
|
2,136 sq. feet
|
4 baths 3 beds |
show details | |

|
#5
Dixie Dr
Mount Vernon, OH 43050
|
1,008 sq. feet
|
1 baths 2 beds |
show details | |

|
#6
W Gambier St
Mount Vernon, OH 43050
|
1,736 sq. feet
|
2 baths 4 beds |
show details | |

|
#7
Roundhouse Ln
Mount Vernon, OH 43050
|
962 sq. feet
|
1 baths 2 beds |
show details | |

|
#8
Columbus Rd
Mount Vernon, OH 43050
|
1,780 sq. feet
|
1 baths 4 beds |
show details | |

|
#9
Columbus Rd
Mount Vernon, OH 43050
|
1,245 sq. feet
|
1 baths 3 beds |
show details | |

|
#10
N Mulberry St
Mount Vernon, OH 43050
|
1,546 sq. feet
|
1 baths 4 beds |
show details |
| Photo | Address | Area | Beds / Baths | Price | Details |
|---|---|---|---|---|---|

|
#11
Oak St
Mount Vernon, OH 43050
|
1,808 sq. feet
|
2 baths 2 beds |
show details | |

|
#12
E Vine St
Mount Vernon, OH 43050
|
1,999 sq. feet
|
2 baths 4 beds |
show details | |

|
#13
S Edgewood Rd
Mount Vernon, OH 43050
|
1,188 sq. feet
|
1 baths 3 beds |
show details | |

|
#14
Adamson St
Mount Vernon, OH 43050
|
672 sq. feet
|
1 baths 3 beds |
show details | |

|
#15
Highland Dr
Mount Vernon, OH 43050
|
810 sq. feet
|
2 baths 2 beds |
show details | |

|
#16
Wooster Rd
Mount Vernon, OH 43050
|
2,196 sq. feet
|
2 baths 4 beds |
show details | |

|
#17
Granville Rd
Mount Vernon, OH 43050
|
900 sq. feet
|
1 baths 2 beds |
show details | |

|
#18
Murray Rd
Mount Vernon, OH 43050
|
1,300 sq. feet
|
2 baths 3 beds |
show details | |

|
#19
Dunham Rd
Mount Vernon, OH 43050
|
2,016 sq. feet
|
2 baths 4 beds |
show details | |

|
#20
E High St
Mount Vernon, OH 43050
|
2,542 sq. feet
|
1 baths 4 beds |
show details |
| Photo | Address | Area | Beds / Baths | Price | Details |
|---|---|---|---|---|---|

|
#21
Chester St
Mount Vernon, OH 43050
|
786 sq. feet
|
1 baths 2 beds |
show details | |

|
#22
Wooster Rd
Mount Vernon, OH 43050
|
1,650 sq. feet
|
2 baths 3 beds |
show details | |

|
#23
Fairway Dr
Mount Vernon, OH 43050
|
1,165 sq. feet
|
2 baths 2 beds |
show details | |

|
#24
W Vine St
Mount Vernon, OH 43050
|
1,624 sq. feet
|
1 baths 3 beds |
show details | |

|
#25
Berger Rd
Mount Vernon, OH 43050
|
1,176 sq. feet
|
3 baths 5 beds |
show details | |

|
#26
W Burgess St
Mount Vernon, OH 43050
|
1,036 sq. feet
|
1 baths 2 beds |
show details | |

|
#27
Spruce St
Mount Vernon, OH 43050
|
1,170 sq. feet
|
1 baths 2 beds |
show details | |

|
#28
Mansfield Ave
Mount Vernon, OH 43050
|
1,440 sq. feet
|
1 baths 2 beds |
show details | |

|
#29
Elizabeth St
Mount Vernon, OH 43050
|
1,245 sq. feet
|
1 baths 2 beds |
show details | |

|
#30
Belmont Ave
Mount Vernon, OH 43050
|
840 sq. feet
|
1 baths 2 beds |
show details |
| Photo | Address | Area | Beds / Baths | Price | Details |
|---|---|---|---|---|---|

|
#31
Proper Rd
Mount Vernon, OH 43050
|
1,472 sq. feet
|
1 baths 2 beds |
show details | |

|
#32
Belvedere Dr
Mount Vernon, OH 43050
|
1,272 sq. feet
|
1 baths 3 beds |
show details | |

|
#33
W Gambier St
Mount Vernon, OH 43050
|
1,428 sq. feet
|
1 baths 4 beds |
show details | |

|
#34
Eldon Dr
Mount Vernon, OH 43050
|
1,040 sq. feet
|
1 baths 3 beds |
show details | |

|
#35
Northgate Dr
Mount Vernon, OH 43050
|
960 sq. feet
|
1 baths 2 beds |
show details | |

|
#36
Delano St
Mount Vernon, OH 43050
|
1,132 sq. feet
|
1 baths 3 beds |
show details | |

|
#37
Howard St
Mount Vernon, OH 43050
|
1,442 sq. feet
|
1 baths 2 beds |
show details | |

|
#38
S Mckenzie St
Mount Vernon, OH 43050
|
- sq. feet
|
1 baths 3 beds |
show details | |

|
#39
W Vine St
Mount Vernon, OH 43050
|
- sq. feet
|
- baths - beds |
show details | |

|
#40
Upper Fredericktown Rd
Mount Vernon, OH 43050
|
- sq. feet
|
- baths - beds |
show details |
| Photo | Address | Area | Beds / Baths | Price | Details |
|---|---|---|---|---|---|

|
#41
Cherry St
Mount Vernon, OH 43050
|
- sq. feet
|
- baths - beds |
show details | |

|
#42
Wooster Rd
Mount Vernon, OH 43050
|
- sq. feet
|
- baths - beds |
show details | |

|
#43
N Mckenzie St
Mount Vernon, OH 43050
|
- sq. feet
|
- baths - beds |
show details | |

|
#44
Mitchell Ave
Mount Vernon, OH 43050
|
- sq. feet
|
- baths - beds |
show details | |

|
#45
Spruce St
Mount Vernon, OH 43050
|
- sq. feet
|
- baths - beds |
show details | |

|
#46
Shalimar Dr Apt C
Mount Vernon, OH 43050
|
- sq. feet
|
- baths - beds |
show details | |

|
#47
Miller Ave
Mount Vernon, OH 43050
|
- sq. feet
|
- baths - beds |
show details | |

|
#48
Martinsburg Rd
Mount Vernon, OH 43050
|
- sq. feet
|
- baths - beds |
show details | |

|
#49
Darbydale Dr
Mount Vernon, OH 43050
|
- sq. feet
|
- baths - beds |
show details | |

|
Check over 1 million property listings on Foreclosure.com!
|
browse all offers | |||


 | Moving to Dayton area, really love the homes in the Triangle, Mt Vernon and Princeton Heights, any info on these hoods?? (38 replies) |
| Dewine set the standard on how to handle this pandemic (53 replies) |
| 1950's Swifton Village Memories (79 replies) |
| Areas to avoid in Dayton? (47 replies) |
| My Recent Columbus Trip (25 replies) |
| Columbus City and Suburban Development News (2794 replies) |

Median year apartment built: 1965
Household type by relationship:
Households: 16,834- Male householders: 2,918 (1,097 living alone), Female householders: 4,251 (1,690 living alone)
2,726 spouses (2,676 opposite-sex spouses), 425 unmarried partners, (370 opposite-sex unmarried partners), 4,085 children (3,766 natural, 197 adopted, 121 stepchildren), 191 grandchildren, 81 brothers or sisters, 169 parents, 0 foster children, 195 other relatives, 492 non-relatives
- In group quarters: 1,295
Size of family households: 2,239 2-persons, 738 3-persons, 678 4-persons, 134 5-persons, 171 6-persons, 4 7-or-more-persons.
Size of nonfamily households: 2,876 1-person, 449 2-persons, 40 3-persons.
1,636 married couples with children.
1,339 single-parent households (232 men, 1,107 women).
96.7% of residents of Mount Vernon speak English at home.
2.0% of residents speak Spanish at home (64% speak English very well, 36% don't speak English at all).
0.4% of residents speak other Indo-European language at home (63% speak English very well, 26% speak English well, 11% speak English not well).
0.8% of residents speak Asian or Pacific Island language at home (83% speak English very well, 17% speak English well).
Foreign born population: 414 (2.5%)
(41.5% of them are naturalized citizens)
| Here: | 6.6 |
| State: | 6.7 |
| Here: | 4.7 |
| State: | 4.4 |

- Bedrooms in owner-occupied houses and condos in Mount Vernon, Ohio
- 0no bedroom
- 161 bedroom
- 9192 bedrooms
- 1,9183 bedrooms
- 8584 bedrooms
- 835+ bedrooms

- Bedrooms in renter-occupied apartments in Mount Vernon, Ohio
- 57no bedroom
- 8761 bedroom
- 1,4302 bedrooms
- 7913 bedrooms
- 2694 bedrooms
- 985+ bedrooms

- Cars and other vehicles available in Mount Vernon in owner-occupied houses/condos
- 92no vehicle
- 1,1661 vehicle
- 1,7032 vehicles
- 6043 vehicles
- 2054 vehicles
- 235+ vehicles

- Cars and other vehicles available in Mount Vernon in renter-occupied apartments
- 495no vehicle
- 1,7731 vehicle
- 9032 vehicles
- 2113 vehicles
- 1014 vehicles
- 385+ vehicles

- Rooms in owner-occupied houses in Mount Vernon, Ohio
- 01 room
- 02 rooms
- 443 rooms
- 2454 rooms
- 6055 rooms
- 8956 rooms
- 7247 rooms
- 5138 rooms
- 7669+ rooms

- Rooms in renter-occupied apartments in Mount Vernon, Ohio
- 351 room
- 1042 rooms
- 6963 rooms
- 8484 rooms
- 4245 rooms
- 6816 rooms
- 5197 rooms
- 1358 rooms
- 789+ rooms


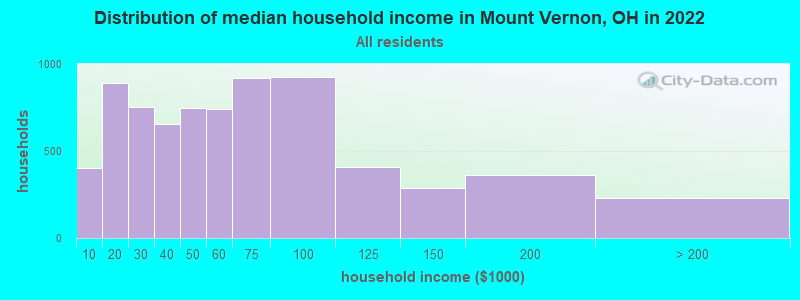
Mount Vernon, OH household income distribution

- 402Less than $10,000
- 892$10,000 to $19,999
- 751$20,000 to $29,999
- 656$30,000 to $39,999
- 745$40,000 to $49,999
- 742$50,000 to $59,999
- 917$60,000 to $74,999
- 925$75,000 to $99,999
- 410$100,000 to $124,999
- 286$125,000 to $149,999
- 363$150,000 to $199,999
- 228$200,000 or more
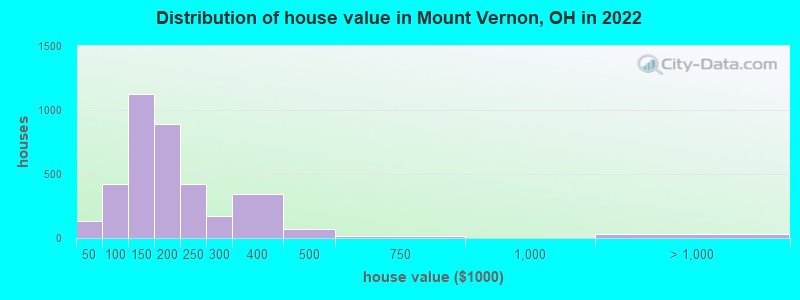
Home value of owner - occupied houses in 2022 in Mount Vernon, OH
-
- 53Less than $10,000
- 8$10,000 to $14,999
- 11$15,000 to $19,999
- 30$20,000 to $24,999
- 30$40,000 to $49,999
- 24$50,000 to $59,999
- 42$60,000 to $69,999
- 30$70,000 to $79,999
- 180$80,000 to $89,999
- 110$90,000 to $99,999
- 592$100,000 to $124,999
- 530$125,000 to $149,999
- 643$150,000 to $174,999
- 243$175,000 to $199,999
- 425$200,000 to $249,999
- 171$250,000 to $299,999
- 342$300,000 to $399,999
- 73$400,000 to $499,999
- 13$500,000 to $749,999
- 19$1,000,000 to $1,499,999
- 12$2,000,000 or more
Rent paid by renters in 2022 in Mount Vernon, OH
-
- 24Less than $100
- 16$100 to $149
- 20$150 to $199
- 159$200 to $249
- 32$250 to $299
- 61$300 to $349
- 21$350 to $399
- 100$400 to $449
- 180$450 to $499
- 219$500 to $549
- 248$550 to $599
- 125$600 to $649
- 429$650 to $699
- 341$700 to $749
- 381$750 to $799
- 392$800 to $899
- 153$900 to $999
- 249$1,000 to $1,249
- 23$1,250 to $1,499
- 14$2,000 to $2,499
- 20$2,500 to $2,999
- 212No cash rent


Percentage of workers working in this county: 77.5%
Number of people working at home: 976 (12.5% of all workers)

Travel time to work (commute)
- Less than 5 minutes: 547
- 5 to 9 minutes: 1,481
- 10 to 14 minutes: 1,675
- 15 to 19 minutes: 953
- 20 to 24 minutes: 266
- 25 to 29 minutes: 192
- 30 to 34 minutes: 283
- 35 to 39 minutes: 85
- 40 to 44 minutes: 57
- 45 to 59 minutes: 627
- 60 to 89 minutes: 344
- 90 or more minutes: 243
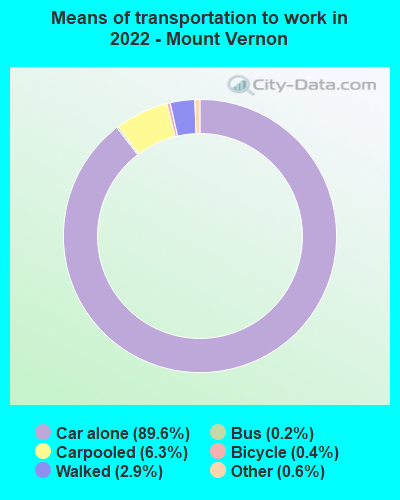
Means of transportation to work:
- Drove a car alone: 10,579 (80.9%)
- Carpooled: 797 (6.1%)
- Bus: 23 (0.2%)
- Taxi: 81 (0.6%)
- Bicycle: 57 (0.4%)
- Walked: 347 (2.7%)
- Worked at home: 976 (7.5%)

- Unemployment by race in 2022
- Unemployment rate for White non-Hispanic residents
- 2.4%Males
- 2.2%Females
- Unemployment rate for other race residents
- 8.1%Males
- 3.8%Females

- Year of entry for the foreign-born population in Mount Vernon, Ohio
- 2452010 or later
- 42000 to 2009
- 1001990 to 1999
- 241980 to 1989
- 141970 to 1979
- 136Before 1970

First ancestries reported:
- English: 1,724 (24.3%)
- American: 1,339 (18.9%)
- German: 1,032 (14.5%)
- Irish: 524 (7.4%)
- Italian: 402 (5.7%)
- European: 159 (2.2%)
- Polish: 140 (2.0%)
- Scottish: 129 (1.8%)
- Norwegian: 64 (0.9%)
- Greek: 52 (0.7%)
- Scotch-Irish: 51 (0.7%)
- Dutch: 40 (0.6%)
- French: 34 (0.5%)
- Hungarian: 31 (0.4%)
- Welsh: 26 (0.4%)
- Ukrainian: 25 (0.4%)
- Turkish: 22 (0.3%)
- Eastern European: 17 (0.2%)
- French Canadian: 15 (0.2%)
- Scandinavian: 9 (0.1%)
- Pennsylvania German: 7 (0.10%)
- Swiss: 3 (0.04%)
Most common places of birth for foreign-born residents (%):
| Mount Vernon: | 40.3% (167) |
| Ohio: | 7.8% (44,796) |
| Mount Vernon: | 15.9% (66) |
| Ohio: | 3.1% (17,818) |
| Mount Vernon: | 11.1% (46) |
| Ohio: | 11.6% (66,525) |
| Mount Vernon: | 9.7% (40) |
| Ohio: | 2.2% (12,846) |
| Mount Vernon: | 4.1% (17) |
| Ohio: | 2.0% (11,398) |
| Mount Vernon: | 3.6% (15) |
| Ohio: | 1.4% (8,101) |
| Mount Vernon: | 2.7% (11) |
| Ohio: | 0.0% (110) |
| Mount Vernon: | 2.4% (10) |
| Ohio: | 1.0% (5,979) |
| Mount Vernon: | 1.9% (8) |
| Ohio: | 0.3% (1,897) |
Place of birth for U.S.-born residents:
- This state: 13,098
- Other state: 3,244
- Northeast: 726
- Midwest: 874
- South: 1,247
- West: 399
86.2% of Mount Vernon residents lived in the same house 1 years ago.
Out of people who lived in different houses, 31.7% lived in this county.
Out of people who lived in different counties, 61.5% lived in Ohio.
| Mount Vernon: | 86.2% |
| State average: | 87.8% |
Education attainment for males 25 years and older:
- No schooling: 115
- Nursery to 4th grade: 0
- 5th and 6th grade: 95
- 7th and 8th grade: 47
- 9th grade: 161
- 10th grade: 70
- 11th grade: 26
- 12th grade, no diploma: 89
- High school graduate (or equivalency): 1,989
- Less than 1 year of college: 226
- Some college more than 1 year, no degree: 593
- Associate degree: 449
- Bachelor's degree: 762
- Master's degree: 289
- Professional school degree: 124
- Doctorate degree: 88

Education attainment for females 25 years and older:
- No schooling: 48
- Nursery to 4th grade: 0
- 5th and 6th grade: 61
- 7th and 8th grade: 66
- 9th grade: 0
- 10th grade: 87
- 11th grade: 94
- 12th grade, no diploma: 158
- High school graduate (or equivalency): 2,649
- Less than 1 year of college: 398
- Some college more than 1 year, no degree: 615
- Associate degree: 338
- Bachelor's degree: 1,230
- Master's degree: 555
- Professional school degree: 40
- Doctorate degree: 42


Housing units in structures:
- One, detached: 5,018
- One, attached: 416
- Two: 374
- 3 or 4: 1,042
- 5 to 9: 613
- 10 to 19: 40
- 20 to 49: 154
- 50 or more: 102
- Mobile homes: 223
Housing units lacking complete kitchen facilities in 2022: 1.7%
House/condo owner moved in on average 10 years ago
Renter moved in on average 6 years ago

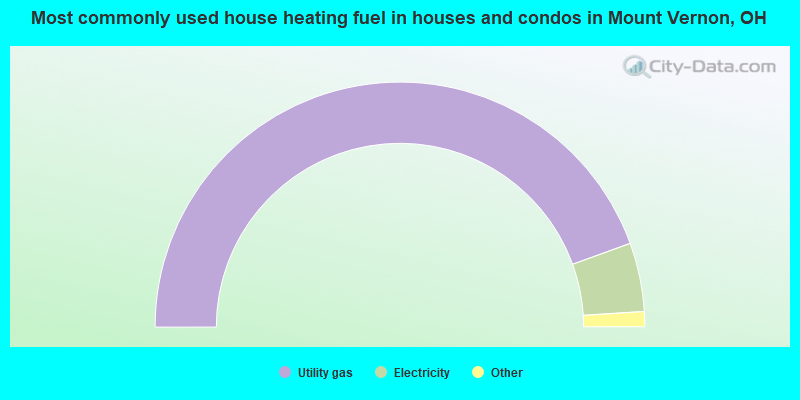
- 89.0%Utility gas
- 9.1%Electricity
- 1.0%Wood
- 0.9%Bottled, tank, or LP gas
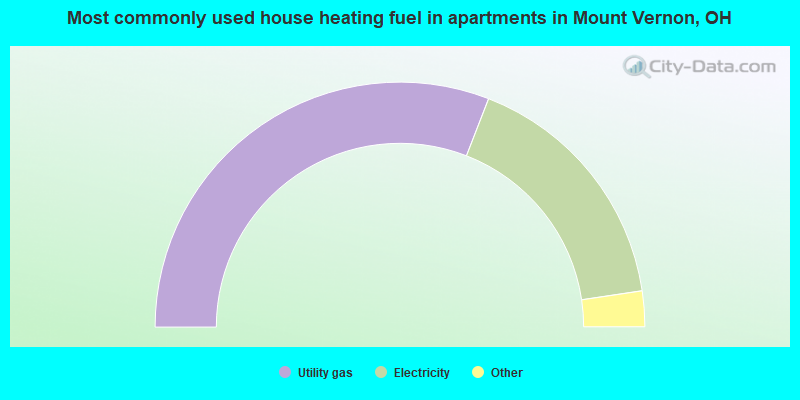
- 61.8%Utility gas
- 33.5%Electricity
- 3.3%Bottled, tank, or LP gas
- 0.9%No fuel used
- 0.5%Other fuel
Private vs. public school enrollment:
| Here: | 4.4% |
| Ohio: | 16.0% |
| Here: | 1.6% |
| Ohio: | 13.1% |
| Here: | 69.6% |
| Ohio: | 22.3% |


