Races in Mount Vernon, Ohio (OH) Detailed Stats
Ancestries, Foreign-born residents, place of birth
Settings
X


Recent posts about races in Mount Vernon, Ohio on our local forum with over 2,400,000 registered users:
 | Dewine set the standard on how to handle this pandemic (53 replies) |
| Is Cleveland Midwest or East (80 replies) |
| 1950's Swifton Village Memories (79 replies) |
| Areas to avoid in Dayton? (47 replies) |
| Mount Vernon Haunted Places (2 replies) |
| Relocating to Dayton from Cincinnati... (34 replies) |
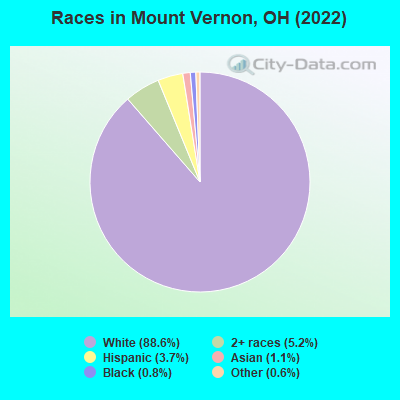
According to 2022 data, the most numerous races in Mount Vernon, OH are White alone (14,917 residents), Black alone (139 residents), and Two or more races (880 residents). 96.6% of Mount Vernon residents speak English at home. 2.5% of Mount Vernon, OH residents are foreign-born (1.0% born in Asia, 1.0% born in Latin America, 0.4% born in Europe), which is 62.6% less than the foreign-born rate of 4.0% across the entire state of Ohio.
Race distribution in Mount Vernon
2000
2022

- 13,81896.1%White alone
- 1631.1%Black alone
- 1411.0%Two or more races
- 1250.9%Hispanic
- 780.5%Asian alone
- 420.3%American Indian alone
- 80.06%Other race alone

-
- 14,91788.6%White alone
- 8805.2%Two or more races
- 6193.7%Hispanic
- 1891.1%Asian alone
- 1390.8%Black alone
- 970.6%Other race alone
- 110.07%American Indian alone
2000
2022
-
- 9,538,11184.0%White alone
- 1,290,66211.4%Black alone
- 217,1231.9%Hispanic
- 137,7701.2%Two or more races
- 131,6701.2%Asian alone
- 21,9850.2%American Indian alone
- 13,4830.1%Other race alone
- 2,3360.02%Native Hawaiian and Other
Pacific Islander alone

-
- 8,948,79376.1%White alone
- 1,401,40311.9%Black alone
- 529,2914.5%Two or more races
- 517,2324.4%Hispanic
- 293,3872.5%Asian alone
- 52,8050.4%Other race alone
- 9,7850.08%American Indian alone
- 3,3620.03%Native Hawaiian and Other
Pacific Islander alone

Income and house value in Mount Vernon
- Median household income in 2022
- $52,342White non-Hispanic householders
- $35,988Black householders
- $56,004Asian householders
- $52,252Two or more races householders
- Median 2022 house value
- $165,916White Non-Hispanic householders
- $142,183Black or African American householders
- $138,976American Indian or Alaska Native householders
- $327,343Asian householders
Household income for White non-Hispanic householders

Household income for Black householders

Household income for Asian householders

Household income for Some other race householders

Household income for Two or more races householders

Household income for Hispanic or Latino race householders

Median age by race in Mount Vernon
- 42.0Median age for White residents
- 40.7Males
- 45.4Females
- 34.1Median age for Black or African American residents
- 33.9Males
- 60.9Females
- 7.3Median age for American Indian / Alaska Native residents
- -685,185,184.5Males
- -658,163,264.6Females
- 35.6Median age for Asian residents
- 44.6Males
- 35.7Females
- -800,387,596.1Median age for Native Hawaiian / Pacific Islander residents
- -750,242,953.6Males
- -805,394,989.6Females
- 16.3Median age for Other race residents
- 17.1Males
- 14.7Females
- 35.2Median age for Two or more races residents
- 39.5Males
- 35.2Females
- 41.9Median age for White alone residents
- 40.7Males
- 45.8Females
- 21.8Median age for Hispanic or Latino residents
- 19.4Males
- 22.0Females
Owner/renter occupied households by race in Mount Vernon
- House owners and renters - White residents
- 3,59153.2%Owner occupied
- 3,15746.8%Renter occupied
- House owners and renters - Black or African American residents
- 2123.2%Owner occupied
- 6976.8%Renter occupied
- House owners and renters - American Indian / Alaska Native residents
- 15100.0%Renter occupied
- House owners and renters - Asian residents
- 5973.0%Owner occupied
- 2227.0%Renter occupied
- House owners and renters - Other race residents
- 8194.2%Owner occupied
- 55.8%Renter occupied
- House owners and renters - Two or more races residents
- 3715.0%Owner occupied
- 21085.0%Renter occupied
- House owners and renters - White alone residents
- 3,59853.7%Owner occupied
- 3,10646.3%Renter occupied
- House owners and renters - Hispanic or Latino residents
- 7641.2%Owner occupied
- 10958.8%Renter occupied
Language usage in Mount Vernon
- English speakers - Total
- 96.6% of residents of Mount Vernon speak English at home.
- 1.9% of residents speak Spanish at home
- 20666.9%Speak English very well
- 10233.1%Speak English less than very well
- 1.3% of residents speak other language at home
- 17079.1%Speak English very well
- 4520.9%Speak English less than very well
- English speakers - Born in the United States
- 98.7% of residents of Mount Vernon speak English at home.
- 0.3% of residents speak Spanish at home
- 9100.0%Speak English very well
- 0.8% of residents speak other language at home
- 2177.8%Speak English very well
- 622.2%Speak English less than very well
All residents speak only English at home
- English speakers - Foreign-born
- 23.2% of residents of Mount Vernon speak English at home.
- 41.5% of residents speak Spanish at home
- 7241.9%Speak English very well
- 10058.1%Speak English less than very well
- 35.7% of residents speak other language at home
- 11074.3%Speak English very well
- 3825.7%Speak English less than very well
White (Caucasian) - Speak only English
| Native: | 99.1% (14,226) |
| Foreign-born: | 85.1% (71) |
White (Caucasian) - Speak another language
| Native: | 1.0% (143) |
| Foreign-born: | 21.5% (18) |
Asian - Speak only English
| Native: | 100.0% (57) |
| Foreign-born: | 10.6% (15) |
Other race - Speak only English
| Native: | 97.0% (178) |
| Foreign-born: | 2.0% (4) |
Two or more races - Speak another language
| Native: | 0.3% (3) |
| Foreign-born: | 100.0% (16) |
White alone - Speak only English
| Native: | 99.0% (14,145) |
| Foreign-born: | 78.8% (73) |
White alone - Speak another language
| Native: | 1.0% (137) |
| Foreign-born: | 22.2% (21) |
Hispanic or Latino - Speak only English
| Native: | 81.2% (262) |
| Foreign-born: | 2.1% (4) |
Hispanic or Latino - Speak another language
| Native: | 17.8% (57) |
| Foreign-born: | 98.3% (187) |
Foreign-born residents in Mount Vernon
414 residents are foreign born (1.0% Asia, 1.0% Latin America, 0.4% Europe).
| This city: | 2.5% |
| Ohio: | 4.9% |


Marital status for residents in Mount Vernon
Marital status - White (Caucasian) population 15 years and over
- Males
- 37.2%Never married
- 44.5%Now married
- 1.8%Separated
- 3.3%Widowed
- 13.2%Divorced
- Females
- 30.0%Never married
- 37.2%Now married
- 2.1%Separated
- 11.1%Widowed
- 19.6%Divorced
Women who gave birth in the past 12 months
| Now married: | 21.7% (38) |
| Unmarried: | 78.3% (136) |
Women who did not give birth in the past 12 months
| Now married: | 30.8% (1,110) |
| Unmarried: | 69.2% (2,496) |
Marital status - Black or African American population 15 years and over
- Males
- 89.6%Never married
- 10.4%Now married
- 0.0%Separated
- 0.0%Widowed
- 0.0%Divorced
- Females
- 59.6%Never married
- 25.8%Now married
- 0.0%Separated
- 0.0%Widowed
- 14.6%Divorced
Women who did not give birth in the past 12 months
| Now married: | 47.1% (16) |
| Unmarried: | 52.9% (18) |
Marital status - Asian population 15 years and over
- Males
- 40.7%Never married
- 59.3%Now married
- 0.0%Separated
- 0.0%Widowed
- 0.0%Divorced
- Females
- 0.0%Never married
- 70.3%Now married
- 0.0%Separated
- 0.0%Widowed
- 29.7%Divorced
Women who did not give birth in the past 12 months
| Now married: | 100.0% (55) |
| Unmarried: | 0.0% (0) |
Marital status - Other race population 15 years and over
- Males
- 17.1%Never married
- 82.9%Now married
- 0.0%Separated
- 0.0%Widowed
- 0.0%Divorced
- Females
- 15.3%Never married
- 84.7%Now married
- 0.0%Separated
- 0.0%Widowed
- 0.0%Divorced
Women who gave birth in the past 12 months
| Now married: | 100.0% (81) |
| Unmarried: | 0.0% (0) |
Women who did not give birth in the past 12 months
| Now married: | 0.0% (0) |
| Unmarried: | 100.0% (15) |
Marital status - Two or more races population 15 years and over
- Males
- 67.0%Never married
- 12.0%Now married
- 0.0%Separated
- 0.0%Widowed
- 21.1%Divorced
- Females
- 56.7%Never married
- 24.4%Now married
- 8.9%Separated
- 0.0%Widowed
- 10.0%Divorced
Women who did not give birth in the past 12 months
| Now married: | 27.3% (98) |
| Unmarried: | 72.7% (259) |
Marital status - White alone, not Hispanic / Latino population 15 years and over
- Males
- 37.2%Never married
- 44.4%Now married
- 1.8%Separated
- 3.4%Widowed
- 13.3%Divorced
- Females
- 30.4%Never married
- 36.3%Now married
- 2.1%Separated
- 11.3%Widowed
- 19.9%Divorced
Women who gave birth in the past 12 months
| Now married: | 21.7% (38) |
| Unmarried: | 78.3% (137) |
Women who did not give birth in the past 12 months
| Now married: | 29.3% (1,043) |
| Unmarried: | 70.7% (2,522) |
Marital status - Hispanic or Latino population 15 years and over
- Males
- 12.3%Never married
- 87.7%Now married
- 0.0%Separated
- 0.0%Widowed
- 0.0%Divorced
- Females
- 11.7%Never married
- 88.3%Now married
- 0.0%Separated
- 0.0%Widowed
- 0.0%Divorced
Women who gave birth in the past 12 months
| Now married: | 100.0% (65) |
| Unmarried: | 0.0% (0) |
Women who did not give birth in the past 12 months
| Now married: | 93.0% (85) |
| Unmarried: | 7.0% (6) |
Ancestries in Mount Vernon

- 1,72424.3%English
- 1,33918.9%American
- 1,03214.5%German
- 5247.4%Irish
- 4025.7%Italian
- 1592.2%European
- 1402.0%Polish
- 1291.8%Scottish
- 640.9%Norwegian
- 520.7%Greek
- 510.7%Scotch-Irish
- 400.6%Dutch
- 340.5%French
- 310.4%Hungarian
- 260.4%Welsh
- 250.4%Ukrainian
- 220.3%Turkish
- 170.2%Eastern European
- 150.2%French Canadian
- 90.1%Scandinavian
- 70.10%Pennsylvania German
- 30.04%Swiss

Geographical mobility in Mount Vernon

- Same house 1 year ago
- 12,70685.4%White (Caucasian)
- 11675.8%Black or African American
- 91100.0%American Indian / Alaska Native
- 205100.0%Asian
- 36396.3%Other race
- 97295.3%Two or more races
- 12,73685.7%White alone, not Hispanic / Latino
- 45080.6%Hispanic or Latino

-
- Moved within same county
- 9396.3%White / Caucasian
- 2113.7%Black or African American
- 383.7%Two or more races
- 9576.4%White alone, not Hispanic / Latino
- 162.8%Hispanic or Latino

-
- Moved within same state
- 7164.8%White / Caucasian
- 95.8%Black or African American
- 71.7%Other race
- 30.3%Two or more races
- 6344.3%White alone, not Hispanic / Latino
- 10518.9%Hispanic or Latino

-
- Moved from different state
- 4403.0%White / Caucasian
- 74.4%Black or African American
- 41.0%Other race
- 212.0%Two or more races
- 4463.0%White alone, not Hispanic / Latino
- 30.5%Hispanic or Latino

-
- Moved from abroad
- 710.5%White
- 40.4%Two or more races
- 790.5%White alone, not Hispanic / Latino
- 30.5%Hispanic or Latino

Children Nativity (place of birth) in Mount Vernon
Place of birth for residents in Mount Vernon
![Place of birth for the foreign-born population - Regions]()
- 178Americas
- 172Asia
- 172Latin America
- 156Central America
- 76South Eastern Asia
- 64Europe
- 49South Central Asia
- 39Western Europe
- 37Eastern Asia
- 24Northern Europe
- 15South America
- 8Western Asia
- 6Northern America

![Place of birth for the foreign-born population - Countries]()
- 156Mexico
- 76Philippines
- 49India
- 39Germany
- 21Japan
- 16Korea
- 11Bolivia
- 10Norway
- 10England
- 8Turkey
- 6Canada
- 4Colombia
- 3Sweden
- 1United Kingdom

Grandparents responsible for own grandchildren in Mount Vernon
Zip codes: 43050.