Montague, MA (Massachusetts) Houses and Residents
| Montague: | $279,830 |
| Massachusetts: | $534,700 |
Total population: 8,437 (Urban population: 6,169 (all inside urban clusters), Rural population: 2,320 (45 farm, 2,275 nonfarm))
Houses: 3,844 (3,616 occupied: 2,194 owner occupied, 1,422 renter occupied)
| % of renters here: | 39% |
| State: | 38% |
Housing density: 126 houses/condos per square mile
Median price asked for vacant for-sale houses and condos in 2022 in this county: $191,319.
Median contract rent in 2022: $780 (lower quartile is $424, upper quartile is $1,067)
Median rent asked for vacant for-rent units in 2022: $710
Median gross rent in Montague, MA in 2022: $905
Housing units in Montague with a mortgage: 1,118 (34 second mortgage, 162 home equity loan, 0 both second mortgage and home equity loan)
Houses without a mortgage: 571
Compare current foreclosures near Montague, MA:
| Photo | Address | Area | Beds / Baths | Price | Details |
|---|---|---|---|---|---|

|
#1
Lampblack Rd
Greenfield, MA 01301
|
2,078 sq. feet
|
1 baths 3 beds |
$369,900
|
show details |

|
#2
Mechanic St
Winchester, NH 03470
|
1,918 sq. feet
|
2 baths 4 beds |
show details | |

|
#3
Wilson Ave
Athol, MA 01331
|
1,119 sq. feet
|
1 baths 2 beds |
show details | |

|
#4
Sanders St
Athol, MA 01331
|
2,185 sq. feet
|
2 baths 4 beds |
show details | |

|
#5
Sabans Rd
Conway, MA 01341
|
1,246 sq. feet
|
2 baths 3 beds |
show details | |

|
#6
Leverett Rd
Shutesbury, MA 01072
|
1,131 sq. feet
|
1 baths 3 beds |
show details | |

|
#7
Elmer Rd
Conway, MA 01341
|
1,866 sq. feet
|
3 baths 3 beds |
show details | |

|
#8
Graves Rd
Conway, MA 01341
|
1,440 sq. feet
|
1 baths 3 beds |
show details | |

|
#9
Hapgood St
Athol, MA 01331
|
1,344 sq. feet
|
3 baths 3 beds |
show details | |

|
#10
Stone Rd
Orange, MA 01364
|
1,312 sq. feet
|
1 baths 3 beds |
show details |
| Photo | Address | Area | Beds / Baths | Price | Details |
|---|---|---|---|---|---|

|
#11
Mount Warner Rd
Hadley, MA 01035
|
1,008 sq. feet
|
1 baths 3 beds |
show details | |

|
#12
Hillside Rd
South Deerfield, MA 01373
|
1,449 sq. feet
|
3 baths 3 beds |
show details | |

|
#13
Bryant St
Athol, MA 01331
|
975 sq. feet
|
2 baths 3 beds |
show details | |

|
#14
West St
Greenfield, MA 01301
|
1,858 sq. feet
|
2 baths 3 beds |
show details | |

|
#15
Aldrich St
Northfield, MA 01360
|
2,486 sq. feet
|
2 baths 5 beds |
show details | |

|
#16
S Main St
Athol, MA 01331
|
1,805 sq. feet
|
2 baths 2 beds |
show details | |

|
#17
Brickyard Rd
Athol, MA 01331
|
1,685 sq. feet
|
2 baths 4 beds |
show details | |

|
#18
Tully Rd
Orange, MA 01364
|
1,532 sq. feet
|
1 baths 3 beds |
show details | |

|
#19
Dell St
Turners Falls, MA 01376
|
720 sq. feet
|
1 baths 1 beds |
show details | |

|
#20
Eddy St
Orange, MA 01364
|
1,116 sq. feet
|
1 baths 2 beds |
show details |
| Photo | Address | Area | Beds / Baths | Price | Details |
|---|---|---|---|---|---|

|
#21
E River St
Orange, MA 01364
|
1,332 sq. feet
|
1 baths 3 beds |
show details | |

|
#22
Charden Ln
Athol, MA 01331
|
1,200 sq. feet
|
1 baths 3 beds |
show details | |

|
#23
Wildflower Dr
Amherst, MA 01002
|
2,330 sq. feet
|
2 baths 4 beds |
show details | |

|
#24
N Main St, Unit A
Orange, MA 01364
|
598 sq. feet
|
1 baths 2 beds |
show details | |

|
#25
W Main St
New Salem, MA 01355
|
4,624 sq. feet
|
3 baths 6 beds |
show details | |

|
#26
Spring St
Orange, MA 01364
|
868 sq. feet
|
1 baths 1 beds |
show details | |

|
#27
Shays St # 1
Amherst, MA 01002
|
925 sq. feet
|
2 baths 3 beds |
show details | |

|
#28
Maynard St
Orange, MA 01364
|
1,640 sq. feet
|
2 baths 3 beds |
show details | |

|
#29
South St
Athol, MA 01331
|
1,135 sq. feet
|
1 baths 3 beds |
show details | |

|
#30
Meadow St
Amherst, MA 01002
|
1,100 sq. feet
|
1 baths 3 beds |
show details |
| Photo | Address | Area | Beds / Baths | Price | Details |
|---|---|---|---|---|---|

|
#31
Oak Ave
Athol, MA 01331
|
1,362 sq. feet
|
2 baths 4 beds |
show details | |

|
#32
Jacksonville Rd
Colrain, MA 01340
|
1,108 sq. feet
|
1 baths 2 beds |
show details | |

|
#33
Old South Rd
Orange, MA 01364
|
1,078 sq. feet
|
1 baths 3 beds |
show details | |

|
#34
Leonard St
Athol, MA 01331
|
2,542 sq. feet
|
2 baths 4 beds |
show details | |

|
#35
White Pond Rd
Athol, MA 01331
|
2,340 sq. feet
|
2 baths 5 beds |
show details | |

|
#36
East Rd
Orange, MA 01364
|
960 sq. feet
|
1 baths 3 beds |
show details | |

|
#37
Bridge St # 1
Hatfield, MA 01038
|
3,300 sq. feet
|
3 baths 4 beds |
show details | |

|
#38
Daniel Shays Hwy
Athol, MA 01331
|
1,736 sq. feet
|
2 baths 4 beds |
show details | |

|
#39
Chestnut St
West Hatfield, MA 01088
|
1,248 sq. feet
|
1 baths 3 beds |
show details | |

|
#40
Dwight Cross Rd
Colrain, MA 01340
|
1,092 sq. feet
|
1 baths 3 beds |
show details |
| Photo | Address | Area | Beds / Baths | Price | Details |
|---|---|---|---|---|---|

|
#41
Pierce St
Athol, MA 01331
|
1,872 sq. feet
|
2 baths 3 beds |
show details | |

|
#42
Prescott Ln
Orange, MA 01364
|
2,064 sq. feet
|
2 baths 3 beds |
show details | |

|
#43
Lake Mattawa Rd
Orange, MA 01364
|
1,666 sq. feet
|
1 baths 3 beds |
show details | |

|
#44
Allen St
Athol, MA 01331
|
2,154 sq. feet
|
2 baths 5 beds |
show details | |

|
#45
Chestnut St
Athol, MA 01331
|
1,503 sq. feet
|
2 baths 4 beds |
show details | |

|
#46
North St
Hatfield, MA 01038
|
1,900 sq. feet
|
1 baths 3 beds |
show details | |

|
#47
Enfield Rd
Amherst, MA 01002
|
2,250 sq. feet
|
2 baths 4 beds |
show details | |

|
#48
Rogers Ave
Orange, MA 01364
|
1,296 sq. feet
|
1 baths 3 beds |
show details | |

|
#49
Everett St
Athol, MA 01331
|
1,080 sq. feet
|
1 baths 3 beds |
show details | |

|
Check over 1 million property listings on Foreclosure.com!
|
browse all offers | |||
Latest news about housing in Montague, MA collected exclusively by city-data.com from local newspapers, TV, and radio stations

 | How Much Massachusetts Households Make Per Year: Census Data (37 replies) |
| When is the insanity going to end? There has to be a real estate market crash, right? (99 replies) |
| New Job in Springfield MA (Baystate) Housing Options (33 replies) |
| Is Massachusetts really just as expensive as NJ? (57 replies) |
| Coronavirus in Massachusetts (18048 replies) |
| Town in Massachusetts You’d Least Like To Live In? (179 replies) |

Household type by relationship:
Households: 69,891- In family households: 54,236 (12,210 male householders, 6,107 female householders)
13,655 spouses, 17,750 children (16,448 natural, 543 adopted, 759 stepchildren), 917 grandchildren, 418 brothers or sisters, 464 parents, foster children, 409 other relatives, 1,987 non-relatives
- In nonfamily households: 15,655 (5,446 male householders (3,978 living alone)), 6,699 female householders (5,318 living alone)), 3,510 nonrelatives
- In group quarters: 1,481 (665 institutionalized population)
11,122 married couples with children.
4,422 single-parent households (1,025 men, 3,397 women).
90.6% of residents of Montague speak English at home.
2.3% of residents speak Spanish at home (62% speak English very well, 28% speak English well, 4% speak English not well, 6% don't speak English at all).
6.5% of residents speak other Indo-European language at home (65% speak English very well, 20% speak English well, 13% speak English not well, 2% don't speak English at all).
0.5% of residents speak Asian or Pacific Island language at home (44% speak English very well, 28% speak English well, 28% speak English not well).
0.1% of residents speak other language at home (100% speak English very well).
Foreign born population: 545 (6.5%)
(42.0% of them are naturalized citizens)
| Here: | 6.4 |
| State: | 6.5 |
| Here: | 4.0 |
| State: | 4.0 |

- Bedrooms in owner-occupied houses and condos in Montague, Massachusetts
- 0no bedroom
- 511 bedroom
- 5852 bedrooms
- 9693 bedrooms
- 4724 bedrooms
- 1175+ bedrooms

- Bedrooms in renter-occupied apartments in Montague, Massachusetts
- 30no bedroom
- 4211 bedroom
- 6082 bedrooms
- 3113 bedrooms
- 494 bedrooms
- 35+ bedrooms

- Cars and other vehicles available in Montague in owner-occupied houses/condos
- 142no vehicle
- 5571 vehicle
- 1,1492 vehicles
- 2483 vehicles
- 734 vehicles
- 255+ vehicles

- Cars and other vehicles available in Montague in renter-occupied apartments
- 324no vehicle
- 7101 vehicle
- 3532 vehicles
- 163 vehicles
- 194 vehicles
- 05+ vehicles

- Rooms in owner-occupied houses in Montague, Massachusetts
- 01 room
- 82 rooms
- 133 rooms
- 2484 rooms
- 5145 rooms
- 6396 rooms
- 3687 rooms
- 2048 rooms
- 2009+ rooms

- Rooms in renter-occupied apartments in Montague, Massachusetts
- 301 room
- 862 rooms
- 2623 rooms
- 5194 rooms
- 3155 rooms
- 1306 rooms
- 527 rooms
- 138 rooms
- 159+ rooms


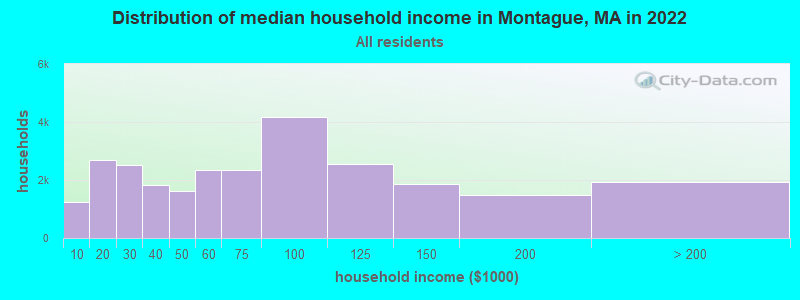
Montague, MA household income distribution

- 1,230Less than $10,000
- 2,697$10,000 to $19,999
- 2,525$20,000 to $29,999
- 1,842$30,000 to $39,999
- 1,614$40,000 to $49,999
- 2,358$50,000 to $59,999
- 2,338$60,000 to $74,999
- 4,163$75,000 to $99,999
- 2,566$100,000 to $124,999
- 1,851$125,000 to $149,999
- 1,488$150,000 to $199,999
- 1,937$200,000 or more
Percentage of workers working in this county: 75.2%
Number of people working at home: 882 (18.4% of all workers)
Travel time to work (commute)
- Less than 5 minutes: 182
- 5 to 9 minutes: 486
- 10 to 14 minutes: 612
- 15 to 19 minutes: 720
- 20 to 24 minutes: 549
- 25 to 29 minutes: 220
- 30 to 34 minutes: 516
- 35 to 39 minutes: 85
- 40 to 44 minutes: 148
- 45 to 59 minutes: 277
- 60 to 89 minutes: 100
- 90 or more minutes: 83
Means of transportation to work:
- Drove a car alone: 3,274 (79.6%)
- Carpooled: 530 (12.9%)
- Bus or trolley bus: 16 (0.4%)
- Bicycle: 21 (0.5%)
- Walked: 107 (2.6%)
- Other means: 30 (0.7%)
- Worked at home: 133 (3.2%)


- Year of entry for the foreign-born population in Montague, Massachusetts
- 1051995 to March 2000
- 531990 to 1994
- 161985 to 1989
- 01980 to 1984
- 281975 to 1979
- 121970 to 1974
- 421965 to 1969
- 93Before 1965

First ancestries reported:
- Polish: 1,789 (18.2%)
- French: 1,422 (14.5%)
- English: 1,239 (12.6%)
- Irish: 1,210 (12.3%)
- Other: 877 (8.9%)
- German: 780 (7.9%)
- French Canadian: 564 (5.7%)
- Italian: 387 (3.9%)
- Scottish: 297 (3.0%)
- United States: 249 (2.5%)
- Swedish: 182 (1.9%)
- Scotch-Irish: 146 (1.5%)
- Russian: 121 (1.2%)
- Lithuanian: 109 (1.1%)
- Welsh: 81 (0.8%)
- Czech: 66 (0.7%)
- Dutch: 66 (0.7%)
- Norwegian: 42 (0.4%)
- Greek: 35 (0.4%)
- Ukrainian: 34 (0.3%)
- Portuguese: 33 (0.3%)
- Swiss: 22 (0.2%)
- West Indian: 21 (0.2%)
- Hungarian: 19 (0.2%)
- Danish: 15 (0.2%)
- Slovak: 11 (0.1%)
Most common places of birth for foreign-born residents (%):
| Montague: | 19.2% (67) |
| Massachusetts: | 1.9% (14,883) |
| Montague: | 12.0% (42) |
| Massachusetts: | 5.2% (40,247) |
| Montague: | 9.2% (32) |
| Massachusetts: | 5.1% (39,255) |
| Montague: | 9.2% (32) |
| Massachusetts: | 0.4% (2,765) |
| Montague: | 7.4% (26) |
| Massachusetts: | 3.3% (25,403) |
| Montague: | 7.4% (26) |
| Massachusetts: | 2.3% (17,449) |
| Montague: | 4.6% (16) |
| Massachusetts: | 3.7% (28,319) |
| Montague: | 4.3% (15) |
| Massachusetts: | 6.0% (46,744) |
| Montague: | 3.7% (13) |
| Massachusetts: | 4.4% (33,862) |
| Montague: | 3.4% (12) |
| Massachusetts: | 0.2% (1,243) |
| Montague: | 3.4% (12) |
| Massachusetts: | 1.0% (7,414) |
| Montague: | 3.2% (11) |
| Massachusetts: | 1.0% (7,867) |
| Montague: | 2.9% (10) |
| Massachusetts: | 2.3% (17,987) |
| Montague: | 2.9% (10) |
| Massachusetts: | 0.5% (3,660) |
| Montague: | 2.0% (7) |
| Massachusetts: | 0.8% (5,895) |
| Montague: | 2.0% (7) |
| Massachusetts: | 1.7% (12,975) |
| Montague: | 2.0% (7) |
| Massachusetts: | 2.4% (18,606) |
Place of birth for U.S.-born residents:
- This state: 6,356
- Other state: 1,704
- Northeast: 1,147
- Midwest: 193
- South: 225
- West: 139
58% of Montague residents lived in the same house 5 years ago.
Out of people who lived in different houses, 68% lived in this county.
Out of people who lived in different counties, 59% lived in Massachusetts.
Education attainment for males 25 years and older:
- No schooling: 13
- Nursery to 4th grade: 6
- 5th and 6th grade: 35
- 7th and 8th grade: 69
- 9th grade: 85
- 10th grade: 115
- 11th grade: 61
- 12th grade, no diploma: 54
- High school graduate (or equivalency): 1,005
- Less than 1 year of college: 115
- Some college more than 1 year, no degree: 386
- Associate degree: 212
- Bachelor's degree: 326
- Master's degree: 142
- Professional school degree: 51
- Doctorate degree: 49

Education attainment for females 25 years and older:
- No schooling: 36
- Nursery to 4th grade: 16
- 5th and 6th grade: 29
- 7th and 8th grade: 70
- 9th grade: 126
- 10th grade: 96
- 11th grade: 75
- 12th grade, no diploma: 48
- High school graduate (or equivalency): 1,178
- Less than 1 year of college: 311
- Some college more than 1 year, no degree: 307
- Associate degree: 290
- Bachelor's degree: 341
- Master's degree: 158
- Professional school degree: 11
- Doctorate degree: 33


Housing units in structures:
- One, detached: 2,035
- One, attached: 85
- Two: 636
- 3 or 4: 376
- 5 to 9: 351
- 10 to 19: 135
- 20 to 49: 104
- 50 or more: 39
- Mobile homes: 83
Median worth of mobile homes: $52,388
Housing units lacking complete kitchen facilities: 0.9%

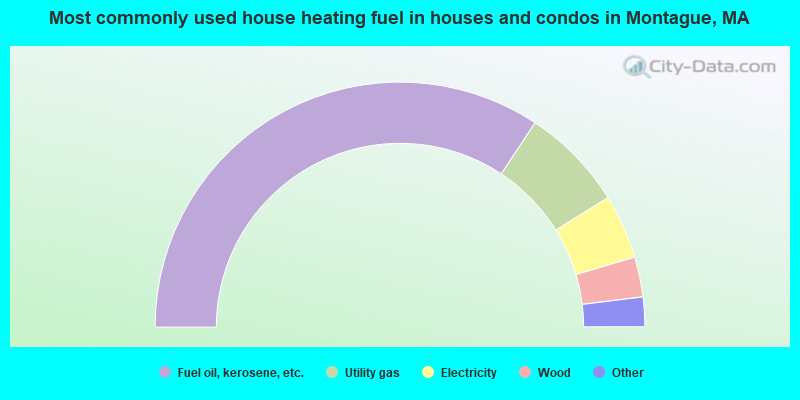
- 68.6%Fuel oil, kerosene, etc.
- 13.7%Utility gas
- 8.5%Electricity
- 5.3%Wood
- 3.6%Bottled, tank, or LP gas
- 0.3%Coal or coke
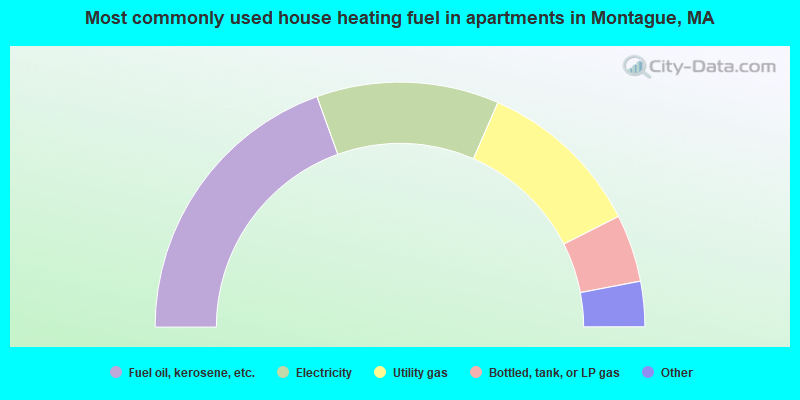
- 39.0%Fuel oil, kerosene, etc.
- 24.1%Electricity
- 22.0%Utility gas
- 8.9%Bottled, tank, or LP gas
- 2.7%Wood
- 1.7%Other fuel
- 1.5%No fuel used
Private vs. public school enrollment:
| Here: | 19.0% |
| Massachusetts: | 10.8% |
| Here: | 11.9% |
| Massachusetts: | 12.2% |
| Here: | 5.2% |
| Massachusetts: | 48.2% |


