Races in Montague, Massachusetts (MA) Detailed Stats
Ancestries, Foreign-born residents, place of birth

Recent posts about races in Montague, Massachusetts on our local forum with over 2,400,000 registered users:
 | Is Massachusetts really just as expensive as NJ? (57 replies) |
| When is the insanity going to end? There has to be a real estate market crash, right? (99 replies) |
| Winter Commute to Northampton (24 replies) |
| Old Farm but New Needs (95 replies) |
| Liberal rural towns (103 replies) |
| Want to relocate but house prices are killer. (22 replies) |
Latest news about races in Montague, MA collected exclusively by city-data.com from local newspapers, TV, and radio stations
4.1% of Montague, MA residents are foreign-born (1.9% born in Europe, 1.2% born in Asia, 0.5% born in Latin America, 0.5% born in North America), which is 337.8% less than the foreign-born rate of 18.0% across the entire state of Massachusetts.
Race distribution in Montague

- 7,95993.8%White alone
- 2172.6%Hispanic
- 1321.6%Two or more races
- 790.9%Asian alone
- 580.7%Black alone
- 310.4%American Indian alone
- 70.08%Other race alone
- 60.07%Native Hawaiian and Other
Pacific Islander alone

2000
2022
-
- 5,198,35981.9%White alone
- 428,7296.8%Hispanic
- 318,3295.0%Black alone
- 236,7863.7%Asian alone
- 110,3381.7%Two or more races
- 43,5860.7%Other race alone
- 11,2640.2%American Indian alone
- 1,7060.03%Native Hawaiian and Other
Pacific Islander alone

-
- 4,676,62767.0%White alone
- 911,03813.0%Hispanic
- 501,4637.2%Asian alone
- 459,7406.6%Black alone
- 341,8894.9%Two or more races
- 84,4031.2%Other race alone
- 5,8380.08%American Indian alone
- 9760.01%Native Hawaiian and Other
Pacific Islander alone

Income and house value in Montague
- Median household income in 2022
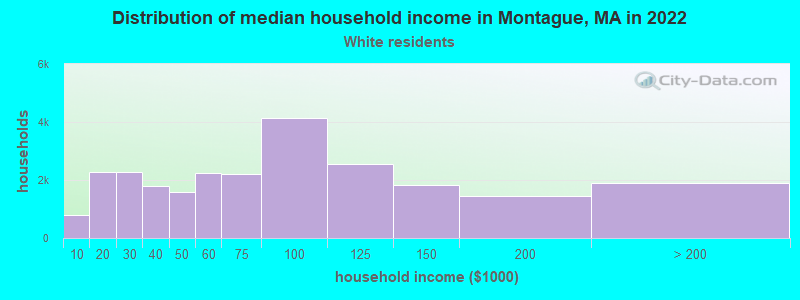
- $60,264White non-Hispanic householders
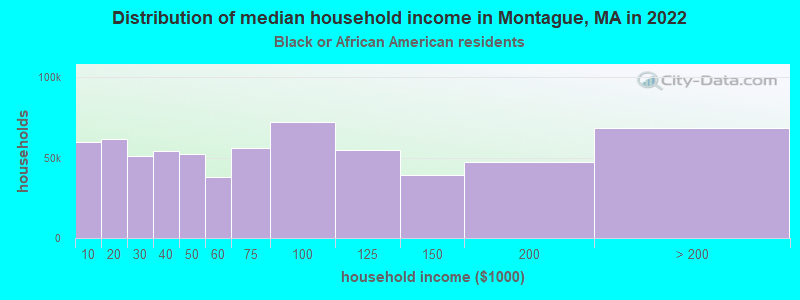
- $7,597Black householders
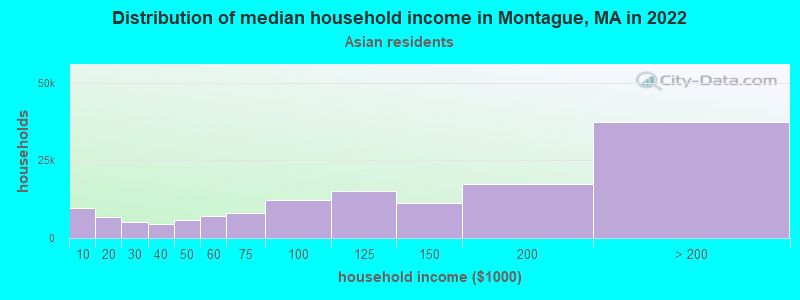
- $11,173Asian householders
- $17,168Some other race householders
- $75,400Two or more races householders
- $52,441Hispanic or Latino race householders
- Median 2022 house value
- $281,570White Non-Hispanic householders
- $341,711Asian householders
- $186,387Two or more races householders
- $186,387Hispanic or Latino householders
Household income for White non-Hispanic householders
Household income for Black householders
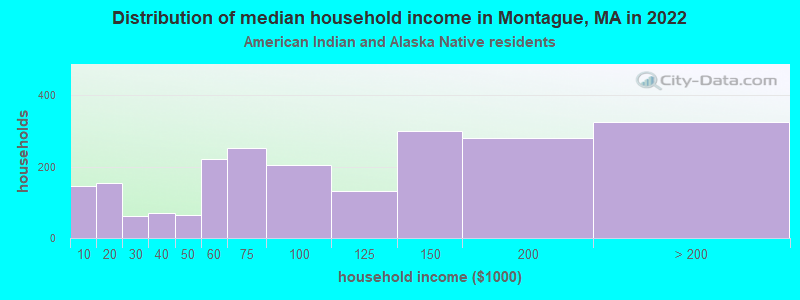
Household income for American Indian and Alaska Native householders
Household income for Asian householders
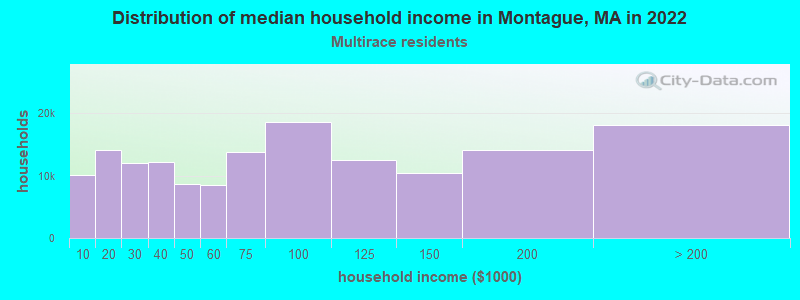
Household income for Two or more races householders
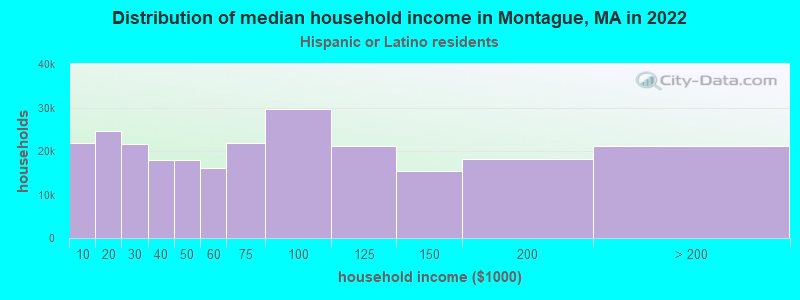
Household income for Hispanic or Latino race householders
Foreign-born residents in Montague
349 residents are foreign born (1.9% Europe, 1.2% Asia, 0.5% Latin America, 0.5% North America).
| This city: | 4.1% |
| Massachusetts: | 12.2% |
Ancestries in Montague

- 1,78918.2%Polish
- 1,42214.5%French
- 1,23912.6%English
- 1,21012.3%Irish
- 8778.9%Other
- 7807.9%German
- 5645.7%French Canadian
- 3873.9%Italian
- 2973.0%Scottish
- 2492.5%United States
- 1821.9%Swedish
- 1461.5%Scotch-Irish
- 1211.2%Russian
- 1091.1%Lithuanian
- 810.8%Welsh
- 660.7%Czech
- 660.7%Dutch
- 420.4%Norwegian
- 350.4%Greek
- 340.3%Ukrainian
- 330.3%Portuguese
- 220.2%Swiss
- 210.2%West Indian
- 190.2%Hungarian
- 150.2%Danish
- 110.1%Slovak

Zip codes: 01351.