Maplewood, MN (Minnesota) Houses and Residents
| Maplewood: | $305,979 |
| Minnesota: | $314,600 |
Mean price in 2022:
Detached houses: $346,389
Here: $346,389 State: $374,552 Townhouses or other attached units: $284,935
Here: $284,935 State: $312,049 In 2-unit structures: $145,856
Here: $145,856 State: $323,045 In 3-to-4-unit structures: $190,356
Here: $190,356 State: $238,971 In 5-or-more-unit structures: $163,523
Here: $163,523 State: $258,516 Mobile homes: $51,165
Here: $51,165 State: $94,605
Total population: 40,199 (Urban population: 34,942, Rural population: 0)
Houses: 16,487 (15,792 occupied: 11,377 owner occupied, 4,397 renter occupied)
| % of renters here: | 28% |
| State: | 28% |
Housing density: 952 houses/condos per square mile
Median price asked for vacant for-sale houses and condos in 2022 in this county: $369,274.
Median contract rent in 2022: $1,261 (lower quartile is $1,012, upper quartile is $1,536)
Median rent asked for vacant for-rent units in 2022: $3,170
Median gross rent in Maplewood, MN in 2022: $1,320
Housing units in Maplewood with a mortgage: 7,526 (780 second mortgage, 0 home equity loan, 425 both second mortgage and home equity loan)
Houses without a mortgage: 123
Median household income for houses/condos with a mortgage: $111,369
Median household income for apartments without a mortgage: $75,821
Median monthly housing costs: $1,424
Compare current foreclosures near Maplewood, MN:
| Photo | Address | Area | Beds / Baths | Price | Details |
|---|---|---|---|---|---|

|
#1
Saint Croix Ave W
Stillwater, MN 55082
|
2,314 sq. feet
|
2 baths 2 beds |
$311,000
|
show details |

|
#2
York Ave S Apt 122
Minneapolis, MN 55435
|
956 sq. feet
|
1 baths 1 beds |
$157,000
|
show details |

|
#3
Granite St
Saint Paul, MN 55117
|
2,136 sq. feet
|
2 baths 4 beds |
$172,000
|
show details |

|
#4
76th Street E. Unit
Inver Grove Heights, MN 55076
|
1,048 sq. feet
|
2 baths 2 beds |
$219,900
|
show details |

|
#5
26th Ave S
Minneapolis, MN 55406
|
1,232 sq. feet
|
1 baths 2 beds |
$309,900
|
show details |

|
#6
Groveland Ave Apt 1708
Minneapolis, MN 55403
|
739 sq. feet
|
1 baths 1 beds |
$98,000
|
show details |

|
#7
Charles Ave
Saint Paul, MN 55103
|
906 sq. feet
|
1 baths 2 beds |
$224,500
|
show details |

|
#8
1st Ave S
Minneapolis, MN 55408
|
1,932 sq. feet
|
2 baths 3 beds |
$354,900
|
show details |

|
#9
W 44th St Apt 7
Minneapolis, MN 55410
|
710 sq. feet
|
1 baths 2 beds |
$154,900
|
show details |

|
#10
Wacouta St Unit Unit Gl-D
Saint Paul, MN 55101
|
- sq. feet
|
1 baths 1 beds |
$179,900
|
show details |
| Photo | Address | Area | Beds / Baths | Price | Details |
|---|---|---|---|---|---|

|
#11
Rice Creek Ter
Saint Paul, MN 55112
|
2,248 sq. feet
|
2 baths 4 beds |
show details | |

|
#12
Brooklyn Blvd
Minneapolis, MN 55429
|
1,232 sq. feet
|
1 baths 4 beds |
show details | |

|
#13
Maple St NE
Minneapolis, MN 55432
|
1,012 sq. feet
|
2 baths 3 beds |
show details | |

|
#14
Whitewater Trl
Minneapolis, MN 55444
|
992 sq. feet
|
1 baths 3 beds |
show details | |

|
#15
13th Ave S Apt 6
Minneapolis, MN 55407
|
1,208 sq. feet
|
2 baths 4 beds |
show details | |

|
#16
Chicago Ave
Minneapolis, MN 55404
|
2,688 sq. feet
|
2 baths 4 beds |
show details | |

|
#17
Wheelock Ln Apt 303
Saint Paul, MN 55117
|
907 sq. feet
|
1 baths 2 beds |
show details | |

|
#18
Canabury Dr Apt 309
Saint Paul, MN 55117
|
1,251 sq. feet
|
2 baths 2 beds |
show details | |

|
#19
Goodhue St NE Unit A
Minneapolis, MN 55449
|
1,760 sq. feet
|
3 baths 3 beds |
show details | |

|
#20
Sanburnol Dr NE
Minneapolis, MN 55432
|
1,440 sq. feet
|
3 baths 6 beds |
show details |
| Photo | Address | Area | Beds / Baths | Price | Details |
|---|---|---|---|---|---|

|
#21
Sanburnol Dr NE
Minneapolis, MN 55432
|
1,440 sq. feet
|
3 baths 6 beds |
show details | |

|
#22
Silver Bell Rd Apt 203
Saint Paul, MN 55122
|
1,214 sq. feet
|
2 baths 3 beds |
show details | |

|
#23
Humboldt Ave N
Minneapolis, MN 55430
|
1,012 sq. feet
|
1 baths 2 beds |
show details | |

|
#24
Dunlap Ave
Circle Pines, MN 55014
|
988 sq. feet
|
1 baths 2 beds |
show details | |

|
#25
Canabury Ct
Saint Paul, MN 55117
|
2,004 sq. feet
|
3 baths 3 beds |
show details | |

|
#26
Morgan Ln
Circle Pines, MN 55014
|
1,738 sq. feet
|
3 baths 3 beds |
show details | |

|
#27
Silver Bell Rd Apt 109
Saint Paul, MN 55122
|
756 sq. feet
|
1 baths 1 beds |
show details | |

|
#28
10th Ave N
South Saint Paul, MN 55075
|
1,484 sq. feet
|
2 baths 3 beds |
show details | |

|
#29
94th Ave NE
Minneapolis, MN 55434
|
1,044 sq. feet
|
2 baths 3 beds |
show details | |

|
#30
Ohio St
Saint Paul, MN 55118
|
1,715 sq. feet
|
2 baths 3 beds |
show details |
| Photo | Address | Area | Beds / Baths | Price | Details |
|---|---|---|---|---|---|

|
#31
Park Ave
Minneapolis, MN 55407
|
1,185 sq. feet
|
1 baths 3 beds |
show details | |

|
#32
Perry Ave N
Minneapolis, MN 55422
|
1,668 sq. feet
|
2 baths 3 beds |
show details | |

|
#33
10th Ave S
Minneapolis, MN 55423
|
928 sq. feet
|
1 baths 3 beds |
show details | |

|
#34
Marshall Ave
Saint Paul, MN 55104
|
1,102 sq. feet
|
1 baths 3 beds |
show details | |

|
#35
Christensen Ave
Saint Paul, MN 55118
|
2,574 sq. feet
|
2 baths 5 beds |
show details | |

|
#36
Ohio St
Saint Paul, MN 55118
|
1,002 sq. feet
|
2 baths 3 beds |
show details | |

|
#37
Hallmark Ave S
Cottage Grove, MN 55016
|
1,328 sq. feet
|
1 baths 4 beds |
show details | |

|
#38
Sherrie Ln
Saint Paul, MN 55125
|
1,002 sq. feet
|
1 baths 3 beds |
show details | |

|
#39
White Bear Ave N
Saint Paul, MN 55110
|
1,618 sq. feet
|
3 baths 3 beds |
show details | |

|
#40
Bloomington Ave
Minneapolis, MN 55407
|
1,820 sq. feet
|
2 baths 4 beds |
show details |
| Photo | Address | Area | Beds / Baths | Price | Details |
|---|---|---|---|---|---|

|
#41
1st Ave S
Minneapolis, MN 55420
|
1,200 sq. feet
|
1 baths 3 beds |
show details | |

|
#42
Frattalone Ln
Saint Paul, MN 55117
|
1,825 sq. feet
|
3 baths 2 beds |
show details | |

|
#43
Jackson St
Saint Paul, MN 55117
|
1,362 sq. feet
|
2 baths 3 beds |
show details | |

|
#44
Foothill Rd S
Cottage Grove, MN 55016
|
1,585 sq. feet
|
2 baths 4 beds |
show details | |

|
#45
Hemingway Ave S
Cottage Grove, MN 55016
|
1,144 sq. feet
|
2 baths 5 beds |
show details | |

|
#46
Hayward Rd N
Saint Paul, MN 55128
|
1,522 sq. feet
|
1 baths 2 beds |
show details | |

|
#47
44th Ave S
Minneapolis, MN 55417
|
1,046 sq. feet
|
1 baths 3 beds |
show details | |

|
#48
E Danube Rd
Minneapolis, MN 55432
|
2,063 sq. feet
|
4 baths 4 beds |
show details | |

|
#49
20th Ave S
South Saint Paul, MN 55075
|
1,280 sq. feet
|
2 baths 2 beds |
show details | |

|
Check over 1 million property listings on Foreclosure.com!
|
browse all offers | |||

Latest news about housing in Maplewood, MN collected exclusively by city-data.com from local newspapers, TV, and radio stations


Median year apartment built: 1982
Household type by relationship:
Households: 40,588- Male householders: 7,159 (1,529 living alone), Female householders: 7,962 (3,036 living alone)
6,566 spouses (6,523 opposite-sex spouses), 1,548 unmarried partners, (1,537 opposite-sex unmarried partners), 11,653 children (10,950 natural, 315 adopted, 387 stepchildren), 968 grandchildren, 661 brothers or sisters, 945 parents, 0 foster children, 591 other relatives, 1,572 non-relatives
- In group quarters: 957
Size of family households: 4,146 2-persons, 1,917 3-persons, 1,410 4-persons, 1,009 5-persons, 641 6-persons, 528 7-or-more-persons.
Size of nonfamily households: 4,688 1-person, 1,237 2-persons, 140 3-persons, 11 4-persons, 73 5-persons.
4,961 married couples with children.
2,959 single-parent households (915 men, 2,044 women).
73.9% of residents of Maplewood speak English at home.
7.7% of residents speak Spanish at home (56% speak English very well, 25% speak English well, 19% speak English not well).
2.4% of residents speak other Indo-European language at home (41% speak English very well, 47% speak English well, 9% speak English not well, 2% don't speak English at all).
13.5% of residents speak Asian or Pacific Island language at home (46% speak English very well, 31% speak English well, 18% speak English not well, 6% don't speak English at all).
3.2% of residents speak other language at home (75% speak English very well, 22% speak English well, 2% speak English not well, 1% don't speak English at all).
Foreign born population: 6,582 (16.2%)
(63.8% of them are naturalized citizens)
| Here: | 7.0 |
| State: | 7.1 |
| Here: | 4.0 |
| State: | 3.8 |

- Bedrooms in owner-occupied houses and condos in Maplewood, Minnesota
- 36no bedroom
- 1971 bedroom
- 2,3852 bedrooms
- 5,1583 bedrooms
- 2,7334 bedrooms
- 8685+ bedrooms

- Bedrooms in renter-occupied apartments in Maplewood, Minnesota
- 291no bedroom
- 1,5241 bedroom
- 1,5562 bedrooms
- 6793 bedrooms
- 3044 bedrooms
- 435+ bedrooms

- Cars and other vehicles available in Maplewood in owner-occupied houses/condos
- 513no vehicle
- 2,7701 vehicle
- 5,3702 vehicles
- 1,6383 vehicles
- 8184 vehicles
- 2685+ vehicles

- Cars and other vehicles available in Maplewood in renter-occupied apartments
- 997no vehicle
- 1,7661 vehicle
- 1,2332 vehicles
- 2563 vehicles
- 604 vehicles
- 855+ vehicles

- Rooms in owner-occupied houses in Maplewood, Minnesota
- 291 room
- 02 rooms
- 1723 rooms
- 9224 rooms
- 1,7405 rooms
- 1,6726 rooms
- 2,3887 rooms
- 2,0028 rooms
- 2,4529+ rooms

- Rooms in renter-occupied apartments in Maplewood, Minnesota
- 2911 room
- 3742 rooms
- 1,1193 rooms
- 9094 rooms
- 8645 rooms
- 3556 rooms
- 2017 rooms
- 1158 rooms
- 1699+ rooms


Maplewood, MN household income distribution

- 521Less than $10,000
- 838$10,000 to $19,999
- 954$20,000 to $29,999
- 1,485$30,000 to $39,999
- 920$40,000 to $49,999
- 886$50,000 to $59,999
- 1,643$60,000 to $74,999
- 1,986$75,000 to $99,999
- 1,802$100,000 to $124,999
- 1,652$125,000 to $149,999
- 1,657$150,000 to $199,999
- 1,439$200,000 or more

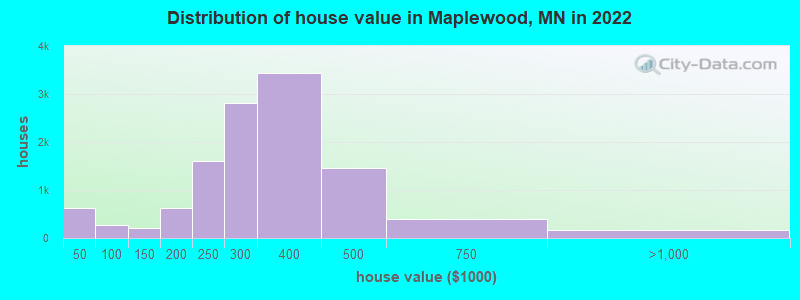
Home value of owner - occupied houses in 2022 in Maplewood, MN
-
- 75Less than $10,000
- 176$10,000 to $14,999
- 12$15,000 to $19,999
- 66$20,000 to $24,999
- 21$25,000 to $29,999
- 116$30,000 to $34,999
- 54$35,000 to $39,999
- 93$40,000 to $49,999
- 88$50,000 to $59,999
- 20$60,000 to $69,999
- 5$70,000 to $79,999
- 36$80,000 to $89,999
- 25$90,000 to $99,999
- 61$100,000 to $124,999
- 141$125,000 to $149,999
- 293$150,000 to $174,999
- 331$175,000 to $199,999
- 1,599$200,000 to $249,999
- 2,813$250,000 to $299,999
- 3,432$300,000 to $399,999
- 1,458$400,000 to $499,999
- 402$500,000 to $749,999
- 103$750,000 to $999,999
- 55$2,000,000 or more
Rent paid by renters in 2022 in Maplewood, MN
-
- 105Less than $100
- 11$100 to $149
- 149$200 to $249
- 66$250 to $299
- 59$300 to $349
- 8$350 to $399
- 55$400 to $449
- 31$450 to $499
- 18$550 to $599
- 6$650 to $699
- 65$700 to $749
- 13$750 to $799
- 115$800 to $899
- 242$900 to $999
- 1,093$1,000 to $1,249
- 1,092$1,250 to $1,499
- 841$1,500 to $1,999
- 120$2,000 to $2,499
- 46$2,500 to $2,999
- 16$3,000 to $3,499
- 113$3,500 or more
- 151No cash rent


Percentage of workers working in this county: 60.1%
Number of people working at home: 2,915 (14.3% of all workers)
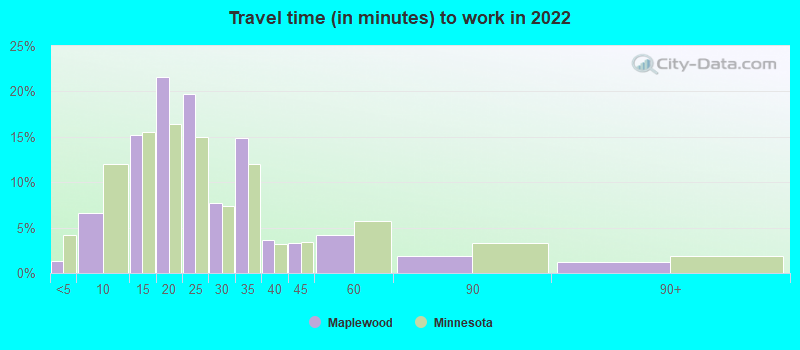
Travel time to work (commute)
- Less than 5 minutes: 351
- 5 to 9 minutes: 1,117
- 10 to 14 minutes: 3,104
- 15 to 19 minutes: 3,417
- 20 to 24 minutes: 3,484
- 25 to 29 minutes: 1,621
- 30 to 34 minutes: 2,038
- 35 to 39 minutes: 750
- 40 to 44 minutes: 321
- 45 to 59 minutes: 597
- 60 to 89 minutes: 209
- 90 or more minutes: 116
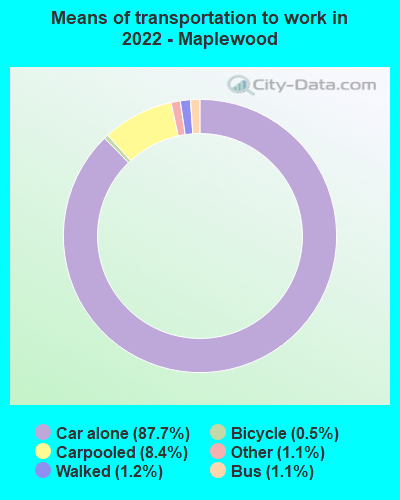
Means of transportation to work:
- Drove a car alone: 19,649 (76.9%)
- Carpooled: 1,895 (7.4%)
- Bus: 211 (0.8%)
- Subway or elevated rail: 2 (0.0%)
- Taxi: 407 (1.6%)
- Bicycle: 74 (0.3%)
- Walked: 269 (1.1%)
- Worked at home: 2,915 (11.4%)

- Unemployment by race in 2022
- Unemployment rate for White non-Hispanic residents
- 3.4%Males
- 3.0%Females
- Unemployment rate for Black residents
- 4.4%Males
- 7.1%Females
- Unemployment rate for American Indian and Alaska Native residents
- 3.0%Females
- Unemployment rate for Asian residents
- 0.2%Males
- 0.9%Females
- Unemployment rate for two or more race residents
- 1.1%Males
- Unemployment rate for Hispanic or Latino residents
- 1.2%Females

- Year of entry for the foreign-born population in Maplewood, Minnesota
- 2,1022010 or later
- 1,3852000 to 2009
- 1,3821990 to 1999
- 5501980 to 1989
- 2311970 to 1979
- 230Before 1970

First ancestries reported:
- German: 2,447 (12.0%)
- American: 1,197 (5.9%)
- Norwegian: 786 (3.9%)
- Polish: 538 (2.6%)
- Irish: 489 (2.4%)
- Swedish: 471 (2.3%)
- Somali: 445 (2.2%)
- Italian: 409 (2.0%)
- Ethiopian: 402 (2.0%)
- English: 340 (1.7%)
- Sudanese: 328 (1.6%)
- Scandinavian: 305 (1.5%)
- European: 297 (1.5%)
- French: 199 (1.0%)
- Dutch: 136 (0.7%)
- Swiss: 107 (0.5%)
- Nigerian: 100 (0.5%)
- Finnish: 95 (0.5%)
- African: 95 (0.5%)
- Hungarian: 70 (0.3%)
- Trinidadian and Tobagonian: 70 (0.3%)
- Danish: 63 (0.3%)
- Czech: 48 (0.2%)
- Northern European: 48 (0.2%)
- Iranian: 43 (0.2%)
- French Canadian: 42 (0.2%)
- Greek: 41 (0.2%)
- Yugoslavian: 31 (0.2%)
- British: 29 (0.1%)
- Romanian: 28 (0.1%)
- Lebanese: 24 (0.1%)
- Luxembourger: 23 (0.1%)
- Brazilian: 18 (0.09%)
- Russian: 17 (0.08%)
- Eastern European: 17 (0.08%)
- Scottish: 15 (0.07%)
- Australian: 14 (0.07%)
- Latvian: 14 (0.07%)
- Slovene: 13 (0.06%)
- Serbian: 12 (0.06%)
- Bulgarian: 11 (0.05%)
- Scotch-Irish: 8 (0.04%)
- Lithuanian: 8 (0.04%)
Most common places of birth for foreign-born residents (%):
| Maplewood: | 22.3% (1,547) |
| Minnesota: | 5.1% (24,591) |
| Maplewood: | 19.5% (1,353) |
| Minnesota: | 12.1% (58,312) |
| Maplewood: | 10.6% (736) |
| Minnesota: | 4.0% (19,333) |
| Maplewood: | 4.7% (329) |
| Minnesota: | 1.8% (8,637) |
| Maplewood: | 3.9% (274) |
| Minnesota: | 2.0% (9,850) |
| Maplewood: | 2.9% (203) |
| Minnesota: | 8.0% (38,461) |
| Maplewood: | 2.8% (195) |
| Minnesota: | 2.4% (11,675) |
| Maplewood: | 2.7% (186) |
| Minnesota: | 5.1% (24,630) |
| Maplewood: | 2.5% (177) |
| Minnesota: | 0.6% (3,038) |
| Maplewood: | 2.3% (160) |
| Minnesota: | 3.8% (18,442) |
| Maplewood: | 2.2% (154) |
| Minnesota: | 1.7% (8,263) |
| Maplewood: | 1.9% (133) |
| Minnesota: | 1.8% (8,438) |
| Maplewood: | 1.7% (121) |
| Minnesota: | 1.4% (6,670) |
| Maplewood: | 1.7% (117) |
| Minnesota: | 3.6% (17,119) |
| Maplewood: | 1.7% (117) |
| Minnesota: | 0.6% (2,993) |
Place of birth for U.S.-born residents:
- This state: 26,059
- Other state: 7,207
- Northeast: 529
- Midwest: 4,389
- South: 1,172
- West: 1,047
87.3% of Maplewood residents lived in the same house 1 years ago.
Out of people who lived in different houses, 31.6% lived in this county.
Out of people who lived in different counties, 57.7% lived in Minnesota.
| Maplewood: | 87.3% |
| State average: | 87.4% |
Education attainment for males 25 years and older:
- No schooling: 458
- Nursery to 4th grade: 43
- 5th and 6th grade: 32
- 7th and 8th grade: 34
- 9th grade: 39
- 10th grade: 59
- 11th grade: 105
- 12th grade, no diploma: 320
- High school graduate (or equivalency): 3,104
- Less than 1 year of college: 899
- Some college more than 1 year, no degree: 1,945
- Associate degree: 1,468
- Bachelor's degree: 3,792
- Master's degree: 923
- Professional school degree: 237
- Doctorate degree: 294

Education attainment for females 25 years and older:
- No schooling: 465
- Nursery to 4th grade: 79
- 5th and 6th grade: 71
- 7th and 8th grade: 134
- 9th grade: 79
- 10th grade: 123
- 11th grade: 330
- 12th grade, no diploma: 226
- High school graduate (or equivalency): 3,875
- Less than 1 year of college: 983
- Some college more than 1 year, no degree: 1,559
- Associate degree: 1,455
- Bachelor's degree: 3,744
- Master's degree: 1,178
- Professional school degree: 178
- Doctorate degree: 194


Housing units in structures:
- One, detached: 9,798
- One, attached: 1,705
- Two: 233
- 3 or 4: 200
- 5 to 9: 220
- 10 to 19: 498
- 20 to 49: 908
- 50 or more: 2,350
- Mobile homes: 571
Median worth of mobile homes: $43,043
Housing units lacking complete kitchen facilities in 2022: 1.9%
House/condo owner moved in on average 10 years ago
Renter moved in on average 2 years ago

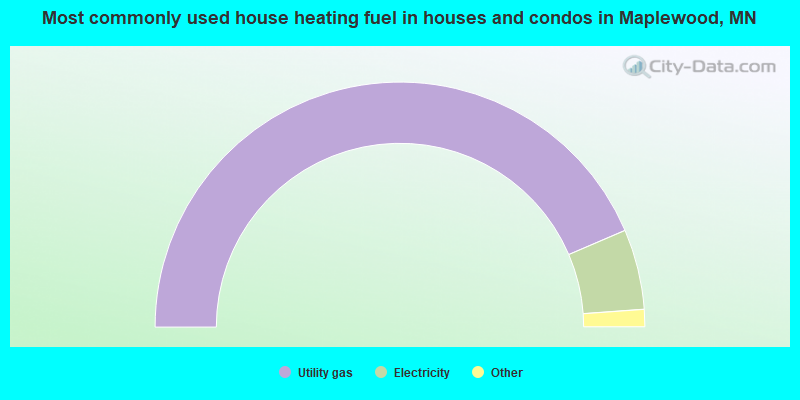
- 87.1%Utility gas
- 10.6%Electricity
- 0.7%Bottled, tank, or LP gas
- 0.6%Fuel oil, kerosene, etc.
- 0.6%No fuel used
- 0.4%Other fuel
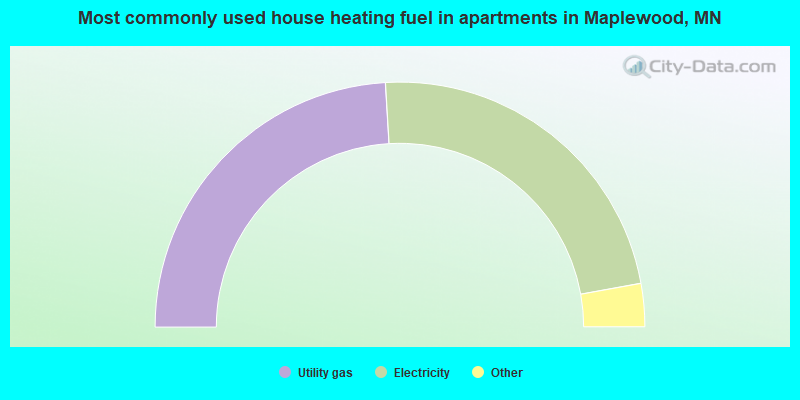
- 48.1%Utility gas
- 46.2%Electricity
- 2.3%Other fuel
- 2.2%No fuel used
- 1.2%Bottled, tank, or LP gas
Private vs. public school enrollment:
| Here: | 16.7% |
| Minnesota: | 12.9% |
| Here: | 10.7% |
| Minnesota: | 8.6% |
| Here: | 23.5% |
| Minnesota: | 26.2% |


