Races in Maplewood, Minnesota (MN) Detailed Stats
Data:
Races - White alone (%)
Races - White alone (% change since 2000)
Races - Black alone (%)
Races - Black alone (% change since 2000)
Races - American Indian alone (%)
Races - American Indian alone (% change since 2000)
Races - Asian alone (%)
Races - Asian alone (% change since 2000)
Races - Hispanic (%)
Races - Hispanic (% change since 2000)
Races - Native Hawaiian and Other Pacific Islander alone (%)
Races - Native Hawaiian and Other Pacific Islander alone (% change since 2000)
Races - Two or more races(%)
Races - Two or more races(% change since 2000)
Races - Other race alone (%)
Races - Other race alone (% change since 2000)
Racial diversity
Place of birth - Born in state of residence (%)
Place of birth - Born in state of residence (%) - White
Place of birth - Born in state of residence (%) - Black or African American
Place of birth - Born in state of residence (%) - Asian
Place of birth - Born in state of residence (%) - Hispanic or Latino
Place of birth - Born in state of residence (%) - American Indian and Alaska Native
Place of birth - Born in state of residence (%) - Multirace
Place of birth - Born in state of residence (%) - Other Race
Place of birth - Born in other state (%)
Place of birth - Born in other state (%) - White
Place of birth - Born in other state (%) - Black or African American
Place of birth - Born in other state (%) - Asian
Place of birth - Born in other state (%) - Hispanic or Latino
Place of birth - Born in other state (%) - American Indian and Alaska Native
Place of birth - Born in other state (%) - Multirace
Place of birth - Born in other state (%) - Other Race
Place of birth - Native, outside of US (%)
Place of birth - Native, outside of US (%) - White
Place of birth - Native, outside of US (%) - Black or African American
Place of birth - Native, outside of US (%) - Asian
Place of birth - Native, outside of US (%) - Hispanic or Latino
Place of birth - Native, outside of US (%) - American Indian and Alaska Native
Place of birth - Native, outside of US (%) - Multirace
Place of birth - Native, outside of US (%) - Other Race
Place of birth - Foreign born (%)
Place of birth - Foreign born (%) - White
Place of birth - Foreign born (%) - Black or African American
Place of birth - Foreign born (%) - Asian
Place of birth - Foreign born (%) - Hispanic or Latino
Place of birth - Foreign born (%) - American Indian and Alaska Native
Place of birth - Foreign born (%) - Multirace
Place of birth - Foreign born (%) - Other Race
Residents speaking English at home (%)
Residents speaking English at home - Born in the United States (%)
Residents speaking English at home - Native, born elsewhere (%)
Residents speaking English at home - Foreign born (%)
Residents speaking Spanish at home (%)
Residents speaking Spanish at home - Born in the United States (%)
Residents speaking Spanish at home - Native, born elsewhere (%)
Residents speaking Spanish at home - Foreign born (%)
Residents speaking other language at home (%)
Residents speaking other language at home - Born in the United States (%)
Residents speaking other language at home - Native, born elsewhere (%)
Residents speaking other language at home - Foreign born (%)
Marital status - Never married (%)
Marital status - Now married (%)
Marital status - Separated (%)
Marital status - Widowed (%)
Marital status - Divorced (%)
Ancestries Reported - Arab (%)
Ancestries Reported - Czech (%)
Ancestries Reported - Danish (%)
Ancestries Reported - Dutch (%)
Ancestries Reported - English (%)
Ancestries Reported - French (%)
Ancestries Reported - French Canadian (%)
Ancestries Reported - German (%)
Ancestries Reported - Greek (%)
Ancestries Reported - Hungarian (%)
Ancestries Reported - Irish (%)
Ancestries Reported - Italian (%)
Ancestries Reported - Lithuanian (%)
Ancestries Reported - Norwegian (%)
Ancestries Reported - Polish (%)
Ancestries Reported - Portuguese (%)
Ancestries Reported - Russian (%)
Ancestries Reported - Scotch-Irish (%)
Ancestries Reported - Scottish (%)
Ancestries Reported - Slovak (%)
Ancestries Reported - Subsaharan African (%)
Ancestries Reported - Swedish (%)
Ancestries Reported - Swiss (%)
Ancestries Reported - Ukrainian (%)
Ancestries Reported - United States (%)
Ancestries Reported - Welsh (%)
Ancestries Reported - West Indian (%)
Ancestries Reported - Other (%)
Geographical mobility - Same house 1 year ago (%)
Geographical mobility - Same house 1 year ago (%) - White
Geographical mobility - Same house 1 year ago (%) - Black or African American
Geographical mobility - Same house 1 year ago (%) - Asian
Geographical mobility - Same house 1 year ago (%) - Hispanic or Latino
Geographical mobility - Same house 1 year ago (%) - American Indian and Alaska Native
Geographical mobility - Same house 1 year ago (%) - Multirace
Geographical mobility - Same house 1 year ago (%) - Other Race
Geographical mobility - Moved within same county (%)
Geographical mobility - Moved within same county (%) - White
Geographical mobility - Moved within same county (%) - Black or African American
Geographical mobility - Moved within same county (%) - Asian
Geographical mobility - Moved within same county (%) - Hispanic or Latino
Geographical mobility - Moved within same county (%) - American Indian and Alaska Native
Geographical mobility - Moved within same county (%) - Multirace
Geographical mobility - Moved within same county (%) - Other Race
Geographical mobility - Moved from different county within same state (%)
Geographical mobility - Moved from different county within same state (%) - White
Geographical mobility - Moved from different county within same state (%) - Black or African American
Geographical mobility - Moved from different county within same state (%) - Asian
Geographical mobility - Moved from different county within same state (%) - Hispanic or Latino
Geographical mobility - Moved from different county within same state (%) - American Indian and Alaska Native
Geographical mobility - Moved from different county within same state (%) - Multirace
Geographical mobility - Moved from different county within same state (%) - Other Race
Geographical mobility - Moved from different state (%)
Geographical mobility - Moved from different state (%) - White
Geographical mobility - Moved from different state (%) - Black or African American
Geographical mobility - Moved from different state (%) - Asian
Geographical mobility - Moved from different state (%) - Hispanic or Latino
Geographical mobility - Moved from different state (%) - American Indian and Alaska Native
Geographical mobility - Moved from different state (%) - Multirace
Geographical mobility - Moved from different state (%) - Other Race
Geographical mobility - Moved from abroad (%)
Geographical mobility - Moved from abroad (%) - White
Geographical mobility - Moved from abroad (%) - Black or African American
Geographical mobility - Moved from abroad (%) - Asian
Geographical mobility - Moved from abroad (%) - Hispanic or Latino
Geographical mobility - Moved from abroad (%) - American Indian and Alaska Native
Geographical mobility - Moved from abroad (%) - Multirace
Geographical mobility - Moved from abroad (%) - Other Race
Place of birth for the foreign-born population - Ireland (%)
Place of birth for the foreign-born population - Denmark (%)
Place of birth for the foreign-born population - Norway (%)
Place of birth for the foreign-born population - Sweden (%)
Place of birth for the foreign-born population - United Kingdom (%)
Place of birth for the foreign-born population - England (%)
Place of birth for the foreign-born population - Scotland (%)
Place of birth for the foreign-born population - Other Northern Europe (%)
Place of birth for the foreign-born population - Austria (%)
Place of birth for the foreign-born population - Belgium (%)
Place of birth for the foreign-born population - France (%)
Place of birth for the foreign-born population - Germany (%)
Place of birth for the foreign-born population - Netherlands (%)
Place of birth for the foreign-born population - Switzerland (%)
Place of birth for the foreign-born population - Other Western Europe (%)
Place of birth for the foreign-born population - Greece (%)
Place of birth for the foreign-born population - Italy (%)
Place of birth for the foreign-born population - Portugal (%)
Place of birth for the foreign-born population - Spain (%)
Place of birth for the foreign-born population - Other Southern Europe (%)
Place of birth for the foreign-born population - Albania (%)
Place of birth for the foreign-born population - Belarus (%)
Place of birth for the foreign-born population - Bosnia and Herzegovina (%)
Place of birth for the foreign-born population - Bulgaria (%)
Place of birth for the foreign-born population - Croatia (%)
Place of birth for the foreign-born population - Czechoslovakia (%)
Place of birth for the foreign-born population - Hungary (%)
Place of birth for the foreign-born population - Latvia (%)
Place of birth for the foreign-born population - Lithuania (%)
Place of birth for the foreign-born population - North Macedonia (Macedonia) (%)
Place of birth for the foreign-born population - Moldova (%)
Place of birth for the foreign-born population - Poland (%)
Place of birth for the foreign-born population - Romania (%)
Place of birth for the foreign-born population - Russia (%)
Place of birth for the foreign-born population - Serbia (%)
Place of birth for the foreign-born population - Ukraine (%)
Place of birth for the foreign-born population - Other Eastern Europe (%)
Place of birth for the foreign-born population - China (%)
Place of birth for the foreign-born population - Hong Kong (%)
Place of birth for the foreign-born population - Taiwan (%)
Place of birth for the foreign-born population - Japan (%)
Place of birth for the foreign-born population - Korea (%)
Place of birth for the foreign-born population - Other Eastern Asia (%)
Place of birth for the foreign-born population - Afghanistan (%)
Place of birth for the foreign-born population - Bangladesh (%)
Place of birth for the foreign-born population - India (%)
Place of birth for the foreign-born population - Iran (%)
Place of birth for the foreign-born population - Kazakhstan (%)
Place of birth for the foreign-born population - Nepal (%)
Place of birth for the foreign-born population - Pakistan (%)
Place of birth for the foreign-born population - Sri Lanka (%)
Place of birth for the foreign-born population - Uzbekistan (%)
Place of birth for the foreign-born population - Other South Central Asia (%)
Place of birth for the foreign-born population - Burma (%)
Place of birth for the foreign-born population - Cambodia (%)
Place of birth for the foreign-born population - Indonesia (%)
Place of birth for the foreign-born population - Laos (%)
Place of birth for the foreign-born population - Malaysia (%)
Place of birth for the foreign-born population - Philippines (%)
Place of birth for the foreign-born population - Singapore (%)
Place of birth for the foreign-born population - Thailand (%)
Place of birth for the foreign-born population - Vietnam (%)
Place of birth for the foreign-born population - Other South Eastern Asia (%)
Place of birth for the foreign-born population - Armenia (%)
Place of birth for the foreign-born population - Iraq (%)
Place of birth for the foreign-born population - Israel (%)
Place of birth for the foreign-born population - Jordan (%)
Place of birth for the foreign-born population - Kuwait (%)
Place of birth for the foreign-born population - Lebanon (%)
Place of birth for the foreign-born population - Saudi Arabia (%)
Place of birth for the foreign-born population - Syria (%)
Place of birth for the foreign-born population - Turkey (%)
Place of birth for the foreign-born population - Yemen (%)
Place of birth for the foreign-born population - Other Western Asia (%)
Place of birth for the foreign-born population - Eritrea (%)
Place of birth for the foreign-born population - Ethiopia (%)
Place of birth for the foreign-born population - Kenya (%)
Place of birth for the foreign-born population - Somalia (%)
Place of birth for the foreign-born population - Uganda (%)
Place of birth for the foreign-born population - Zimbabwe (%)
Place of birth for the foreign-born population - Other Eastern Africa (%)
Place of birth for the foreign-born population - Cameroon (%)
Place of birth for the foreign-born population - Congo (%)
Place of birth for the foreign-born population - Democratic Republic of Congo (Zaire) (%)
Place of birth for the foreign-born population - Other Middle Africa (%)
Place of birth for the foreign-born population - Egypt (%)
Place of birth for the foreign-born population - Morocco (%)
Place of birth for the foreign-born population - Sudan (%)
Place of birth for the foreign-born population - Other Northern Africa (%)
Place of birth for the foreign-born population - South Africa (%)
Place of birth for the foreign-born population - Other Southern Africa (%)
Place of birth for the foreign-born population - Cabo Verde (%)
Place of birth for the foreign-born population - Ghana (%)
Place of birth for the foreign-born population - Liberia (%)
Place of birth for the foreign-born population - Nigeria (%)
Place of birth for the foreign-born population - Senegal (%)
Place of birth for the foreign-born population - Sierra Leone (%)
Place of birth for the foreign-born population - Other Western Africa (%)
Place of birth for the foreign-born population - Australia (%)
Place of birth for the foreign-born population - New Zealand (%)
Place of birth for the foreign-born population - Fiji (%)
Place of birth for the foreign-born population - Micronesia (%)
Place of birth for the foreign-born population - Bahamas (%)
Place of birth for the foreign-born population - Barbados (%)
Place of birth for the foreign-born population - Cuba (%)
Place of birth for the foreign-born population - Dominica (%)
Place of birth for the foreign-born population - Dominican Republic (%)
Place of birth for the foreign-born population - Grenada (%)
Place of birth for the foreign-born population - Haiti (%)
Place of birth for the foreign-born population - Jamaica (%)
Place of birth for the foreign-born population - St. Vincent and the Grenadines (%)
Place of birth for the foreign-born population - Trinidad and Tobago (%)
Place of birth for the foreign-born population - West Indies (%)
Place of birth for the foreign-born population - Other Caribbean (%)
Place of birth for the foreign-born population - Belize (%)
Place of birth for the foreign-born population - Costa Rica (%)
Place of birth for the foreign-born population - El Salvador (%)
Place of birth for the foreign-born population - Guatemala (%)
Place of birth for the foreign-born population - Honduras (%)
Place of birth for the foreign-born population - Mexico (%)
Place of birth for the foreign-born population - Nicaragua (%)
Place of birth for the foreign-born population - Panama (%)
Place of birth for the foreign-born population - Other Central America (%)
Place of birth for the foreign-born population - Argentina (%)
Place of birth for the foreign-born population - Bolivia (%)
Place of birth for the foreign-born population - Brazil (%)
Place of birth for the foreign-born population - Chile (%)
Place of birth for the foreign-born population - Colombia (%)
Place of birth for the foreign-born population - Ecuador (%)
Place of birth for the foreign-born population - Guyana (%)
Place of birth for the foreign-born population - Peru (%)
Place of birth for the foreign-born population - Uruguay (%)
Place of birth for the foreign-born population - Venezuela (%)
Place of birth for the foreign-born population - Other South America (%)
Place of birth for the foreign-born population - Canada (%)
Place of birth for the foreign-born population - Other Northern America (%)
Place of birth for the foreign-born population - Other (%)
Latest news about races in Maplewood, MN collected exclusively by city-data.com from local newspapers, TV, and radio stations
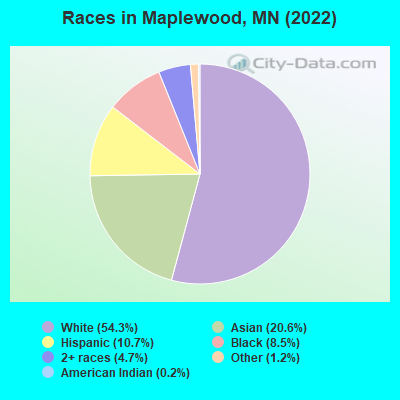
According to 2022 data, the most numerous races in Maplewood, MN are White alone (22,050 residents), Black alone (3,465 residents), and Hispanic (4,361 residents). 73.6% of Maplewood residents speak English at home. 17.1% of Maplewood, MN residents are foreign-born (9.0% born in Asia, 4.1% born in Latin America, 2.0% born in Africa), which is 53.2% greater than the foreign-born rate of 8.0% across the entire state of Minnesota.
Race distribution in Maplewood
2000 2022
4,337,143 88.2% White alone 168,813 3.4% Black alone 143,382 2.9% Hispanic 141,083 2.9% Asian alone 70,304 1.4% Two or more races 52,009 1.1% American Indian alone 5,031 0.1% Other race alone 1,714 0.03% Native Hawaiian and Other
4,356,347 76.2% White alone 395,179 6.9% Black alone 333,830 5.8% Hispanic 294,800 5.2% Asian alone 259,649 4.5% Two or more races 42,125 0.7% American Indian alone 32,976 0.6% Other race alone 2,278 0.04% Native Hawaiian and Other
Income and house value in Maplewood Median household income in 2022 $82,200 White non-Hispanic householders$64,612 Black householders$127,483 Asian householders$77,960 Some other race householders$76,038 Two or more races householders$55,531 Hispanic or Latino race householdersMedian 2022 house value $318,860 White Non-Hispanic householders$311,082 Black or African American householders$318,130 American Indian or Alaska Native householders $401,248 Asian householders$357,016 Some other race householders$319,103 Two or more races householders$326,151 Hispanic or Latino householders
Median age by race in Maplewood
52.4 Median age for White residents48.2 55.7 33.3 Median age for Black or African American residents33.6 32.4 18.3 Median age for American Indian / Alaska Native residents23.2 31.9 28.2 Median age for Asian residents27.0 30.3 -744,336,568.8 Median age for Native Hawaiian / Pacific Islander residents-856,799,036.4 -534,959,349.1 33.2 Median age for Other race residents36.8 32.1 18.2 Median age for Two or more races residents20.3 15.9 53.2 Median age for White alone residents50.4 55.6 27.3 Median age for Hispanic or Latino residents23.6 31.4
Owner/renter occupied households by race in Maplewood
House owners and renters - White residents 8,370 76.7% Owner occupied2,550 23.3% Renter occupiedHouse owners and renters - Black or African American residents 662 56.4% Owner occupied512 43.6% Renter occupiedHouse owners and renters - American Indian / Alaska Native residents 56 50.4% Owner occupied55 49.6% Renter occupiedHouse owners and renters - Asian residents 1,505 68.7% Owner occupied686 31.3% Renter occupiedHouse owners and renters - Other race residents 523 74.6% Owner occupied178 25.4% Renter occupiedHouse owners and renters - Two or more races residents 382 52.1% Owner occupied351 47.9% Renter occupiedHouse owners and renters - White alone residents 8,263 77.3% Owner occupied2,426 22.7% Renter occupiedHouse owners and renters - Hispanic or Latino residents 731 55.6% Owner occupied583 44.4% Renter occupied
Language usage in Maplewood
English speakers - Total 73.6% of residents of Maplewood speak English at home.
7.8% of residents speak Spanish at home 1,580 52.8% Speak English very well1,412 47.2% Speak English less than very well18.6% of residents speak other language at home 3,697 51.9% Speak English very well3,430 48.1% Speak English less than very well
English speakers - Born in the United States 89.0% of residents of Maplewood speak English at home.
4.4% of residents speak Spanish at home 221 69.5% Speak English very well97 30.5% Speak English less than very well6.3% of residents speak other language at home 381 84.7% Speak English very well69 15.3% Speak English less than very well
English speakers - Native, born elsewhere 38.9% of residents of Maplewood speak English at home.
22.8% of residents speak Spanish at home 162 100.0% Speak English very well51.0% of residents speak other language at home 185 51.1% Speak English very well177 48.9% Speak English less than very well
English speakers - Foreign-born 9.4% of residents of Maplewood speak English at home.
24.6% of residents speak Spanish at home 648 40.0% Speak English very well974 60.0% Speak English less than very well67.0% of residents speak other language at home 1,557 35.3% Speak English very well2,858 64.7% Speak English less than very well
White (Caucasian) - Speak only English Native:
97.2% (20,980)Foreign-born:
27.9% (131)
White (Caucasian) - Speak another language Native:
2.5% (535)Foreign-born:
63.9% (299)
Black or African American - Speak only English Native:
81.5% (2,011)Foreign-born:
11.6% (95)
Black or African American - Speak another language Native:
17.6% (436)Foreign-born:
88.9% (735)
American Indian / Alaska Native - Speak another language Native:
65.0% (205)Foreign-born:
70.6% (77)
Asian - Speak only English Native:
51.5% (2,027)Foreign-born:
9.1% (332)
Asian - Speak another language Native:
52.0% (2,048)Foreign-born:
90.8% (3,333)
Other race - Speak another language Native:
50.6% (709)Foreign-born:
99.3% (1,164)
Two or more races - Speak only English Native:
89.2% (1,940)Foreign-born:
7.1% (43)
Two or more races - Speak another language Native:
10.7% (232)Foreign-born:
99.0% (607)
White alone - Speak only English Native:
98.4% (20,657)Foreign-born:
21.9% (95)
White alone - Speak another language Native:
1.6% (337)Foreign-born:
73.4% (317)
Hispanic or Latino - Speak only English Native:
46.0% (1,039)Foreign-born:
5.5% (95)
Hispanic or Latino - Speak another language Native:
54.5% (1,232)Foreign-born:
94.3% (1,619)
Foreign-born residents in Maplewood 6,945 residents are foreign born (9.0% Asia , 4.1% Latin America , 2.0% Africa ).
This city:
17.1%Minnesota:
8.5%
Marital status for residents in Maplewood Marital status - White (Caucasian) population 15 years and over
Males 34.9% Never married49.3% Now married0.6% Separated2.6% Widowed12.5% DivorcedFemales 24.5% Never married46.4% Now married1.2% Separated11.1% Widowed16.7% DivorcedWomen who gave birth in the past 12 months Now married:
64.2% (215)Unmarried:
35.8% (120)
Women who did not give birth in the past 12 months Now married:
42.1% (1,617)Unmarried:
57.9% (2,220)
Marital status - Black or African American population 15 years and over
Males 39.6% Never married39.0% Now married0.0% Separated0.1% Widowed21.4% DivorcedFemales 53.1% Never married24.1% Now married3.3% Separated1.3% Widowed18.3% DivorcedWomen who gave birth in the past 12 months Now married:
78.0% (39)Unmarried:
22.0% (11)
Women who did not give birth in the past 12 months Now married:
21.1% (184)Unmarried:
78.9% (689)
Marital status - American Indian / Alaska Native population 15 years and over
Males 75.6% Never married20.0% Now married0.0% Separated0.0% Widowed4.4% DivorcedFemales 28.2% Never married9.4% Now married0.0% Separated0.0% Widowed62.4% DivorcedWomen who did not give birth in the past 12 months Now married:
0.0% (0)Unmarried:
100.0% (100)
Marital status - Asian population 15 years and over
Males 51.3% Never married41.5% Now married1.2% Separated0.3% Widowed5.8% DivorcedFemales 40.9% Never married39.7% Now married0.2% Separated1.9% Widowed17.3% DivorcedWomen who gave birth in the past 12 months Now married:
52.3% (158)Unmarried:
47.7% (144)
Women who did not give birth in the past 12 months Now married:
37.5% (746)Unmarried:
62.5% (1,245)
Marital status - Other race population 15 years and over
Males 46.2% Never married47.2% Now married0.0% Separated0.0% Widowed6.6% DivorcedFemales 21.2% Never married52.8% Now married17.7% Separated6.2% Widowed2.1% DivorcedWomen who gave birth in the past 12 months Now married:
100.0% (88)Unmarried:
0.0% (0)
Women who did not give birth in the past 12 months Now married:
49.4% (199)Unmarried:
50.6% (204)
Marital status - Two or more races population 15 years and over
Males 60.7% Never married31.6% Now married4.6% Separated0.0% Widowed3.1% DivorcedFemales 41.8% Never married36.6% Now married0.0% Separated0.0% Widowed21.6% DivorcedWomen who gave birth in the past 12 months Now married:
81.5% (45)Unmarried:
18.5% (10)
Women who did not give birth in the past 12 months Now married:
34.1% (125)Unmarried:
65.9% (242)
Marital status - White alone, not Hispanic / Latino population 15 years and over
Males 33.5% Never married50.3% Now married0.7% Separated2.6% Widowed13.0% DivorcedFemales 24.5% Never married46.4% Now married0.8% Separated11.4% Widowed17.0% DivorcedWomen who gave birth in the past 12 months Now married:
63.7% (217)Unmarried:
36.3% (124)
Women who did not give birth in the past 12 months Now married:
41.7% (1,562)Unmarried:
58.3% (2,186)
Marital status - Hispanic or Latino population 15 years and over
Males 51.0% Never married38.8% Now married2.3% Separated1.4% Widowed6.5% DivorcedFemales 30.1% Never married41.6% Now married12.0% Separated2.7% Widowed13.7% DivorcedWomen who gave birth in the past 12 months Now married:
100.0% (13)Unmarried:
0.0% (0)
Women who did not give birth in the past 12 months Now married:
42.4% (301)Unmarried:
57.6% (409)
Ancestries in Maplewood
2,447 12.0% German1,197 5.9% American786 3.9% Norwegian538 2.6% Polish489 2.4% Irish471 2.3% Swedish445 2.2% Somali409 2.0% Italian402 2.0% Ethiopian340 1.7% English328 1.6% Sudanese305 1.5% Scandinavian297 1.5% European199 1.0% French136 0.7% Dutch107 0.5% Swiss100 0.5% Nigerian95 0.5% Finnish95 0.5% African70 0.3% Hungarian70 0.3% Trinidadian and Tobagonian63 0.3% Danish48 0.2% Czech48 0.2% Northern European43 0.2% Iranian42 0.2% French Canadian41 0.2% Greek31 0.2% Yugoslavian29 0.1% British28 0.1% Romanian24 0.1% Lebanese23 0.1% Luxembourger18 0.09% Brazilian17 0.08% Russian17 0.08% Eastern European15 0.07% Scottish14 0.07% Australian14 0.07% Latvian13 0.06% Slovene12 0.06% Serbian11 0.05% Bulgarian8 0.04% Scotch-Irish8 0.04% Lithuanian
Geographical mobility in Maplewood Same house 1 year ago 19,751 87.3% White (Caucasian)2,969 85.8% Black or African American146 35.1% American Indian / Alaska Native7,490 92.1% Asian2,361 86.8% Other race2,452 84.5% Two or more races18,994 86.8% White alone, not Hispanic / Latino3,555 83.8% Hispanic or LatinoMoved within same county 1,229 5.4% White / Caucasian215 6.2% Black or African American201 48.1% American Indian / Alaska Native108 1.3% Asian51 94.6% Native Hawaiian / Pacific Islander194 7.1% Other race290 10.0% Two or more races1,229 5.6% White alone, not Hispanic / Latino599 14.1% Hispanic or LatinoMoved within same state 751 3.3% White / Caucasian146 4.2% Black or African American14 3.2% American Indian / Alaska Native398 4.9% Asian56 2.1% Other race92 3.2% Two or more races769 3.5% White alone, not Hispanic / Latino84 2.0% Hispanic or LatinoMoved from different state 853 3.8% White / Caucasian82 2.4% Black or African American40 0.5% Asian45 1.6% Two or more races876 4.0% White alone, not Hispanic / LatinoMoved from abroad 74 0.3% White5 0.1% Black or African American315 3.9% Asian41 1.5% Other race72 0.3% White alone, not Hispanic / Latino
Children Nativity (place of birth) in Maplewood
Children under 6 years - Living with two parents Both parents native 806 100.0% NativeBoth parents foreign-born 520 100.0% NativeOne native, one foreign-born parent 245 100.0% NativeChildren under 6 years - Living with one parent Native parent 603 100.0% NativeForeign-born parent 741 98.5% Native11 1.5% Foreign-bornChildren 6 to 17 years - Living with two parents Both parents native 1,781 99.8% Native4 0.2% Foreign-bornBoth parents foreign-born 1,042 77.5% Native302 22.5% Foreign-bornOne native, one foreign-born parent 409 100.0% NativeChildren 6 to 17 years - Living with one parent Native parent 1,131 100.0% NativeForeign-born parent 851 54.2% Native720 45.8% Foreign-born
Grandparents responsible for own grandchildren in Maplewood
Grandparents (30 to 59 years) White / Caucasian 76 42.7% Responsible for grandchildren102 57.3% Not responsible for grandchildrenAsian 49 75.7% Responsible for grandchildren16 24.3% Not responsible for grandchildrenOther race 27 100.0% Responsible for grandchildrenWhite alone, not Hispanic / Latino 32 27.6% Responsible for grandchildren84 72.4% Not responsible for grandchildrenHispanic or Latino 55 97.5% Responsible for grandchildren1 2.5% Not responsible for grandchildrenGrandparents (60 years and over) White / Caucasian 93 33.9% Responsible for grandchildren182 66.1% Not responsible for grandchildrenAsian 62 20.8% Responsible for grandchildren237 79.2% Not responsible for grandchildrenWhite alone, not Hispanic / Latino 6 2.9% Responsible for grandchildren191 97.1% Not responsible for grandchildrenHispanic or Latino 29 75.8% Responsible for grandchildren9 24.2% Not responsible for grandchildren