Kingsport, TN (Tennessee) Houses and Residents
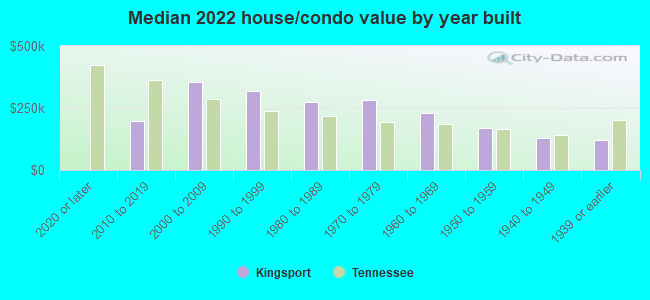
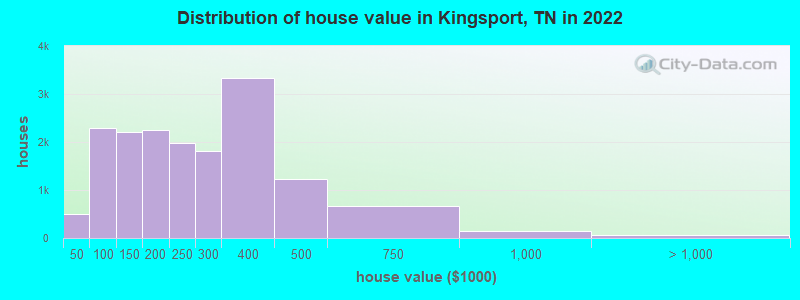
Estimated median house or condo value in 2022: $219,600 (it was $85,400 in 2000 )
Kingsport:
$219,600Tennessee:
$284,800
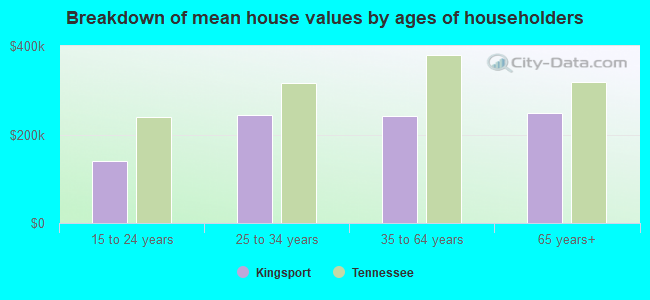
Lower value quartile - upper value quartile: $126,344 - $345,569Mean price in 2022: Detached houses: $279,423 Here:
$279,423State:
$374,382
Townhouses or other attached units: $199,989 Here:
$199,989State:
$354,101
In 2-unit structures: $230,572 Here:
$230,572State:
$247,693
In 3-to-4-unit structures: $100,512 Here:
$100,512State:
$239,060
In 5-or-more-unit structures: $176,455 Here:
$176,455State:
$317,434
Mobile homes: $52,982 Here:
$52,982State:
$101,421
Total population: 53,028 (Urban population: 43,816, Rural population: 744 (all nonfarm) )
Houses: 28,023 (24,889 occupied: 15,762 owner occupied, 9,731 renter occupied )
% of renters here:
38%State:
33%
Housing density: 636 houses/condos per square mile
Median price asked for vacant for-sale houses and condos in 2022: $174,128.
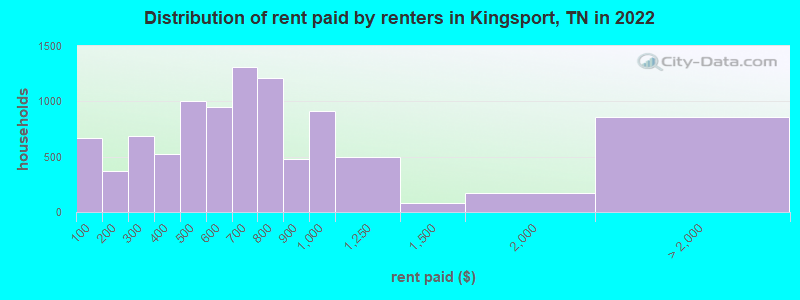
Median contract rent in 2022: $630 (lower quartile is $411, upper quartile is $799)
Median rent asked for vacant for-rent units in 2022: $1,126
Median gross rent in Kingsport, TN in 2022: $810
Housing units in Kingsport with a mortgage: 7,797 (526 second mortgage, 18 home equity loan, 423 both second mortgage and home equity loan )Houses without a mortgage: 274
Median household income for houses/condos with a mortgage: $82,363
Median household income for apartments without a mortgage: $48,015
Median monthly housing costs: $717
Data:
Median house or condo value ($)
Median house or condo value ($ change since 2000)
Median house or condo value ($) - White
Median house or condo value ($) - Black or African American
Median house or condo value ($) - Asian
Median house or condo value ($) - Hispanic or Latino
Median house or condo value ($) - American Indian and Alaska Native
Median house or condo value ($) - Multirace
Median house or condo value ($) - Other Race
Median price asked for mobile homes ($)
Household density (households per square mile)
Mean house or condo value by units in structure - 1, detached ($)
Mean house or condo value by units in structure - 1, attached ($)
Mean house or condo value by units in structure - 2 ($)
Mean house or condo value by units in structure by units in structure - 3 or 4 ($)
Mean house or condo value by units in structure - 5 or more ($)
Mean house or condo value by units in structure - Boat, RV, van, etc. ($)
Mean house or condo value by units in structure - Mobile home ($)
Median contract rent ($)
Median contract rent - Lower quartile ($)
Median contract rent - Upper quartile ($)
Median gross rent ($)
Urban houses (%)
Rural houses (%)
Houses occupied (%)
Houses occupied (% change since 2000)
Houses owner occupied (%)
Houses owner occupied (% change since 2000)
Houses renter occupied (%)
Houses renter occupied (% change since 2000)
Vacant housing units - For rent (%)
Vacant housing units - For rent (% change since 2000)
Vacant housing units - For sale only (%)
Vacant housing units - For sale only (% change since 2000)
Vacant housing units - Rented or sold, not occupied (%)
Vacant housing units - Rented or sold, not occupied (% change since 2000)
Vacant housing units - For seasonal, recreational, or occasional use (%)
Vacant housing units - For seasonal, recreational, or occasional use (% change since 2000)
Vacant housing units - For migrant workers (%)
Vacant housing units - For migrant workers (% change since 2000)
Vacant housing units - Other vacant (%)
Vacant housing units - Other vacant (% change since 2000)
Median monthly housing costs ($)
Median household income for houses/condos with a mortgage ($)
Median household income for houses/condos without a mortgage ($)
Median household income ($)
Median household income ($) - White
Median household income ($) - Black or African American
Median household income ($) - Asian
Median household income ($) - Hispanic or Latino
Median household income ($) - American Indian and Alaska Native
Median household income ($) - Multirace
Median household income ($) - Other Race
Mortgage status - with mortgage (%)
Mortgage status - with second mortgage (%)
Mortgage status - with home equity loan (%)
Mortgage status - with both second mortgage and home equity loan (%)
Mortgage status - without a mortgage (%)
Median year house/condo built
Median year apartment built
Household type by relationship - Male householder living alone (%)
Household type by relationship - Male householder not living alone (%)
Household type by relationship - Female householder living alone (%)
Household type by relationship - Female householder not living alone (%)
Household type by relationship - Opposite-Sex spouse (%)
Household type by relationship - Same-Sex spouse (%)
Household type by relationship - Opposite-Sex unmarried partner (%)
Household type by relationship - Same-Sex unmarried partner (%)
Household type by relationship - In group quarters (%)
Size of family households - 2-person household (%)
Size of family households - 3-person household (%)
Size of family households - 4-person household (%)
Size of family households - 5-person household (%)
Size of family households - 6-person household (%)
Size of family households - 7-or-more-person household (%)
Size of nonfamily households - 1-person household (%)
Size of nonfamily households - 2-person household (%)
Size of nonfamily households - 3-person household (%)
Size of nonfamily households - 4-person household (%)
Size of nonfamily households - 5-person household (%)
Size of nonfamily households - 6-person household (%)
Size of nonfamily households - 7-or-moreperson household (%)
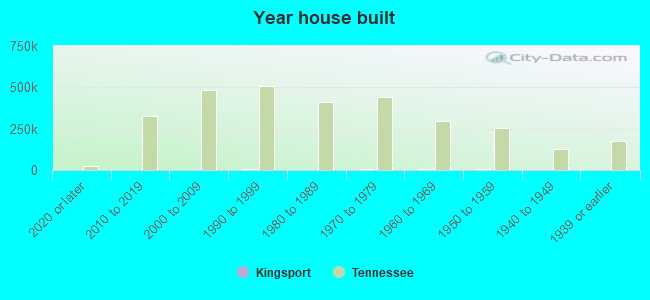
Year house built - Built 2010 or later (%)
Year house built - Built 2000 to 2009 (%)
Year house built - Built 1990 to 1999 (%)
Year house built - Built 1980 to 1989 (%)
Year house built - Built 1970 to 1979 (%)
Year house built - Built 1960 to 1969 (%)
Year house built - Built 1950 to 1959 (%)
Year house built - Built 1940 to 1949 (%)
Year house built - Built 1939 or earlier (%)
Median number of rooms in houses and condos
Median number of rooms in apartments
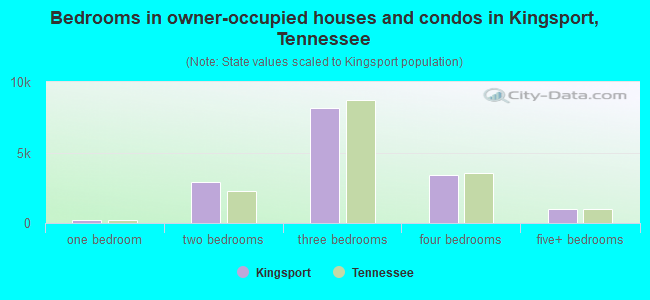
Median number of bedrooms in owner occupied houses
Mean number of bedrooms in owner occupied houses
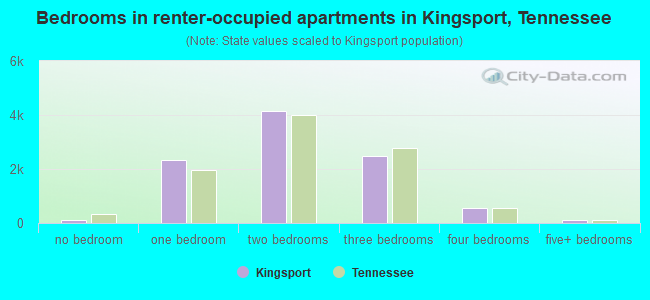
Median number of bedrooms in renter occupied houses
Mean number of bedrooms in renter occupied houses
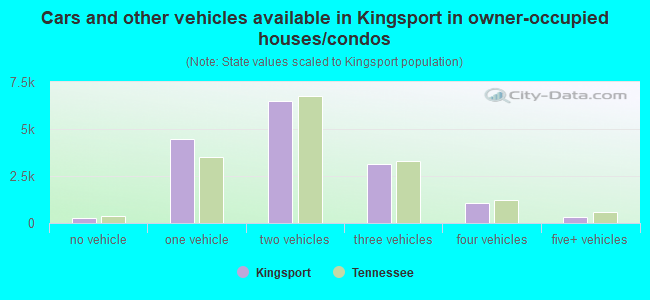
Median number of vehichles in owner occupied houses
Mean number of vehichles in owner occupied houses
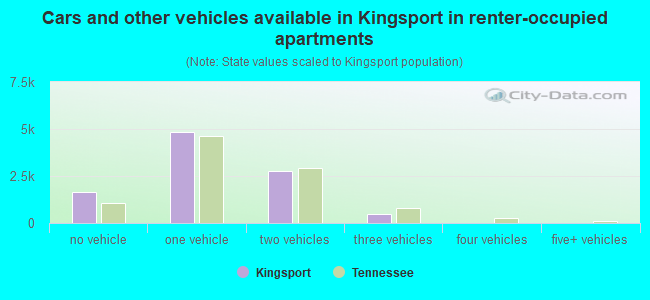
Median number of vehichles in renter occupied houses
Mean number of vehichles in renter occupied houses
Rooms in owner-occupied houses - 1 room (%)
Rooms in owner-occupied houses - 2 rooms (%)
Rooms in owner-occupied houses - 3 rooms (%)
Rooms in owner-occupied houses - 4 rooms (%)
Rooms in owner-occupied houses - 5 rooms (%)
Rooms in owner-occupied houses - 6 rooms (%)
Rooms in owner-occupied houses - 7 rooms (%)
Rooms in owner-occupied houses - 8 rooms (%)
Rooms in owner-occupied houses - 9+ rooms (%)
Rooms in renter-occupied houses - 1 room (%)
Rooms in renter-occupied houses - 2 rooms (%)
Rooms in renter-occupied houses - 3 rooms (%)
Rooms in renter-occupied houses - 4 rooms (%)
Rooms in renter-occupied houses - 5 rooms (%)
Rooms in renter-occupied houses - 6 rooms (%)
Rooms in renter-occupied houses - 7 rooms (%)
Rooms in renter-occupied houses - 8 rooms (%)
Rooms in renter-occupied houses - 9+ rooms (%)
Bedrooms in owner-occupied houses - no bedrooms (%)
Bedrooms in owner-occupied houses - 1 bedroom (%)
Bedrooms in owner-occupied houses - 2 bedrooms (%)
Bedrooms in owner-occupied houses - 3 bedrooms (%)
Bedrooms in owner-occupied houses - 4 bedrooms (%)
Bedrooms in owner-occupied houses - 5+ bedrooms (%)
Bedrooms in renter-occupied houses - no bedrooms (%)
Bedrooms in renter-occupied houses - 1 bedroom (%)
Bedrooms in renter-occupied houses - 2 bedrooms (%)
Bedrooms in renter-occupied houses - 3 bedrooms (%)
Bedrooms in renter-occupied houses - 4 bedrooms (%)
Bedrooms in renter-occupied houses - 5+ bedrooms (%)
Vehicles available in owner-occupied houses - no vehicle available (%)
Vehicles available in owner-occupied houses - 1 vehicle available(%)
Vehicles available in owner-occupied houses - 2 Vehicles available (%)
Vehicles available in owner-occupied houses - 3 Vehicles available (%)
Vehicles available in owner-occupied houses - 4 Vehicles available (%)
Vehicles available in owner-occupied houses - 5+ Vehicles available (%)
Vehicles available in renter-occupied houses - no vehicle available (%)
Vehicles available in renter-occupied houses - 1 vehicle available (%)
Vehicles available in renter-occupied houses - 2 Vehicles available (%)
Vehicles available in renter-occupied houses - 3 Vehicles available (%)
Vehicles available in renter-occupied houses - 4 Vehicles available (%)
Vehicles available in renter-occupied houses - 5+ Vehicles available (%)
Housing units in structures - 1, detached (%)
Housing units in structures - 1, attached (%)
Housing units in structures - 2 (%)
Housing units in structures - 3 or 4 (%)
Housing units in structures - 5 to 9 (%)
Housing units in structures - 10 to 19 (%)
Housing units in structures - 20 to 49 (%)
Housing units in structures - 50 or more (%)
Housing units in structures - Mobile home (%)
Housing units in structures - Boat, RV, van, etc. (%)
Housing units in structures - Owners - 1, detached (%)
Housing units in structures - Owners - 1, attached (%)
Housing units in structures - Owners - 2 (%)
Housing units in structures - Owners - 3 or 4 (%)
Housing units in structures - Owners - 5 to 9 (%)
Housing units in structures - Owners - 10 to 19 (%)
Housing units in structures - Owners - 20 to 49 (%)
Housing units in structures - Owners - 50 or more (%)
Housing units in structures - Owners - Mobile home (%)
Housing units in structures - Owners - Boat, RV, van, etc. (%)
Housing units in structures - Renters - 1, detached (%)
Housing units in structures - Renters - 1, attached (%)
Housing units in structures - Renters - 2 (%)
Housing units in structures - Renters - 3 or 4 (%)
Housing units in structures - Renters - 5 to 9 (%)
Housing units in structures - Renters - 10 to 19 (%)
Housing units in structures - Renters - 20 to 49 (%)
Housing units in structures - Renters - 50 or more (%)
Housing units in structures - Renters - Mobile home (%)
Housing units in structures - Renters - Boat, RV, van, etc. (%)
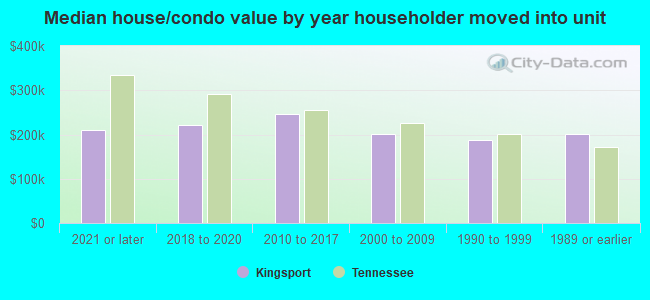
House/condo owner moved in on average (years ago)
Renter moved in on average (years ago)
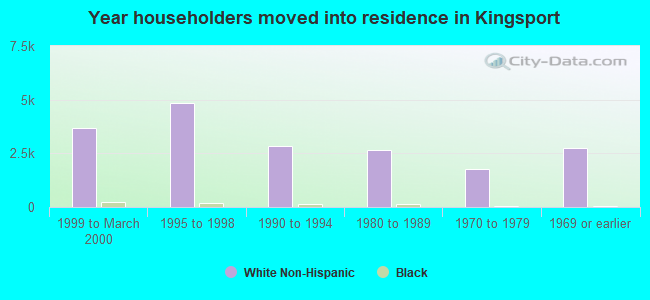
Year householder moved into unit - Moved in 1999 to March 2000 (%)
Year householder moved into unit - Moved in 1999 to March 2000 (%) - White
Year householder moved into unit - Moved in 1999 to March 2000 (%) - Black or African American
Year householder moved into unit - Moved in 1999 to March 2000 (%) - Asian
Year householder moved into unit - Moved in 1999 to March 2000 (%) - Hispanic or Latino
Year householder moved into unit - Moved in 1999 to March 2000 (%) - American Indian and Alaska Native
Year householder moved into unit - Moved in 1999 to March 2000 (%) - Multirace
Year householder moved into unit - Moved in 1999 to March 2000 (%) - Other Race
Year householder moved into unit - Moved in 1995 to 1998 (%)
Year householder moved into unit - Moved in 1995 to 1998 (%) - White
Year householder moved into unit - Moved in 1995 to 1998 (%) - Black or African American
Year householder moved into unit - Moved in 1995 to 1998 (%) - Asian
Year householder moved into unit - Moved in 1995 to 1998 (%) - Hispanic or Latino
Year householder moved into unit - Moved in 1995 to 1998 (%) - American Indian and Alaska Native
Year householder moved into unit - Moved in 1995 to 1998 (%) - Multirace
Year householder moved into unit - Moved in 1995 to 1998 (%) - Other Race
Year householder moved into unit - Moved in 1990 to 1994 (%)
Year householder moved into unit - Moved in 1990 to 1994 (%) - White
Year householder moved into unit - Moved in 1990 to 1994 (%) - Black or African American
Year householder moved into unit - Moved in 1990 to 1994 (%) - Asian
Year householder moved into unit - Moved in 1990 to 1994 (%) - Hispanic or Latino
Year householder moved into unit - Moved in 1990 to 1994 (%) - American Indian and Alaska Native
Year householder moved into unit - Moved in 1990 to 1994 (%) - Multirace
Year householder moved into unit - Moved in 1990 to 1994 (%) - Other Race
Year householder moved into unit - Moved in 1980 to 1989 (%)
Year householder moved into unit - Moved in 1980 to 1989 (%) - White
Year householder moved into unit - Moved in 1980 to 1989 (%) - Black or African American
Year householder moved into unit - Moved in 1980 to 1989 (%) - Asian
Year householder moved into unit - Moved in 1980 to 1989 (%) - Hispanic or Latino
Year householder moved into unit - Moved in 1980 to 1989 (%) - American Indian and Alaska Native
Year householder moved into unit - Moved in 1980 to 1989 (%) - Multirace
Year householder moved into unit - Moved in 1980 to 1989 (%) - Other Race
Year householder moved into unit - Moved in 1970 to 1979 (%)
Year householder moved into unit - Moved in 1970 to 1979 (%) - White
Year householder moved into unit - Moved in 1970 to 1979 (%) - Black or African American
Year householder moved into unit - Moved in 1970 to 1979 (%) - Asian
Year householder moved into unit - Moved in 1970 to 1979 (%) - Hispanic or Latino
Year householder moved into unit - Moved in 1970 to 1979 (%) - American Indian and Alaska Native
Year householder moved into unit - Moved in 1970 to 1979 (%) - Multirace
Year householder moved into unit - Moved in 1970 to 1979 (%) - Other Race
Year householder moved into unit - Moved in 1969 or earlier (%)
Year householder moved into unit - Moved in 1969 or earlier (%) - White
Year householder moved into unit - Moved in 1969 or earlier (%) - Black or African American
Year householder moved into unit - Moved in 1969 or earlier (%) - Asian
Year householder moved into unit - Moved in 1969 or earlier (%) - Hispanic or Latino
Year householder moved into unit - Moved in 1969 or earlier (%) - American Indian and Alaska Native
Year householder moved into unit - Moved in 1969 or earlier (%) - Multirace
Year householder moved into unit - Moved in 1969 or earlier (%) - Other Race
Housing units lacking complete plumbing facilities (%)
Housing units lacking complete kitchen facilities (%)
House heating fuel used in houses and condos - Utility gas (%)
House heating fuel used in houses and condos - Bottled, tank, or LP gas (%)
House heating fuel used in houses and condos - Electricity (%)
House heating fuel used in houses and condos - Fuel oil, kerosene, etc. (%)
House heating fuel used in houses and condos - Coal or coke (%)
House heating fuel used in houses and condos - Wood (%)
House heating fuel used in houses and condos - Solar energy (%)
House heating fuel used in houses and condos - Other fuel (%)
House heating fuel used in houses and condos - No fuel used (%)
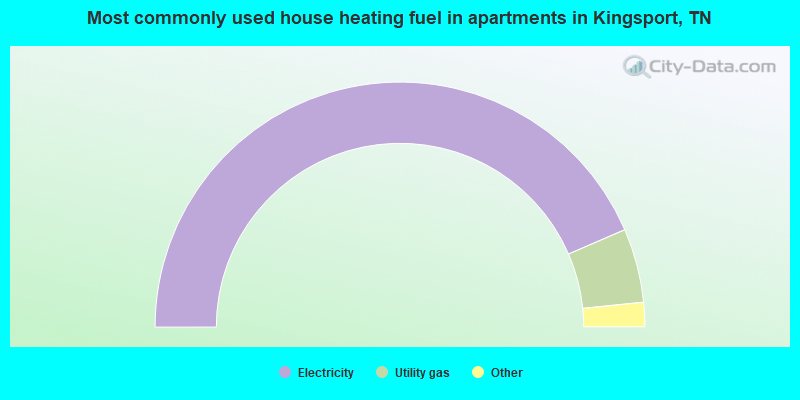
House heating fuel used in apartments - Utility gas (%)
House heating fuel used in apartments - Bottled, tank, or LP gas (%)
House heating fuel used in apartments - Electricity (%)
House heating fuel used in apartments - Fuel oil, kerosene, etc. (%)
House heating fuel used in apartments - Coal or coke (%)
House heating fuel used in apartments - Wood (%)
House heating fuel used in apartments - Solar energy (%)
House heating fuel used in apartments - Other fuel (%)
House heating fuel used in apartments - No fuel used (%)
Latest news about housing in Kingsport, TN collected exclusively by city-data.com from local newspapers, TV, and radio stations
Median year house/condo built: 1970Median year apartment built: 1976Household type by relationship:
Households: 56,147
Male householders: 11,806 (3,642 living alone ), Female householders: 13,235 (4,996 living alone )10,301 spouses (10,184 opposite-sex spouses ), 2,007 unmarried partners , (1,912 opposite-sex unmarried partners ), 13,548 children (12,333 natural , 443 adopted , 771 stepchildren ), 1,422 grandchildren , 576 brothers or sisters , 729 parents , 8 foster children , 673 other relatives , 971 non-relatives In group quarters: 866
Size of family households: 8,436 2-persons , 3,608 3-persons , 2,139 4-persons , 838 5-persons , 188 6-persons , 180 7-or-more-persons .
Size of nonfamily households: 8,506 1-person , 1,444 2-persons , 87 3-persons , 19 4-persons .
5,008 married couples with children. single-parent households (376 men , 3,684 women ).
97.1% of residents of Kingsport speak English at home. of residents speak Spanish at home (66% speak English very well , 19% speak English well , 9% speak English not well , 7% don't speak English at all ).of residents speak other Indo-European language at home (71% speak English very well , 20% speak English well , 9% speak English not well ).of residents speak Asian or Pacific Island language at home (74% speak English very well , 5% speak English well , 16% speak English not well , 5% don't speak English at all ).of residents speak other language at home (74% speak English very well , 26% speak English well ).
Foreign born population: 1,628 (2.9%)of them are naturalized citizens )
Median number of rooms in houses and condos:
Median number of rooms in apartments
Owner-occupied Renter-occupied
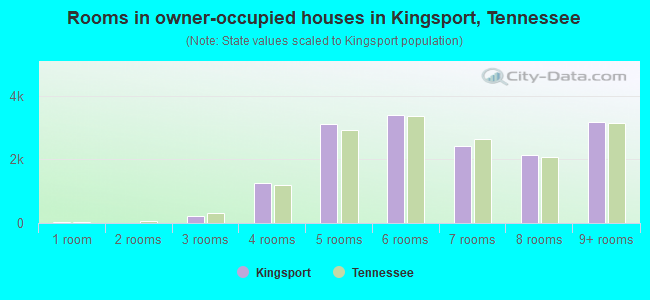
Rooms in owner-occupied houses in Kingsport, Tennessee
19 1 room 8 2 rooms 231 3 rooms 1,245 4 rooms 3,125 5 rooms 3,400 6 rooms 2,424 7 rooms 2,142 8 rooms 3,168 9+ rooms
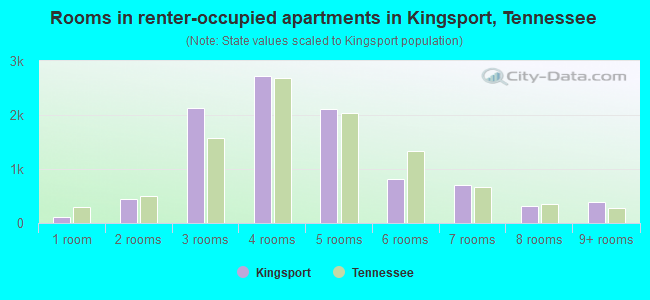
Rooms in renter-occupied apartments in Kingsport, Tennessee
113 1 room 451 2 rooms 2,134 3 rooms 2,728 4 rooms 2,104 5 rooms 813 6 rooms 695 7 rooms 309 8 rooms 383 9+ rooms
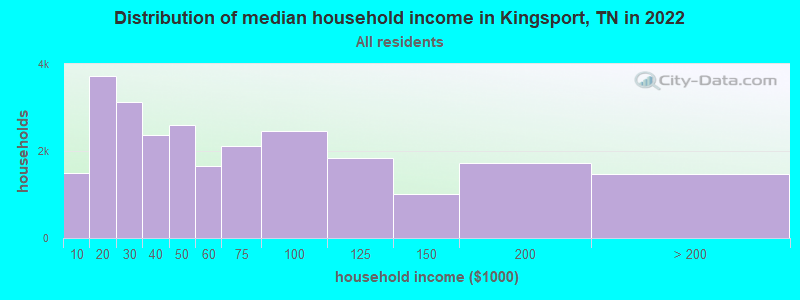
Kingsport, TN household income distribution 1,504 Less than $10,0003,730 $10,000 to $19,9993,124 $20,000 to $29,9992,359 $30,000 to $39,9992,608 $40,000 to $49,9991,657 $50,000 to $59,9992,112 $60,000 to $74,9992,465 $75,000 to $99,9991,842 $100,000 to $124,9991,011 $125,000 to $149,9991,717 $150,000 to $199,9991,481 $200,000 or more
Home value of owner - occupied houses in 2022 in Kingsport, TN 164 Less than $10,00023 $10,000 to $14,99973 $15,000 to $19,99943 $20,000 to $24,99928 $25,000 to $29,99925 $30,000 to $34,99988 $35,000 to $39,99959 $40,000 to $49,999297 $50,000 to $59,999258 $60,000 to $69,999518 $70,000 to $79,999667 $80,000 to $89,999491 $90,000 to $99,9991,326 $100,000 to $124,999880 $125,000 to $149,9991,468 $150,000 to $174,999789 $175,000 to $199,9991,988 $200,000 to $249,9991,812 $250,000 to $299,9993,337 $300,000 to $399,9991,225 $400,000 to $499,999658 $500,000 to $749,999142 $750,000 to $999,99953 $1,000,000 to $1,499,99914 $2,000,000 or moreRent paid by renters in 2022 in Kingsport, TN 670 Less than $100119 $100 to $149249 $150 to $199435 $200 to $249252 $250 to $299223 $300 to $349302 $350 to $399568 $400 to $449430 $450 to $499540 $500 to $549404 $550 to $599714 $600 to $649595 $650 to $699619 $700 to $749594 $750 to $799480 $800 to $899913 $900 to $999493 $1,000 to $1,24983 $1,250 to $1,499176 $1,500 to $1,99949 $2,000 to $2,49953 $3,000 to $3,49931 $3,500 or more723 No cash rent
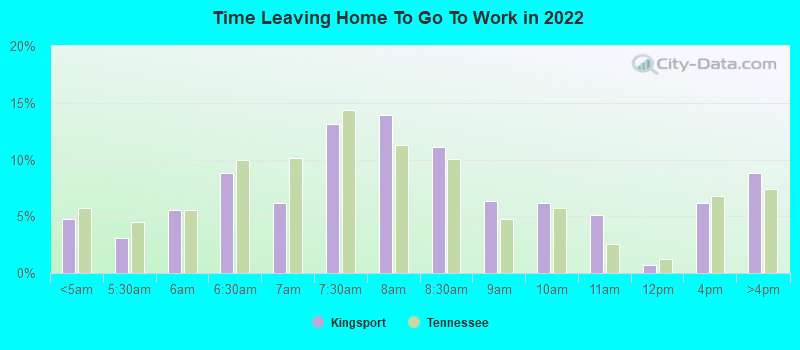
Percentage of workers working in this county: 81.6%Number of people working at home: 3,224 (13.6% of all workers )
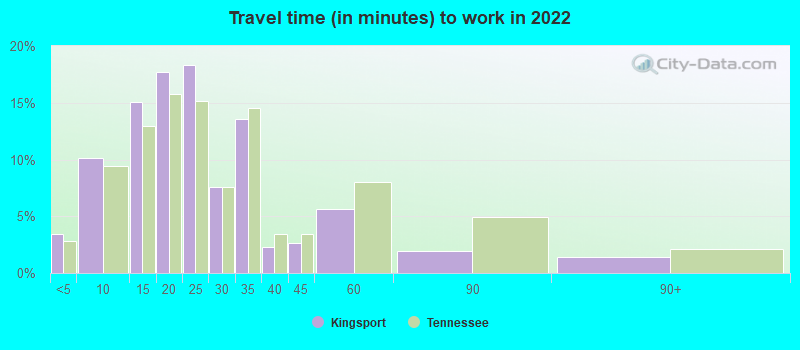
Travel time to work (commute)
Less than 5 minutes: 1,2635 to 9 minutes: 3,38010 to 14 minutes: 4,14815 to 19 minutes: 4,13920 to 24 minutes: 2,38525 to 29 minutes: 84330 to 34 minutes: 2,08035 to 39 minutes: 45640 to 44 minutes: 30945 to 59 minutes: 53660 to 89 minutes: 14690 or more minutes: 374
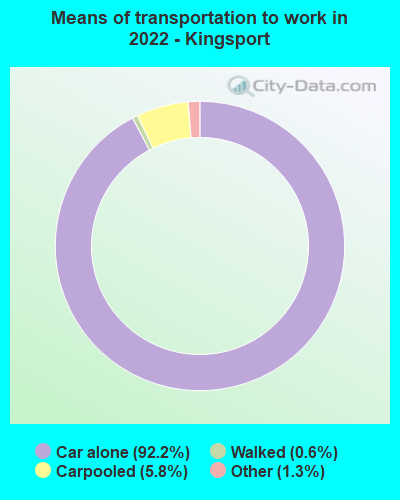
Means of transportation to work:
Drove a car alone: 37,175 (83.2%)Carpooled: 2,477 (5.5%)Bus : 1 (0.0%)Taxi: 671 (1.5%)Bicycle: 26 (0.1%)Walked: 259 (0.6%)Worked at home: 3,224 (7.2%)
Unemployment by race in 2022
Unemployment rate for White non-Hispanic residents 3.3% Males3.9% FemalesUnemployment rate for Black residents 2.2% Males2.5% FemalesUnemployment rate for Asian residents 6.0% Males4.0% FemalesUnemployment rate for other race residents 2.3% Males10.8% FemalesUnemployment rate for two or more race residents 8.5% Males18.1% FemalesUnemployment rate for Hispanic or Latino residents 1.1% Males23.2% Females
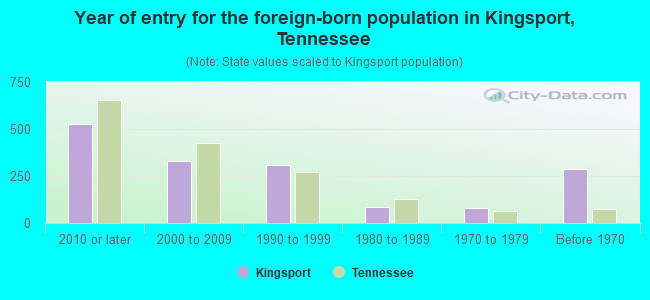
Year of entry for the foreign-born population in Kingsport, Tennessee
528 2010 or later 329 2000 to 2009 311 1990 to 1999 86 1980 to 1989 78 1970 to 1979 285 Before 1970
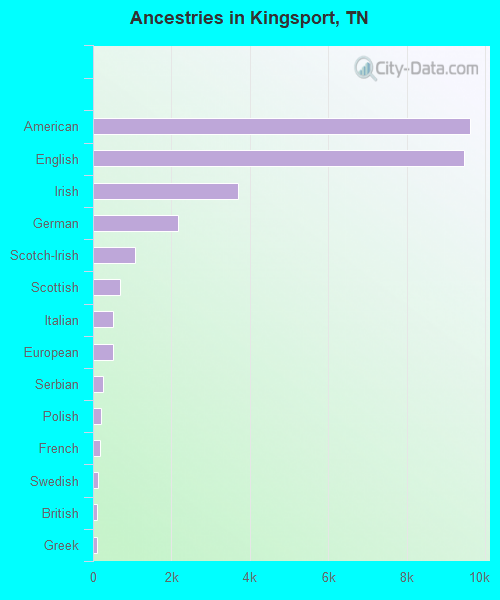
First ancestries reported:
American: 9,614 (28.8%)
English: 9,470 (28.3%)
Irish: 3,694 (11.1%)
German: 2,165 (6.5%)
Scotch-Irish: 1,065 (3.2%)
Scottish: 694 (2.1%)
Italian: 512 (1.5%)
European: 503 (1.5%)
Serbian: 256 (0.8%)
Polish: 212 (0.6%)
French: 183 (0.5%)
Swedish: 121 (0.4%)
British: 101 (0.3%)
Greek: 97 (0.3%)
Yugoslavian: 74 (0.2%)
Welsh: 72 (0.2%)
Eastern European: 65 (0.2%)
Scandinavian: 64 (0.2%)
Northern European: 54 (0.2%)
Norwegian: 43 (0.1%)
French Canadian: 39 (0.1%)
Dutch: 35 (0.1%)
Egyptian: 27 (0.08%)
Czech: 26 (0.08%)
Moroccan: 25 (0.07%)
Portuguese: 25 (0.07%)
Swiss: 22 (0.07%)
Israeli: 19 (0.06%)
Iranian: 19 (0.06%)
Jamaican: 19 (0.06%)
Canadian: 12 (0.04%)
Ukrainian: 12 (0.04%)
Czechoslovakian: 11 (0.03%)
Nigerian: 10 (0.03%)
Croatian: 9 (0.03%)
Finnish: 8 (0.02%)
African: 8 (0.02%)
Slovene: 7 (0.02%)
Armenian: 6 (0.02%) Most common places of birth for foreign-born residents (%): China, excluding Hong Kong and Taiwan Kingsport:
12.9% (188)Tennessee:
3.3% (12,582)
Mexico Kingsport:
12.7% (185)Tennessee:
23.0% (86,435)
Bangladesh Kingsport:
9.3% (136)Tennessee:
0.2% (931)
Guatemala Kingsport:
7.7% (113)Tennessee:
5.7% (21,286)
India Kingsport:
6.2% (91)Tennessee:
6.1% (23,079)
Vietnam Kingsport:
5.8% (85)Tennessee:
2.4% (8,894)
Philippines Kingsport:
5.6% (82)Tennessee:
3.1% (11,640)
England Kingsport:
4.5% (66)Tennessee:
1.2% (4,587)
Canada Kingsport:
4.2% (61)Tennessee:
2.7% (10,295)
Germany Kingsport:
3.7% (54)Tennessee:
2.2% (8,261)
Nicaragua Kingsport:
3.6% (53)Tennessee:
0.2% (920)
North Macedonia (Macedonia) Kingsport:
3.3% (48)Tennessee:
0.0% (43)
Brazil Kingsport:
2.9% (42)Tennessee:
0.8% (3,098)
Egypt Kingsport:
2.6% (38)Tennessee:
3.1% (11,761)
Japan Kingsport:
2.2% (32)Tennessee:
0.9% (3,225)
Bosnia and Herzegovina Kingsport:
2.2% (32)Tennessee:
0.3% (1,183)
Other South America Kingsport:
2.2% (32)Tennessee:
0.0% (114)
Iran Kingsport:
1.9% (28)Tennessee:
0.8% (2,872)
Morocco Kingsport:
1.8% (27)Tennessee:
0.1% (471)
Peru Kingsport:
1.8% (26)Tennessee:
0.6% (2,336)
Place of birth for U.S.-born residents:
This state: 34,031Other state: 20,203Northeast: 2,163Midwest: 3,225South: 12,982West: 1,580 89.7% of Kingsport residents lived in the same house 1 years ago.
Out of people who lived in different houses, 28.3% lived in this county.
Out of people who lived in different counties, 65.8% lived in Tennessee.
Kingsport:
89.7%State average:
87.0%
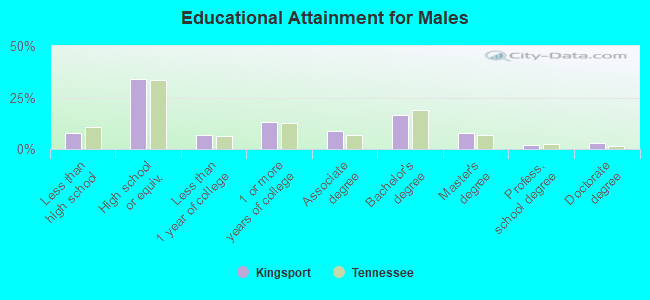
Education attainment for males 25 years and older:
No schooling: 294Nursery to 4th grade: 295th and 6th grade: 1247th and 8th grade: 1489th grade: 13410th grade: 16411th grade: 43112th grade, no diploma: 154High school graduate (or equivalency): 6,397Less than 1 year of college: 1,291Some college more than 1 year, no degree: 2,459Associate degree: 1,683Bachelor's degree: 3,138Master's degree: 1,486Professional school degree: 383Doctorate degree: 535
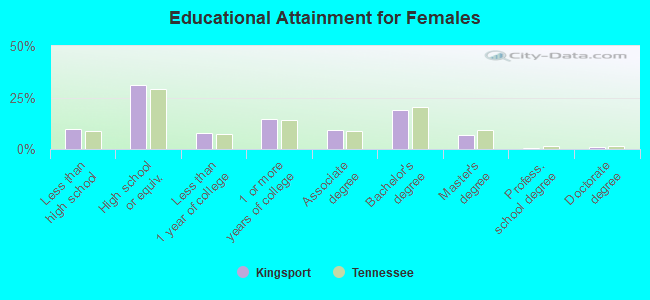
Education attainment for females 25 years and older:
No schooling: 122Nursery to 4th grade: 355th and 6th grade: 907th and 8th grade: 6699th grade: 31710th grade: 31311th grade: 35212th grade, no diploma: 264High school graduate (or equivalency): 6,863Less than 1 year of college: 1,729Some college more than 1 year, no degree: 3,166Associate degree: 2,049Bachelor's degree: 4,148Master's degree: 1,464Professional school degree: 155Doctorate degree: 243
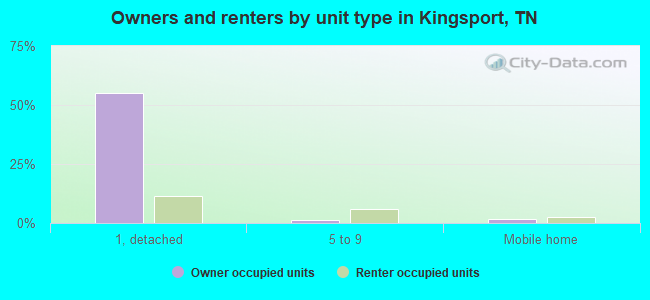
Housing units in structures:
One, detached: 17,911One, attached: 787Two: 1,0443 or 4: 1,6435 to 9: 2,40810 to 19: 1,86520 to 49: 56550 or more: 760Mobile homes: 981Boats, RVs, vans, etc.: 55Median worth of mobile homes: $44,191
Housing units lacking complete plumbing facilities in 2022: 0.7%Housing units lacking complete kitchen facilities in 2022: 2.1%House/condo owner moved in on average 12 years ago
Renter moved in on average 2 years ago
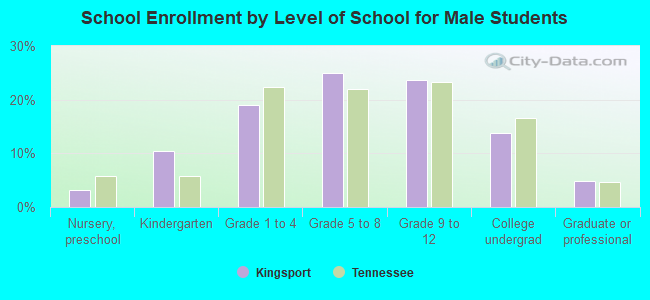
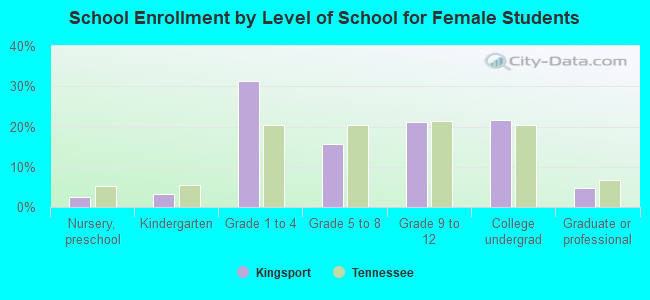
Private vs. public school enrollment:
Students in private schools in grades 1 to 8 (elementary and middle school): 572 Here:
11.6%Tennessee:
15.0%
Students in private schools in grades 9 to 12 (high school): 407 Here:
16.7%Tennessee:
16.2%
Students in private undergraduate colleges: 410 Here:
19.1%Tennessee:
23.5%