Races in Kingsport, Tennessee (TN) Detailed Stats
Data:
Races - White alone (%)
Races - White alone (% change since 2000)
Races - Black alone (%)
Races - Black alone (% change since 2000)
Races - American Indian alone (%)
Races - American Indian alone (% change since 2000)
Races - Asian alone (%)
Races - Asian alone (% change since 2000)
Races - Hispanic (%)
Races - Hispanic (% change since 2000)
Races - Native Hawaiian and Other Pacific Islander alone (%)
Races - Native Hawaiian and Other Pacific Islander alone (% change since 2000)
Races - Two or more races(%)
Races - Two or more races(% change since 2000)
Races - Other race alone (%)
Races - Other race alone (% change since 2000)
Racial diversity
Place of birth - Born in state of residence (%)
Place of birth - Born in state of residence (%) - White
Place of birth - Born in state of residence (%) - Black or African American
Place of birth - Born in state of residence (%) - Asian
Place of birth - Born in state of residence (%) - Hispanic or Latino
Place of birth - Born in state of residence (%) - American Indian and Alaska Native
Place of birth - Born in state of residence (%) - Multirace
Place of birth - Born in state of residence (%) - Other Race
Place of birth - Born in other state (%)
Place of birth - Born in other state (%) - White
Place of birth - Born in other state (%) - Black or African American
Place of birth - Born in other state (%) - Asian
Place of birth - Born in other state (%) - Hispanic or Latino
Place of birth - Born in other state (%) - American Indian and Alaska Native
Place of birth - Born in other state (%) - Multirace
Place of birth - Born in other state (%) - Other Race
Place of birth - Native, outside of US (%)
Place of birth - Native, outside of US (%) - White
Place of birth - Native, outside of US (%) - Black or African American
Place of birth - Native, outside of US (%) - Asian
Place of birth - Native, outside of US (%) - Hispanic or Latino
Place of birth - Native, outside of US (%) - American Indian and Alaska Native
Place of birth - Native, outside of US (%) - Multirace
Place of birth - Native, outside of US (%) - Other Race
Place of birth - Foreign born (%)
Place of birth - Foreign born (%) - White
Place of birth - Foreign born (%) - Black or African American
Place of birth - Foreign born (%) - Asian
Place of birth - Foreign born (%) - Hispanic or Latino
Place of birth - Foreign born (%) - American Indian and Alaska Native
Place of birth - Foreign born (%) - Multirace
Place of birth - Foreign born (%) - Other Race
Residents speaking English at home (%)
Residents speaking English at home - Born in the United States (%)
Residents speaking English at home - Native, born elsewhere (%)
Residents speaking English at home - Foreign born (%)
Residents speaking Spanish at home (%)
Residents speaking Spanish at home - Born in the United States (%)
Residents speaking Spanish at home - Native, born elsewhere (%)
Residents speaking Spanish at home - Foreign born (%)
Residents speaking other language at home (%)
Residents speaking other language at home - Born in the United States (%)
Residents speaking other language at home - Native, born elsewhere (%)
Residents speaking other language at home - Foreign born (%)
Marital status - Never married (%)
Marital status - Now married (%)
Marital status - Separated (%)
Marital status - Widowed (%)
Marital status - Divorced (%)
Ancestries Reported - Arab (%)
Ancestries Reported - Czech (%)
Ancestries Reported - Danish (%)
Ancestries Reported - Dutch (%)
Ancestries Reported - English (%)
Ancestries Reported - French (%)
Ancestries Reported - French Canadian (%)
Ancestries Reported - German (%)
Ancestries Reported - Greek (%)
Ancestries Reported - Hungarian (%)
Ancestries Reported - Irish (%)
Ancestries Reported - Italian (%)
Ancestries Reported - Lithuanian (%)
Ancestries Reported - Norwegian (%)
Ancestries Reported - Polish (%)
Ancestries Reported - Portuguese (%)
Ancestries Reported - Russian (%)
Ancestries Reported - Scotch-Irish (%)
Ancestries Reported - Scottish (%)
Ancestries Reported - Slovak (%)
Ancestries Reported - Subsaharan African (%)
Ancestries Reported - Swedish (%)
Ancestries Reported - Swiss (%)
Ancestries Reported - Ukrainian (%)
Ancestries Reported - United States (%)
Ancestries Reported - Welsh (%)
Ancestries Reported - West Indian (%)
Ancestries Reported - Other (%)
Geographical mobility - Same house 1 year ago (%)
Geographical mobility - Same house 1 year ago (%) - White
Geographical mobility - Same house 1 year ago (%) - Black or African American
Geographical mobility - Same house 1 year ago (%) - Asian
Geographical mobility - Same house 1 year ago (%) - Hispanic or Latino
Geographical mobility - Same house 1 year ago (%) - American Indian and Alaska Native
Geographical mobility - Same house 1 year ago (%) - Multirace
Geographical mobility - Same house 1 year ago (%) - Other Race
Geographical mobility - Moved within same county (%)
Geographical mobility - Moved within same county (%) - White
Geographical mobility - Moved within same county (%) - Black or African American
Geographical mobility - Moved within same county (%) - Asian
Geographical mobility - Moved within same county (%) - Hispanic or Latino
Geographical mobility - Moved within same county (%) - American Indian and Alaska Native
Geographical mobility - Moved within same county (%) - Multirace
Geographical mobility - Moved within same county (%) - Other Race
Geographical mobility - Moved from different county within same state (%)
Geographical mobility - Moved from different county within same state (%) - White
Geographical mobility - Moved from different county within same state (%) - Black or African American
Geographical mobility - Moved from different county within same state (%) - Asian
Geographical mobility - Moved from different county within same state (%) - Hispanic or Latino
Geographical mobility - Moved from different county within same state (%) - American Indian and Alaska Native
Geographical mobility - Moved from different county within same state (%) - Multirace
Geographical mobility - Moved from different county within same state (%) - Other Race
Geographical mobility - Moved from different state (%)
Geographical mobility - Moved from different state (%) - White
Geographical mobility - Moved from different state (%) - Black or African American
Geographical mobility - Moved from different state (%) - Asian
Geographical mobility - Moved from different state (%) - Hispanic or Latino
Geographical mobility - Moved from different state (%) - American Indian and Alaska Native
Geographical mobility - Moved from different state (%) - Multirace
Geographical mobility - Moved from different state (%) - Other Race
Geographical mobility - Moved from abroad (%)
Geographical mobility - Moved from abroad (%) - White
Geographical mobility - Moved from abroad (%) - Black or African American
Geographical mobility - Moved from abroad (%) - Asian
Geographical mobility - Moved from abroad (%) - Hispanic or Latino
Geographical mobility - Moved from abroad (%) - American Indian and Alaska Native
Geographical mobility - Moved from abroad (%) - Multirace
Geographical mobility - Moved from abroad (%) - Other Race
Place of birth for the foreign-born population - Ireland (%)
Place of birth for the foreign-born population - Denmark (%)
Place of birth for the foreign-born population - Norway (%)
Place of birth for the foreign-born population - Sweden (%)
Place of birth for the foreign-born population - United Kingdom (%)
Place of birth for the foreign-born population - England (%)
Place of birth for the foreign-born population - Scotland (%)
Place of birth for the foreign-born population - Other Northern Europe (%)
Place of birth for the foreign-born population - Austria (%)
Place of birth for the foreign-born population - Belgium (%)
Place of birth for the foreign-born population - France (%)
Place of birth for the foreign-born population - Germany (%)
Place of birth for the foreign-born population - Netherlands (%)
Place of birth for the foreign-born population - Switzerland (%)
Place of birth for the foreign-born population - Other Western Europe (%)
Place of birth for the foreign-born population - Greece (%)
Place of birth for the foreign-born population - Italy (%)
Place of birth for the foreign-born population - Portugal (%)
Place of birth for the foreign-born population - Spain (%)
Place of birth for the foreign-born population - Other Southern Europe (%)
Place of birth for the foreign-born population - Albania (%)
Place of birth for the foreign-born population - Belarus (%)
Place of birth for the foreign-born population - Bosnia and Herzegovina (%)
Place of birth for the foreign-born population - Bulgaria (%)
Place of birth for the foreign-born population - Croatia (%)
Place of birth for the foreign-born population - Czechoslovakia (%)
Place of birth for the foreign-born population - Hungary (%)
Place of birth for the foreign-born population - Latvia (%)
Place of birth for the foreign-born population - Lithuania (%)
Place of birth for the foreign-born population - North Macedonia (Macedonia) (%)
Place of birth for the foreign-born population - Moldova (%)
Place of birth for the foreign-born population - Poland (%)
Place of birth for the foreign-born population - Romania (%)
Place of birth for the foreign-born population - Russia (%)
Place of birth for the foreign-born population - Serbia (%)
Place of birth for the foreign-born population - Ukraine (%)
Place of birth for the foreign-born population - Other Eastern Europe (%)
Place of birth for the foreign-born population - China (%)
Place of birth for the foreign-born population - Hong Kong (%)
Place of birth for the foreign-born population - Taiwan (%)
Place of birth for the foreign-born population - Japan (%)
Place of birth for the foreign-born population - Korea (%)
Place of birth for the foreign-born population - Other Eastern Asia (%)
Place of birth for the foreign-born population - Afghanistan (%)
Place of birth for the foreign-born population - Bangladesh (%)
Place of birth for the foreign-born population - India (%)
Place of birth for the foreign-born population - Iran (%)
Place of birth for the foreign-born population - Kazakhstan (%)
Place of birth for the foreign-born population - Nepal (%)
Place of birth for the foreign-born population - Pakistan (%)
Place of birth for the foreign-born population - Sri Lanka (%)
Place of birth for the foreign-born population - Uzbekistan (%)
Place of birth for the foreign-born population - Other South Central Asia (%)
Place of birth for the foreign-born population - Burma (%)
Place of birth for the foreign-born population - Cambodia (%)
Place of birth for the foreign-born population - Indonesia (%)
Place of birth for the foreign-born population - Laos (%)
Place of birth for the foreign-born population - Malaysia (%)
Place of birth for the foreign-born population - Philippines (%)
Place of birth for the foreign-born population - Singapore (%)
Place of birth for the foreign-born population - Thailand (%)
Place of birth for the foreign-born population - Vietnam (%)
Place of birth for the foreign-born population - Other South Eastern Asia (%)
Place of birth for the foreign-born population - Armenia (%)
Place of birth for the foreign-born population - Iraq (%)
Place of birth for the foreign-born population - Israel (%)
Place of birth for the foreign-born population - Jordan (%)
Place of birth for the foreign-born population - Kuwait (%)
Place of birth for the foreign-born population - Lebanon (%)
Place of birth for the foreign-born population - Saudi Arabia (%)
Place of birth for the foreign-born population - Syria (%)
Place of birth for the foreign-born population - Turkey (%)
Place of birth for the foreign-born population - Yemen (%)
Place of birth for the foreign-born population - Other Western Asia (%)
Place of birth for the foreign-born population - Eritrea (%)
Place of birth for the foreign-born population - Ethiopia (%)
Place of birth for the foreign-born population - Kenya (%)
Place of birth for the foreign-born population - Somalia (%)
Place of birth for the foreign-born population - Uganda (%)
Place of birth for the foreign-born population - Zimbabwe (%)
Place of birth for the foreign-born population - Other Eastern Africa (%)
Place of birth for the foreign-born population - Cameroon (%)
Place of birth for the foreign-born population - Congo (%)
Place of birth for the foreign-born population - Democratic Republic of Congo (Zaire) (%)
Place of birth for the foreign-born population - Other Middle Africa (%)
Place of birth for the foreign-born population - Egypt (%)
Place of birth for the foreign-born population - Morocco (%)
Place of birth for the foreign-born population - Sudan (%)
Place of birth for the foreign-born population - Other Northern Africa (%)
Place of birth for the foreign-born population - South Africa (%)
Place of birth for the foreign-born population - Other Southern Africa (%)
Place of birth for the foreign-born population - Cabo Verde (%)
Place of birth for the foreign-born population - Ghana (%)
Place of birth for the foreign-born population - Liberia (%)
Place of birth for the foreign-born population - Nigeria (%)
Place of birth for the foreign-born population - Senegal (%)
Place of birth for the foreign-born population - Sierra Leone (%)
Place of birth for the foreign-born population - Other Western Africa (%)
Place of birth for the foreign-born population - Australia (%)
Place of birth for the foreign-born population - New Zealand (%)
Place of birth for the foreign-born population - Fiji (%)
Place of birth for the foreign-born population - Micronesia (%)
Place of birth for the foreign-born population - Bahamas (%)
Place of birth for the foreign-born population - Barbados (%)
Place of birth for the foreign-born population - Cuba (%)
Place of birth for the foreign-born population - Dominica (%)
Place of birth for the foreign-born population - Dominican Republic (%)
Place of birth for the foreign-born population - Grenada (%)
Place of birth for the foreign-born population - Haiti (%)
Place of birth for the foreign-born population - Jamaica (%)
Place of birth for the foreign-born population - St. Vincent and the Grenadines (%)
Place of birth for the foreign-born population - Trinidad and Tobago (%)
Place of birth for the foreign-born population - West Indies (%)
Place of birth for the foreign-born population - Other Caribbean (%)
Place of birth for the foreign-born population - Belize (%)
Place of birth for the foreign-born population - Costa Rica (%)
Place of birth for the foreign-born population - El Salvador (%)
Place of birth for the foreign-born population - Guatemala (%)
Place of birth for the foreign-born population - Honduras (%)
Place of birth for the foreign-born population - Mexico (%)
Place of birth for the foreign-born population - Nicaragua (%)
Place of birth for the foreign-born population - Panama (%)
Place of birth for the foreign-born population - Other Central America (%)
Place of birth for the foreign-born population - Argentina (%)
Place of birth for the foreign-born population - Bolivia (%)
Place of birth for the foreign-born population - Brazil (%)
Place of birth for the foreign-born population - Chile (%)
Place of birth for the foreign-born population - Colombia (%)
Place of birth for the foreign-born population - Ecuador (%)
Place of birth for the foreign-born population - Guyana (%)
Place of birth for the foreign-born population - Peru (%)
Place of birth for the foreign-born population - Uruguay (%)
Place of birth for the foreign-born population - Venezuela (%)
Place of birth for the foreign-born population - Other South America (%)
Place of birth for the foreign-born population - Canada (%)
Place of birth for the foreign-born population - Other Northern America (%)
Place of birth for the foreign-born population - Other (%)
Latest news about races in Kingsport, TN collected exclusively by city-data.com from local newspapers, TV, and radio stations
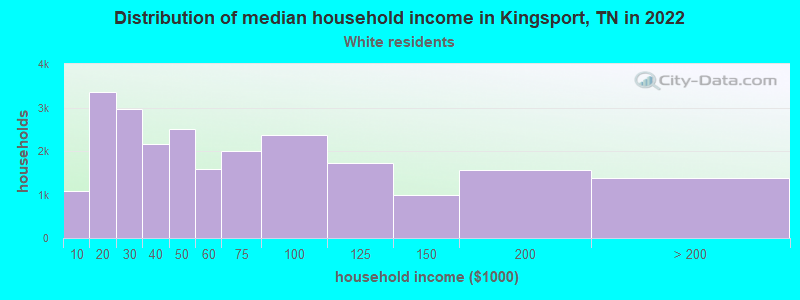
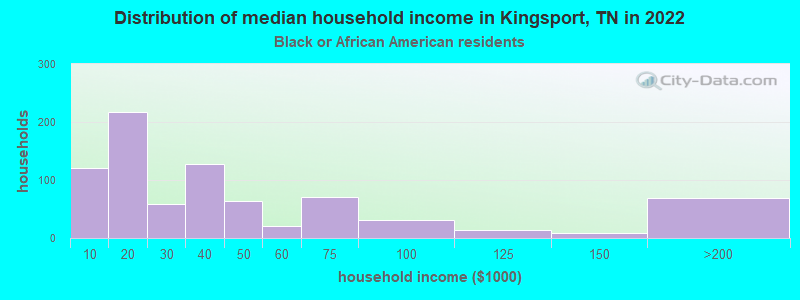
According to 2022 data, the most numerous races in Kingsport, TN are White alone (49,613 residents), Black alone (802 residents), and Hispanic (1,624 residents). 97.3% of Kingsport residents speak English at home. 2.6% of Kingsport, TN residents are foreign-born (1.1% born in Asia, 0.8% born in Latin America, 0.4% born in Europe), which is 92.3% less than the foreign-born rate of 5.0% across the entire state of Tennessee.
Race distribution in Kingsport
2000 2022
4,505,930 79.2% White alone 928,204 16.3% Black alone 123,838 2.2% Hispanic 54,824 1.0% Two or more races 56,077 1.0% Asian alone 13,820 0.2% American Indian alone 4,780 0.08% Other race alone 1,810 0.03% Native Hawaiian and Other
5,070,026 71.9% White alone 1,089,738 15.5% Black alone 442,629 6.3% Hispanic 279,381 4.0% Two or more races 131,817 1.9% Asian alone 26,972 0.4% Other race alone 6,387 0.09% American Indian alone 4,389 0.06% Native Hawaiian and Other
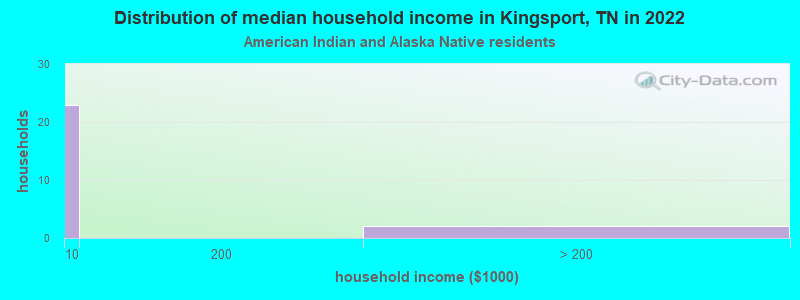
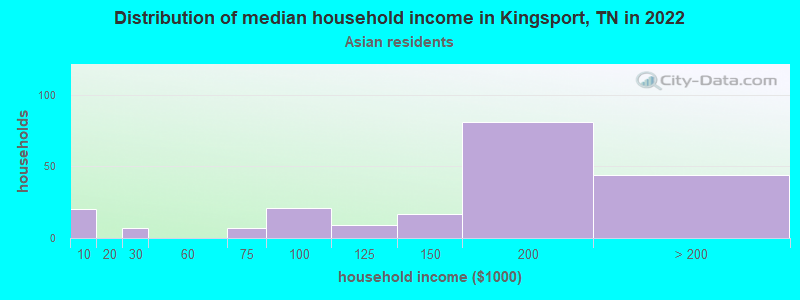
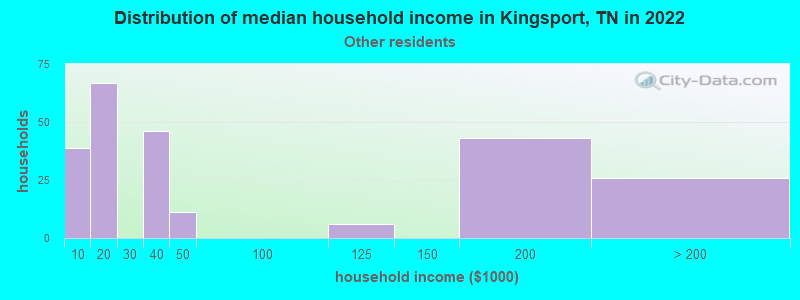
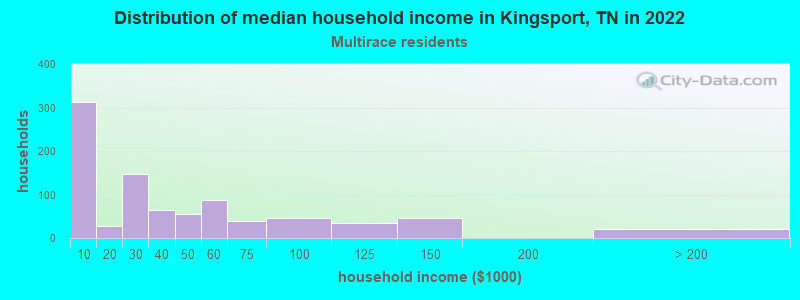
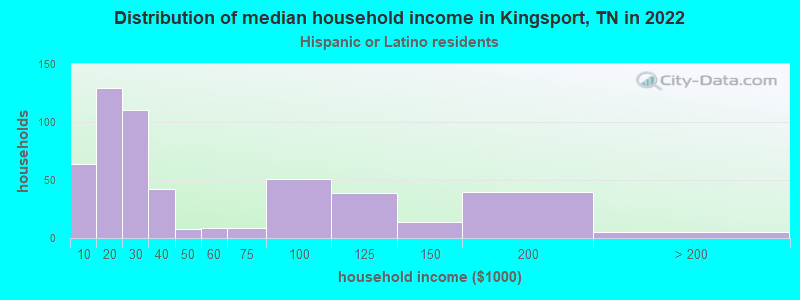
Income and house value in Kingsport Median household income in 2022 $49,010 White non-Hispanic householders$10,277 Black householders$158,915 Asian householders$23,575 Hispanic or Latino race householdersMedian 2022 house value $225,770 White Non-Hispanic householders$164,571 Black or African American householders$150,685 American Indian or Alaska Native householders $482,141 Asian householders$321,427 Some other race householders$291,342 Two or more races householders$253,028 Hispanic or Latino householders
Median age by race in Kingsport
46.4 Median age for White residents44.4 49.3 57.5 Median age for Black or African American residents57.7 55.5 21.7 Median age for American Indian / Alaska Native residents9.2 41.4 33.5 Median age for Asian residents32.0 39.2 -666,666,666.0 Median age for Native Hawaiian / Pacific Islander residents-666,666,666.0 -666,666,666.0 26.3 Median age for Other race residents26.8 24.3 24.1 Median age for Two or more races residents15.2 34.9 46.5 Median age for White alone residents44.2 49.5 23.9 Median age for Hispanic or Latino residents23.3 25.1
Owner/renter occupied households by race in Kingsport
House owners and renters - White residents 15,068 64.2% Owner occupied8,404 35.8% Renter occupiedHouse owners and renters - Black or African American residents 160 25.2% Owner occupied476 74.8% Renter occupiedHouse owners and renters - American Indian / Alaska Native residents 2 11.1% Owner occupied16 88.9% Renter occupiedHouse owners and renters - Asian residents 177 78.8% Owner occupied48 21.2% Renter occupiedHouse owners and renters - Other race residents 72 32.0% Owner occupied154 68.0% Renter occupiedHouse owners and renters - Two or more races residents 269 25.6% Owner occupied783 74.4% Renter occupiedHouse owners and renters - White alone residents 14,988 64.4% Owner occupied8,277 35.6% Renter occupiedHouse owners and renters - Hispanic or Latino residents 169 34.7% Owner occupied318 65.3% Renter occupied
Language usage in Kingsport
English speakers - Total 97.3% of residents of Kingsport speak English at home.
1.3% of residents speak Spanish at home 260 36.8% Speak English very well446 63.2% Speak English less than very well1.4% of residents speak other language at home 577 76.2% Speak English very well180 23.8% Speak English less than very well
English speakers - Born in the United States 99.9% of residents of Kingsport speak English at home.
0.6% of residents speak Spanish at home 119 100.0% Speak English very well0.2% of residents speak other language at home 25 83.3% Speak English very well5 16.7% Speak English less than very well
English speakers - Native, born elsewhere 70.5% of residents of Kingsport speak English at home.
53.1% of residents speak Spanish at home 71 48.6% Speak English very well75 51.4% Speak English less than very well0.4% of residents speak other language at home 1 100.0% Speak English very well
English speakers - Foreign-born 36.6% of residents of Kingsport speak English at home.
25.9% of residents speak Spanish at home 128 30.4% Speak English very well293 69.6% Speak English less than very well32.8% of residents speak other language at home 345 64.6% Speak English very well189 35.4% Speak English less than very well
White (Caucasian) - Speak only English Native:
99.8% (47,261)Foreign-born:
72.3% (357)
White (Caucasian) - Speak another language Native:
0.3% (162)Foreign-born:
22.5% (111)
Black or African American - Speak only English Native:
99.4% (1,704)Foreign-born:
100.0% (11)
Asian - Speak only English Native:
29.8% (47)Foreign-born:
18.9% (100)
Asian - Speak another language Native:
71.8% (114)Foreign-born:
81.0% (426)
Other race - Speak only English Native:
68.8% (189)Foreign-born:
16.0% (47)
Other race - Speak another language Native:
33.0% (90)Foreign-born:
79.2% (234)
Two or more races - Speak another language Native:
8.2% (202)Foreign-born:
99.8% (315)
White alone - Speak only English Native:
99.8% (47,038)Foreign-born:
70.9% (330)
White alone - Speak another language Native:
0.3% (128)Foreign-born:
24.7% (115)
Hispanic or Latino - Speak only English Native:
76.8% (726)Foreign-born:
28.4% (156)
Hispanic or Latino - Speak another language Native:
23.1% (218)Foreign-born:
72.1% (396)
Foreign-born residents in Kingsport 1,460 residents are foreign born (1.1% Asia , 0.8% Latin America , 0.4% Europe ).
This city:
2.6%Tennessee:
5.4%
Marital status for residents in Kingsport Marital status - White (Caucasian) population 15 years and over
Males 28.4% Never married50.9% Now married1.9% Separated3.8% Widowed15.0% DivorcedFemales 24.5% Never married43.3% Now married2.2% Separated13.2% Widowed16.8% DivorcedWomen who gave birth in the past 12 months Now married:
49.7% (307)Unmarried:
50.3% (311)
Women who did not give birth in the past 12 months Now married:
42.9% (4,374)Unmarried:
57.1% (5,833)
Marital status - Black or African American population 15 years and over
Males 50.1% Never married25.4% Now married1.3% Separated2.5% Widowed20.7% DivorcedFemales 49.1% Never married19.1% Now married13.1% Separated8.2% Widowed10.5% DivorcedWomen who gave birth in the past 12 months Now married:
0.0% (0)Unmarried:
100.0% (14)
Women who did not give birth in the past 12 months Now married:
16.8% (53)Unmarried:
83.2% (265)
Marital status - American Indian / Alaska Native population 15 years and over
Males 0.0% Never married25.0% Now married0.0% Separated0.0% Widowed75.0% DivorcedFemales 94.1% Never married0.0% Now married0.0% Separated0.0% Widowed5.9% DivorcedWomen who did not give birth in the past 12 months Now married:
0.0% (0)Unmarried:
100.0% (19)
Marital status - Asian population 15 years and over
Males 38.4% Never married54.5% Now married0.0% Separated3.9% Widowed3.2% DivorcedFemales 23.3% Never married67.3% Now married0.0% Separated0.0% Widowed9.5% DivorcedWomen who gave birth in the past 12 months Now married:
100.0% (9)Unmarried:
0.0% (0)
Women who did not give birth in the past 12 months Now married:
36.2% (44)Unmarried:
63.8% (77)
Marital status - Other race population 15 years and over
Males 67.5% Never married20.6% Now married0.0% Separated0.0% Widowed11.8% DivorcedFemales 54.9% Never married45.1% Now married0.0% Separated0.0% Widowed0.0% DivorcedWomen who gave birth in the past 12 months Now married:
76.3% (35)Unmarried:
23.7% (11)
Women who did not give birth in the past 12 months Now married:
15.5% (19)Unmarried:
84.5% (104)
Marital status - Two or more races population 15 years and over
Males 64.4% Never married18.8% Now married4.9% Separated0.0% Widowed11.9% DivorcedFemales 33.8% Never married48.0% Now married2.7% Separated5.3% Widowed10.2% DivorcedWomen who gave birth in the past 12 months Now married:
84.5% (251)Unmarried:
15.5% (46)
Women who did not give birth in the past 12 months Now married:
35.4% (281)Unmarried:
64.6% (513)
Marital status - White alone, not Hispanic / Latino population 15 years and over
Males 28.4% Never married50.9% Now married1.9% Separated3.8% Widowed14.9% DivorcedFemales 24.3% Never married43.4% Now married2.1% Separated13.3% Widowed17.0% DivorcedWomen who gave birth in the past 12 months Now married:
49.7% (306)Unmarried:
50.3% (310)
Women who did not give birth in the past 12 months Now married:
42.9% (4,303)Unmarried:
57.1% (5,727)
Marital status - Hispanic or Latino population 15 years and over
Males 45.1% Never married30.6% Now married0.0% Separated1.8% Widowed22.4% DivorcedFemales 48.7% Never married39.0% Now married4.4% Separated2.3% Widowed5.6% DivorcedWomen who gave birth in the past 12 months Now married:
76.3% (32)Unmarried:
23.7% (10)
Women who did not give birth in the past 12 months Now married:
33.1% (181)Unmarried:
66.9% (366)
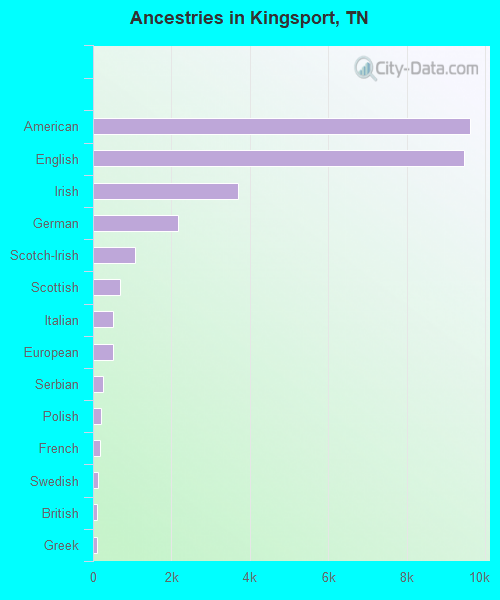
Ancestries in Kingsport
9,614 28.8% American9,470 28.3% English3,694 11.1% Irish2,165 6.5% German1,065 3.2% Scotch-Irish694 2.1% Scottish512 1.5% Italian503 1.5% European256 0.8% Serbian212 0.6% Polish183 0.5% French121 0.4% Swedish101 0.3% British97 0.3% Greek74 0.2% Yugoslavian72 0.2% Welsh65 0.2% Eastern European64 0.2% Scandinavian54 0.2% Northern European43 0.1% Norwegian39 0.1% French Canadian35 0.1% Dutch27 0.08% Egyptian26 0.08% Czech25 0.07% Moroccan25 0.07% Portuguese22 0.07% Swiss19 0.06% Israeli19 0.06% Iranian19 0.06% Jamaican12 0.04% Canadian12 0.04% Ukrainian11 0.03% Czechoslovakian10 0.03% Nigerian9 0.03% Croatian8 0.02% Finnish8 0.02% African7 0.02% Slovene6 0.02% Armenian
Geographical mobility in Kingsport Same house 1 year ago 44,855 90.8% White (Caucasian)1,456 81.4% Black or African American19 38.7% American Indian / Alaska Native555 74.3% Asian351 59.7% Other race2,629 82.6% Two or more races44,628 91.0% White alone, not Hispanic / Latino864 57.4% Hispanic or LatinoMoved within same county 1,637 3.3% White / Caucasian158 8.9% Black or African American27 55.1% American Indian / Alaska Native70 9.4% Asian56 9.5% Other race384 12.0% Two or more races1,647 3.4% White alone, not Hispanic / Latino275 18.3% Hispanic or LatinoMoved within same state 1,742 3.5% White / Caucasian54 3.0% Black or African American167 28.3% Other race138 4.3% Two or more races1,604 3.3% White alone, not Hispanic / Latino325 21.6% Hispanic or LatinoMoved from different state 741 1.5% White / Caucasian123 6.8% Black or African American35 4.6% Asian9 1.5% Other race29 0.9% Two or more races757 1.5% White alone, not Hispanic / Latino21 1.4% Hispanic or LatinoMoved from abroad 66 0.1% White101 13.6% Asian30 5.1% Other race43 0.1% White alone, not Hispanic / Latino84 5.6% Hispanic or Latino
Children Nativity (place of birth) in Kingsport
Children under 6 years - Living with two parents Both parents native 1,421 100.0% NativeBoth parents foreign-born 97 100.0% NativeOne native, one foreign-born parent 225 100.0% NativeChildren under 6 years - Living with one parent Native parent 1,387 100.0% NativeForeign-born parent 7 100.0% NativeChildren 6 to 17 years - Living with two parents Both parents native 3,575 99.2% Native30 0.8% Foreign-bornBoth parents foreign-born 81 62.4% Native49 37.6% Foreign-bornOne native, one foreign-born parent 196 100.0% NativeChildren 6 to 17 years - Living with one parent Native parent 2,875 100.0% NativeForeign-born parent 141 64.5% Native78 35.5% Foreign-born
Grandparents responsible for own grandchildren in Kingsport
Grandparents (30 to 59 years) White / Caucasian 151 41.0% Responsible for grandchildren217 59.0% Not responsible for grandchildrenBlack or African American 43 100.0% Responsible for grandchildrenTwo or more races 4 100.0% Not responsible for grandchildrenWhite alone, not Hispanic / Latino 151 41.0% Responsible for grandchildren217 59.0% Not responsible for grandchildrenGrandparents (60 years and over) White / Caucasian 352 47.5% Responsible for grandchildren390 52.5% Not responsible for grandchildrenBlack or African American 37 94.2% Responsible for grandchildren2 5.8% Not responsible for grandchildrenWhite alone, not Hispanic / Latino 352 48.9% Responsible for grandchildren368 51.1% Not responsible for grandchildren