Kernersville, NC (North Carolina) Houses and Residents
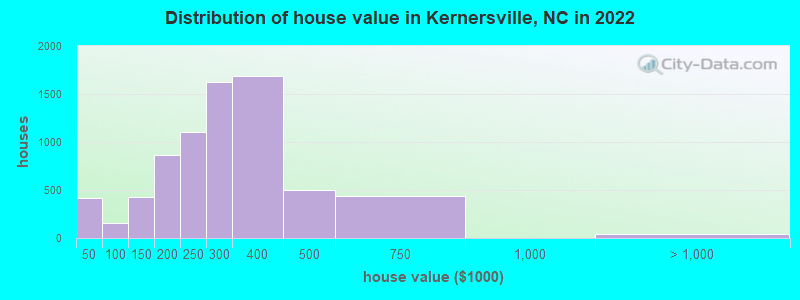
Estimated median house or condo value in 2022: $295,285 (it was $121,000 in 2000 )
Kernersville:
$295,285North Carolina:
$280,600
Lower value quartile - upper value quartile: $189,475 - $374,764Mean price in 2022: Detached houses: $305,669 Here:
$305,669State:
$375,326
Townhouses or other attached units: $413,856 Here:
$413,856State:
$317,935
In 5-or-more-unit structures: $130,661 Here:
$130,661State:
$329,290
Mobile homes: $42,924 Here:
$42,924State:
$124,933
Total population: 23,739 (Urban population: 16,595, Rural population: 68 (all nonfarm) )
Houses: 12,980 (12,273 occupied: 6,635 owner occupied, 5,602 renter occupied )
% of renters here:
46%State:
33%
Housing density: 1,073 houses/condos per square mile
Median price asked for vacant for-sale houses and condos in 2022: $282,552.
Median contract rent in 2022: $913 (lower quartile is $711, upper quartile is $1,363)
Median rent asked for vacant for-rent units in 2022: $1,414
Median gross rent in Kernersville, NC in 2022: $1,046
Housing units in Kernersville with a mortgage: 4,159 (448 second mortgage, 13 home equity loan, 424 both second mortgage and home equity loan )Houses without a mortgage: 83
Median household income for houses/condos with a mortgage: $105,915
Median household income for apartments without a mortgage: $63,010
Median monthly housing costs: $1,026
Data:
Median house or condo value ($)
Median house or condo value ($ change since 2000)
Median house or condo value ($) - White
Median house or condo value ($) - Black or African American
Median house or condo value ($) - Asian
Median house or condo value ($) - Hispanic or Latino
Median house or condo value ($) - American Indian and Alaska Native
Median house or condo value ($) - Multirace
Median house or condo value ($) - Other Race
Median price asked for mobile homes ($)
Household density (households per square mile)
Mean house or condo value by units in structure - 1, detached ($)
Mean house or condo value by units in structure - 1, attached ($)
Mean house or condo value by units in structure - 2 ($)
Mean house or condo value by units in structure by units in structure - 3 or 4 ($)
Mean house or condo value by units in structure - 5 or more ($)
Mean house or condo value by units in structure - Boat, RV, van, etc. ($)
Mean house or condo value by units in structure - Mobile home ($)
Median contract rent ($)
Median contract rent - Lower quartile ($)
Median contract rent - Upper quartile ($)
Median gross rent ($)
Urban houses (%)
Rural houses (%)
Houses occupied (%)
Houses occupied (% change since 2000)
Houses owner occupied (%)
Houses owner occupied (% change since 2000)
Houses renter occupied (%)
Houses renter occupied (% change since 2000)
Vacant housing units - For rent (%)
Vacant housing units - For rent (% change since 2000)
Vacant housing units - For sale only (%)
Vacant housing units - For sale only (% change since 2000)
Vacant housing units - Rented or sold, not occupied (%)
Vacant housing units - Rented or sold, not occupied (% change since 2000)
Vacant housing units - For seasonal, recreational, or occasional use (%)
Vacant housing units - For seasonal, recreational, or occasional use (% change since 2000)
Vacant housing units - For migrant workers (%)
Vacant housing units - For migrant workers (% change since 2000)
Vacant housing units - Other vacant (%)
Vacant housing units - Other vacant (% change since 2000)
Median monthly housing costs ($)
Median household income for houses/condos with a mortgage ($)
Median household income for houses/condos without a mortgage ($)
Median household income ($)
Median household income ($) - White
Median household income ($) - Black or African American
Median household income ($) - Asian
Median household income ($) - Hispanic or Latino
Median household income ($) - American Indian and Alaska Native
Median household income ($) - Multirace
Median household income ($) - Other Race
Mortgage status - with mortgage (%)
Mortgage status - with second mortgage (%)
Mortgage status - with home equity loan (%)
Mortgage status - with both second mortgage and home equity loan (%)
Mortgage status - without a mortgage (%)
Median year house/condo built
Median year apartment built
Household type by relationship - Male householder living alone (%)
Household type by relationship - Male householder not living alone (%)
Household type by relationship - Female householder living alone (%)
Household type by relationship - Female householder not living alone (%)
Household type by relationship - Opposite-Sex spouse (%)
Household type by relationship - Same-Sex spouse (%)
Household type by relationship - Opposite-Sex unmarried partner (%)
Household type by relationship - Same-Sex unmarried partner (%)
Household type by relationship - In group quarters (%)
Size of family households - 2-person household (%)
Size of family households - 3-person household (%)
Size of family households - 4-person household (%)
Size of family households - 5-person household (%)
Size of family households - 6-person household (%)
Size of family households - 7-or-more-person household (%)
Size of nonfamily households - 1-person household (%)
Size of nonfamily households - 2-person household (%)
Size of nonfamily households - 3-person household (%)
Size of nonfamily households - 4-person household (%)
Size of nonfamily households - 5-person household (%)
Size of nonfamily households - 6-person household (%)
Size of nonfamily households - 7-or-moreperson household (%)
Year house built - Built 2010 or later (%)
Year house built - Built 2000 to 2009 (%)
Year house built - Built 1990 to 1999 (%)
Year house built - Built 1980 to 1989 (%)
Year house built - Built 1970 to 1979 (%)
Year house built - Built 1960 to 1969 (%)
Year house built - Built 1950 to 1959 (%)
Year house built - Built 1940 to 1949 (%)
Year house built - Built 1939 or earlier (%)
Median number of rooms in houses and condos
Median number of rooms in apartments
Median number of bedrooms in owner occupied houses
Mean number of bedrooms in owner occupied houses
Median number of bedrooms in renter occupied houses
Mean number of bedrooms in renter occupied houses
Median number of vehichles in owner occupied houses
Mean number of vehichles in owner occupied houses
Median number of vehichles in renter occupied houses
Mean number of vehichles in renter occupied houses
Rooms in owner-occupied houses - 1 room (%)
Rooms in owner-occupied houses - 2 rooms (%)
Rooms in owner-occupied houses - 3 rooms (%)
Rooms in owner-occupied houses - 4 rooms (%)
Rooms in owner-occupied houses - 5 rooms (%)
Rooms in owner-occupied houses - 6 rooms (%)
Rooms in owner-occupied houses - 7 rooms (%)
Rooms in owner-occupied houses - 8 rooms (%)
Rooms in owner-occupied houses - 9+ rooms (%)
Rooms in renter-occupied houses - 1 room (%)
Rooms in renter-occupied houses - 2 rooms (%)
Rooms in renter-occupied houses - 3 rooms (%)
Rooms in renter-occupied houses - 4 rooms (%)
Rooms in renter-occupied houses - 5 rooms (%)
Rooms in renter-occupied houses - 6 rooms (%)
Rooms in renter-occupied houses - 7 rooms (%)
Rooms in renter-occupied houses - 8 rooms (%)
Rooms in renter-occupied houses - 9+ rooms (%)
Bedrooms in owner-occupied houses - no bedrooms (%)
Bedrooms in owner-occupied houses - 1 bedroom (%)
Bedrooms in owner-occupied houses - 2 bedrooms (%)
Bedrooms in owner-occupied houses - 3 bedrooms (%)
Bedrooms in owner-occupied houses - 4 bedrooms (%)
Bedrooms in owner-occupied houses - 5+ bedrooms (%)
Bedrooms in renter-occupied houses - no bedrooms (%)
Bedrooms in renter-occupied houses - 1 bedroom (%)
Bedrooms in renter-occupied houses - 2 bedrooms (%)
Bedrooms in renter-occupied houses - 3 bedrooms (%)
Bedrooms in renter-occupied houses - 4 bedrooms (%)
Bedrooms in renter-occupied houses - 5+ bedrooms (%)
Vehicles available in owner-occupied houses - no vehicle available (%)
Vehicles available in owner-occupied houses - 1 vehicle available(%)
Vehicles available in owner-occupied houses - 2 Vehicles available (%)
Vehicles available in owner-occupied houses - 3 Vehicles available (%)
Vehicles available in owner-occupied houses - 4 Vehicles available (%)
Vehicles available in owner-occupied houses - 5+ Vehicles available (%)
Vehicles available in renter-occupied houses - no vehicle available (%)
Vehicles available in renter-occupied houses - 1 vehicle available (%)
Vehicles available in renter-occupied houses - 2 Vehicles available (%)
Vehicles available in renter-occupied houses - 3 Vehicles available (%)
Vehicles available in renter-occupied houses - 4 Vehicles available (%)
Vehicles available in renter-occupied houses - 5+ Vehicles available (%)
Housing units in structures - 1, detached (%)
Housing units in structures - 1, attached (%)
Housing units in structures - 2 (%)
Housing units in structures - 3 or 4 (%)
Housing units in structures - 5 to 9 (%)
Housing units in structures - 10 to 19 (%)
Housing units in structures - 20 to 49 (%)
Housing units in structures - 50 or more (%)
Housing units in structures - Mobile home (%)
Housing units in structures - Boat, RV, van, etc. (%)
Housing units in structures - Owners - 1, detached (%)
Housing units in structures - Owners - 1, attached (%)
Housing units in structures - Owners - 2 (%)
Housing units in structures - Owners - 3 or 4 (%)
Housing units in structures - Owners - 5 to 9 (%)
Housing units in structures - Owners - 10 to 19 (%)
Housing units in structures - Owners - 20 to 49 (%)
Housing units in structures - Owners - 50 or more (%)
Housing units in structures - Owners - Mobile home (%)
Housing units in structures - Owners - Boat, RV, van, etc. (%)
Housing units in structures - Renters - 1, detached (%)
Housing units in structures - Renters - 1, attached (%)
Housing units in structures - Renters - 2 (%)
Housing units in structures - Renters - 3 or 4 (%)
Housing units in structures - Renters - 5 to 9 (%)
Housing units in structures - Renters - 10 to 19 (%)
Housing units in structures - Renters - 20 to 49 (%)
Housing units in structures - Renters - 50 or more (%)
Housing units in structures - Renters - Mobile home (%)
Housing units in structures - Renters - Boat, RV, van, etc. (%)
House/condo owner moved in on average (years ago)
Renter moved in on average (years ago)
Year householder moved into unit - Moved in 1999 to March 2000 (%)
Year householder moved into unit - Moved in 1999 to March 2000 (%) - White
Year householder moved into unit - Moved in 1999 to March 2000 (%) - Black or African American
Year householder moved into unit - Moved in 1999 to March 2000 (%) - Asian
Year householder moved into unit - Moved in 1999 to March 2000 (%) - Hispanic or Latino
Year householder moved into unit - Moved in 1999 to March 2000 (%) - American Indian and Alaska Native
Year householder moved into unit - Moved in 1999 to March 2000 (%) - Multirace
Year householder moved into unit - Moved in 1999 to March 2000 (%) - Other Race
Year householder moved into unit - Moved in 1995 to 1998 (%)
Year householder moved into unit - Moved in 1995 to 1998 (%) - White
Year householder moved into unit - Moved in 1995 to 1998 (%) - Black or African American
Year householder moved into unit - Moved in 1995 to 1998 (%) - Asian
Year householder moved into unit - Moved in 1995 to 1998 (%) - Hispanic or Latino
Year householder moved into unit - Moved in 1995 to 1998 (%) - American Indian and Alaska Native
Year householder moved into unit - Moved in 1995 to 1998 (%) - Multirace
Year householder moved into unit - Moved in 1995 to 1998 (%) - Other Race
Year householder moved into unit - Moved in 1990 to 1994 (%)
Year householder moved into unit - Moved in 1990 to 1994 (%) - White
Year householder moved into unit - Moved in 1990 to 1994 (%) - Black or African American
Year householder moved into unit - Moved in 1990 to 1994 (%) - Asian
Year householder moved into unit - Moved in 1990 to 1994 (%) - Hispanic or Latino
Year householder moved into unit - Moved in 1990 to 1994 (%) - American Indian and Alaska Native
Year householder moved into unit - Moved in 1990 to 1994 (%) - Multirace
Year householder moved into unit - Moved in 1990 to 1994 (%) - Other Race
Year householder moved into unit - Moved in 1980 to 1989 (%)
Year householder moved into unit - Moved in 1980 to 1989 (%) - White
Year householder moved into unit - Moved in 1980 to 1989 (%) - Black or African American
Year householder moved into unit - Moved in 1980 to 1989 (%) - Asian
Year householder moved into unit - Moved in 1980 to 1989 (%) - Hispanic or Latino
Year householder moved into unit - Moved in 1980 to 1989 (%) - American Indian and Alaska Native
Year householder moved into unit - Moved in 1980 to 1989 (%) - Multirace
Year householder moved into unit - Moved in 1980 to 1989 (%) - Other Race
Year householder moved into unit - Moved in 1970 to 1979 (%)
Year householder moved into unit - Moved in 1970 to 1979 (%) - White
Year householder moved into unit - Moved in 1970 to 1979 (%) - Black or African American
Year householder moved into unit - Moved in 1970 to 1979 (%) - Asian
Year householder moved into unit - Moved in 1970 to 1979 (%) - Hispanic or Latino
Year householder moved into unit - Moved in 1970 to 1979 (%) - American Indian and Alaska Native
Year householder moved into unit - Moved in 1970 to 1979 (%) - Multirace
Year householder moved into unit - Moved in 1970 to 1979 (%) - Other Race
Year householder moved into unit - Moved in 1969 or earlier (%)
Year householder moved into unit - Moved in 1969 or earlier (%) - White
Year householder moved into unit - Moved in 1969 or earlier (%) - Black or African American
Year householder moved into unit - Moved in 1969 or earlier (%) - Asian
Year householder moved into unit - Moved in 1969 or earlier (%) - Hispanic or Latino
Year householder moved into unit - Moved in 1969 or earlier (%) - American Indian and Alaska Native
Year householder moved into unit - Moved in 1969 or earlier (%) - Multirace
Year householder moved into unit - Moved in 1969 or earlier (%) - Other Race
Housing units lacking complete plumbing facilities (%)
Housing units lacking complete kitchen facilities (%)
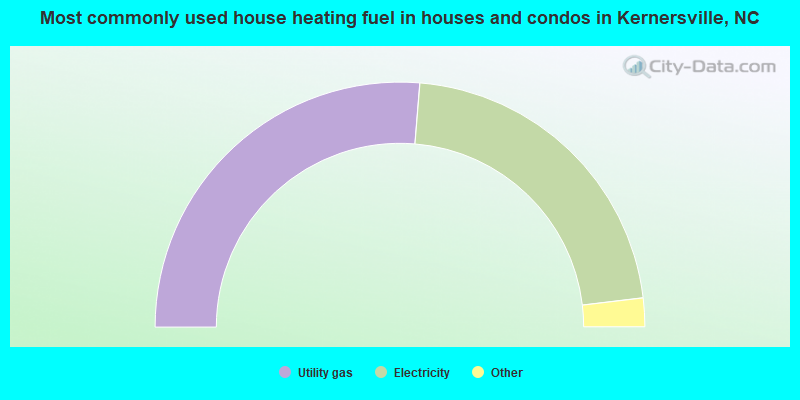
House heating fuel used in houses and condos - Utility gas (%)
House heating fuel used in houses and condos - Bottled, tank, or LP gas (%)
House heating fuel used in houses and condos - Electricity (%)
House heating fuel used in houses and condos - Fuel oil, kerosene, etc. (%)
House heating fuel used in houses and condos - Coal or coke (%)
House heating fuel used in houses and condos - Wood (%)
House heating fuel used in houses and condos - Solar energy (%)
House heating fuel used in houses and condos - Other fuel (%)
House heating fuel used in houses and condos - No fuel used (%)
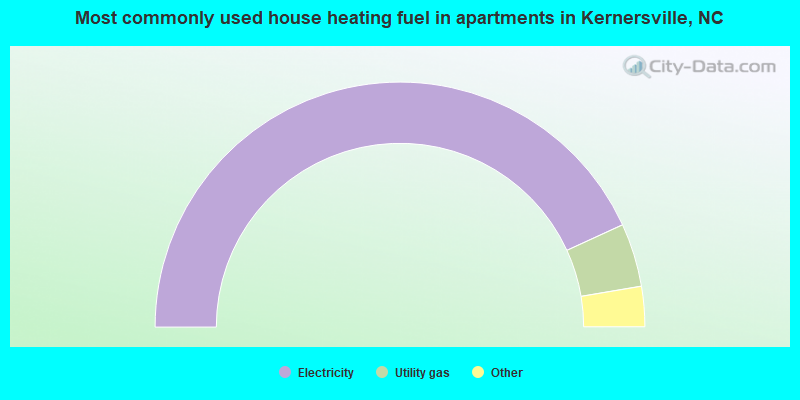
House heating fuel used in apartments - Utility gas (%)
House heating fuel used in apartments - Bottled, tank, or LP gas (%)
House heating fuel used in apartments - Electricity (%)
House heating fuel used in apartments - Fuel oil, kerosene, etc. (%)
House heating fuel used in apartments - Coal or coke (%)
House heating fuel used in apartments - Wood (%)
House heating fuel used in apartments - Solar energy (%)
House heating fuel used in apartments - Other fuel (%)
House heating fuel used in apartments - No fuel used (%)
Latest news about housing in Kernersville, NC collected exclusively by city-data.com from local newspapers, TV, and radio stations
Median year house/condo built: 1995Median year apartment built: 1992Household type by relationship:
Households: 27,560
Male householders: 5,671 (1,772 living alone ), Female householders: 6,449 (2,877 living alone )5,182 spouses (5,182 opposite-sex spouses ), 583 unmarried partners , (580 opposite-sex unmarried partners ), 7,562 children (6,550 natural , 440 adopted , 571 stepchildren ), 261 grandchildren , 230 brothers or sisters , 154 parents , 34 foster children , 499 other relatives , 727 non-relatives In group quarters: 203
Size of family households: 3,665 2-persons , 1,385 3-persons , 1,468 4-persons , 392 5-persons , 41 6-persons , 92 7-or-more-persons .
Size of nonfamily households: 4,511 1-person , 507 2-persons , 127 3-persons , 73 4-persons .
3,239 married couples with children. single-parent households (352 men , 1,529 women ).
89.5% of residents of Kernersville speak English at home. of residents speak Spanish at home (54% speak English very well , 29% speak English well , 13% speak English not well , 4% don't speak English at all ).of residents speak other Indo-European language at home (80% speak English very well , 20% speak English well ).of residents speak Asian or Pacific Island language at home (85% speak English very well , 11% speak English well , 4% speak English not well ).of residents speak other language at home (100% speak English very well ).
Foreign born population: 1,775 (6.4%)of them are naturalized citizens )
Median number of rooms in houses and condos:
Median number of rooms in apartments
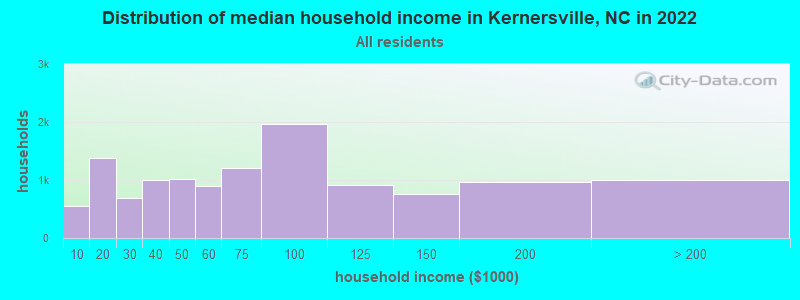
Kernersville, NC household income distribution 549 Less than $10,0001,376 $10,000 to $19,999692 $20,000 to $29,999994 $30,000 to $39,9991,025 $40,000 to $49,999897 $50,000 to $59,9991,213 $60,000 to $74,9991,967 $75,000 to $99,999917 $100,000 to $124,999755 $125,000 to $149,999973 $150,000 to $199,999999 $200,000 or more
Home value of owner - occupied houses in 2022 in Kernersville, NC 178 Less than $10,00083 $10,000 to $14,99949 $15,000 to $19,99952 $20,000 to $24,99923 $30,000 to $34,99932 $35,000 to $39,99935 $50,000 to $59,99927 $70,000 to $79,99963 $80,000 to $89,99926 $90,000 to $99,999145 $100,000 to $124,999286 $125,000 to $149,999653 $150,000 to $174,999215 $175,000 to $199,9991,108 $200,000 to $249,9991,626 $250,000 to $299,9991,683 $300,000 to $399,999495 $400,000 to $499,999438 $500,000 to $749,99921 $1,000,000 to $1,499,99916 $2,000,000 or moreRent paid by renters in 2022 in Kernersville, NC 25 $100 to $14973 $150 to $199102 $200 to $24945 $250 to $29944 $300 to $34923 $350 to $39930 $400 to $44977 $450 to $499185 $500 to $549132 $550 to $599291 $600 to $649314 $650 to $699164 $700 to $749479 $750 to $799634 $800 to $899380 $900 to $999735 $1,000 to $1,2491,112 $1,250 to $1,499483 $1,500 to $1,99937 $2,000 to $2,499241 No cash rent
Percentage of workers working in this county: 57.1%Number of people working at home: 1,592 (11.2% of all workers )
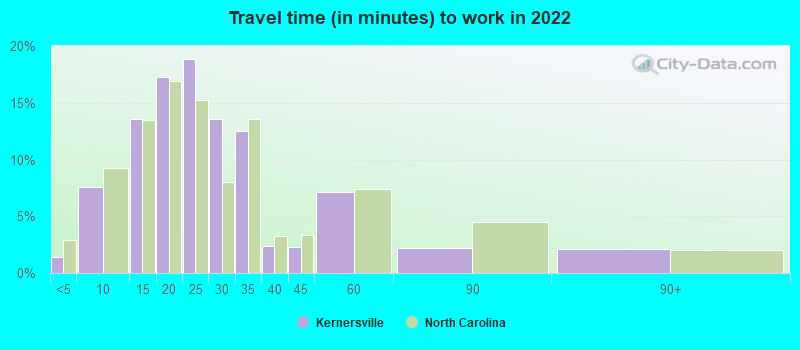
Travel time to work (commute)
Less than 5 minutes: 1465 to 9 minutes: 1,13710 to 14 minutes: 1,53615 to 19 minutes: 2,13620 to 24 minutes: 2,43825 to 29 minutes: 1,93330 to 34 minutes: 2,08735 to 39 minutes: 25240 to 44 minutes: 26245 to 59 minutes: 13160 to 89 minutes: 35790 or more minutes: 325
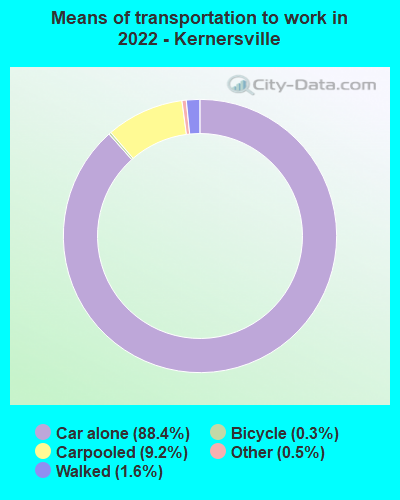
Means of transportation to work:
Drove a car alone: 13,676 (79.3%)Carpooled: 1,439 (8.3%)Bus : 1 (0.0%)Taxi: 52 (0.3%)Bicycle: 55 (0.3%)Walked: 203 (1.2%)Worked at home: 1,592 (9.2%)
Unemployment by race in 2022
Unemployment rate for White non-Hispanic residents 2.0% Males1.6% FemalesUnemployment rate for Black residents 3.2% Males6.7% FemalesUnemployment rate for American Indian and Alaska Native residents 63.8% FemalesUnemployment rate for other race residents 3.9% MalesUnemployment rate for two or more race residents 13.5% FemalesUnemployment rate for Hispanic or Latino residents 3.7% Males4.3% Females
Year of entry for the foreign-born population in Kernersville, North Carolina
634 2010 or later 605 2000 to 2009 194 1990 to 1999 340 1980 to 1989 58 1970 to 1979 87 Before 1970
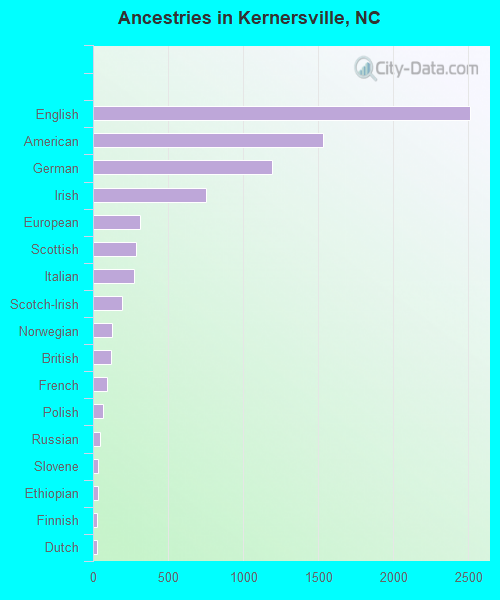
First ancestries reported:
English: 2,511 (16.7%)
American: 1,530 (10.2%)
German: 1,194 (8.0%)
Irish: 753 (5.0%)
European: 314 (2.1%)
Scottish: 283 (1.9%)
Italian: 270 (1.8%)
Scotch-Irish: 194 (1.3%)
Norwegian: 125 (0.8%)
British: 120 (0.8%)
French: 91 (0.6%)
Polish: 67 (0.4%)
Russian: 44 (0.3%)
Slovene: 36 (0.2%)
Ethiopian: 34 (0.2%)
Finnish: 25 (0.2%)
Dutch: 24 (0.2%)
Danish: 22 (0.1%)
French Canadian: 22 (0.1%)
Swedish: 21 (0.1%)
Scandinavian: 17 (0.1%)
African: 14 (0.09%)
Jamaican: 12 (0.08%)
Greek: 10 (0.07%)
Palestinian: 9 (0.06%)
Cajun: 9 (0.06%)
Welsh: 8 (0.05%)
Austrian: 7 (0.05%)
Iranian: 7 (0.05%)
Canadian: 3 (0.02%) Most common places of birth for foreign-born residents (%): El Salvador Kernersville:
20.8% (374)North Carolina:
3.8% (33,379)
Mexico Kernersville:
15.8% (284)North Carolina:
24.7% (214,776)
Burma (Myanmar) Kernersville:
8.6% (155)North Carolina:
0.5% (4,516)
England Kernersville:
7.0% (126)North Carolina:
1.2% (10,140)
Korea Kernersville:
5.0% (90)North Carolina:
1.8% (15,988)
India Kernersville:
4.6% (83)North Carolina:
9.3% (80,594)
Germany Kernersville:
4.5% (80)North Carolina:
1.8% (15,534)
Russia Kernersville:
3.2% (57)North Carolina:
0.9% (8,067)
Guatemala Kernersville:
2.6% (47)North Carolina:
2.6% (22,964)
Colombia Kernersville:
2.5% (45)North Carolina:
2.1% (18,275)
Cuba Kernersville:
2.3% (42)North Carolina:
1.0% (9,005)
Spain Kernersville:
2.2% (40)North Carolina:
0.3% (2,183)
Belarus Kernersville:
1.9% (35)North Carolina:
0.1% (1,097)
Honduras Kernersville:
1.8% (33)North Carolina:
4.7% (40,707)
United Kingdom, excluding England and Scotland Kernersville:
1.8% (32)North Carolina:
1.1% (9,831)
Place of birth for U.S.-born residents:
This state: 14,880Other state: 10,335Northeast: 2,698Midwest: 3,042South: 3,656West: 1,003 85.6% of Kernersville residents lived in the same house 1 years ago.
Out of people who lived in different houses, 26.3% lived in this county.
Out of people who lived in different counties, 59.2% lived in North Carolina.
Kernersville:
85.6%State average:
87.3%
Education attainment for males 25 years and older:
No schooling: 114Nursery to 4th grade: 05th and 6th grade: 127th and 8th grade: 889th grade: 19910th grade: 13611th grade: 15512th grade, no diploma: 31High school graduate (or equivalency): 2,092Less than 1 year of college: 566Some college more than 1 year, no degree: 1,065Associate degree: 870Bachelor's degree: 2,378Master's degree: 1,037Professional school degree: 159Doctorate degree: 307
Education attainment for females 25 years and older:
No schooling: 146Nursery to 4th grade: 05th and 6th grade: 1277th and 8th grade: 839th grade: 11010th grade: 22211th grade: 7912th grade, no diploma: 53High school graduate (or equivalency): 2,238Less than 1 year of college: 968Some college more than 1 year, no degree: 1,141Associate degree: 1,013Bachelor's degree: 2,306Master's degree: 1,004Professional school degree: 136Doctorate degree: 289
Housing units in structures:
One, detached: 6,546One, attached: 836Two: 3753 or 4: 5625 to 9: 1,04110 to 19: 1,72320 to 49: 77650 or more: 593Mobile homes: 486Boats, RVs, vans, etc.: 37Median worth of mobile homes: $10,025
Housing units lacking complete plumbing facilities in 2022: 0.7%Housing units lacking complete kitchen facilities in 2022: 0.8%House/condo owner moved in on average 10 years ago
Renter moved in on average 2 years ago
Private vs. public school enrollment:
Students in private schools in grades 1 to 8 (elementary and middle school): 304 Here:
12.8%North Carolina:
13.8%
Students in private schools in grades 9 to 12 (high school): 152 Here:
9.2%North Carolina:
11.9%
Students in private undergraduate colleges: 367 Here:
30.0%North Carolina:
19.3%