Races in Kernersville, North Carolina (NC) Detailed Stats
Data:
Races - White alone (%)
Races - White alone (% change since 2000)
Races - Black alone (%)
Races - Black alone (% change since 2000)
Races - American Indian alone (%)
Races - American Indian alone (% change since 2000)
Races - Asian alone (%)
Races - Asian alone (% change since 2000)
Races - Hispanic (%)
Races - Hispanic (% change since 2000)
Races - Native Hawaiian and Other Pacific Islander alone (%)
Races - Native Hawaiian and Other Pacific Islander alone (% change since 2000)
Races - Two or more races(%)
Races - Two or more races(% change since 2000)
Races - Other race alone (%)
Races - Other race alone (% change since 2000)
Racial diversity
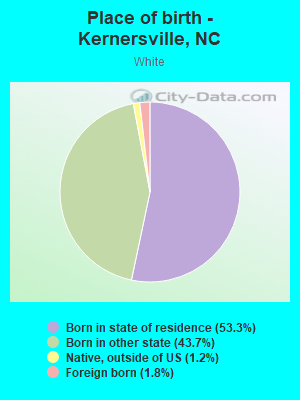
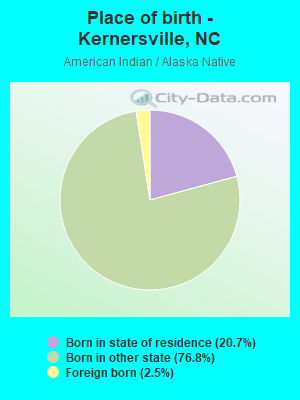
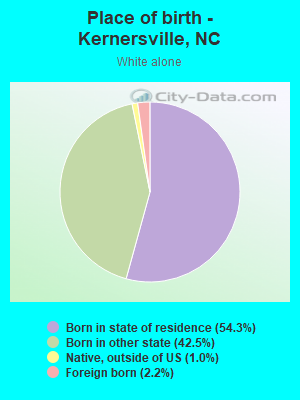
Place of birth - Born in state of residence (%)
Place of birth - Born in state of residence (%) - White
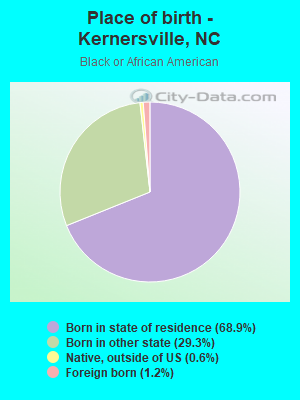
Place of birth - Born in state of residence (%) - Black or African American
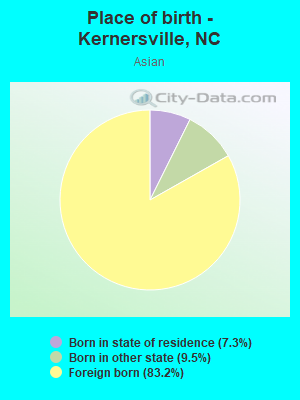
Place of birth - Born in state of residence (%) - Asian
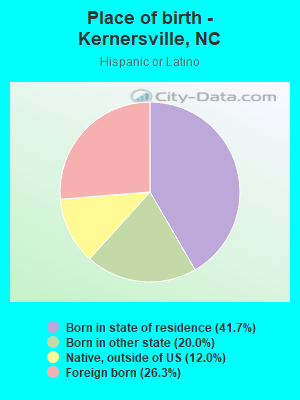
Place of birth - Born in state of residence (%) - Hispanic or Latino
Place of birth - Born in state of residence (%) - American Indian and Alaska Native
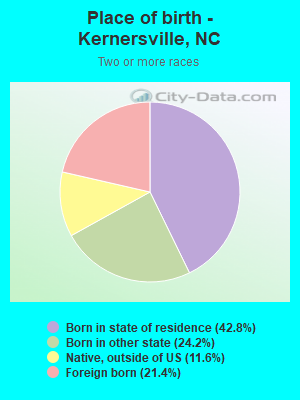
Place of birth - Born in state of residence (%) - Multirace
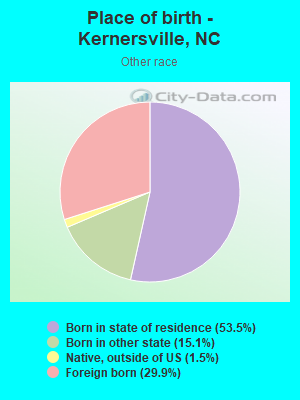
Place of birth - Born in state of residence (%) - Other Race
Place of birth - Born in other state (%)
Place of birth - Born in other state (%) - White
Place of birth - Born in other state (%) - Black or African American
Place of birth - Born in other state (%) - Asian
Place of birth - Born in other state (%) - Hispanic or Latino
Place of birth - Born in other state (%) - American Indian and Alaska Native
Place of birth - Born in other state (%) - Multirace
Place of birth - Born in other state (%) - Other Race
Place of birth - Native, outside of US (%)
Place of birth - Native, outside of US (%) - White
Place of birth - Native, outside of US (%) - Black or African American
Place of birth - Native, outside of US (%) - Asian
Place of birth - Native, outside of US (%) - Hispanic or Latino
Place of birth - Native, outside of US (%) - American Indian and Alaska Native
Place of birth - Native, outside of US (%) - Multirace
Place of birth - Native, outside of US (%) - Other Race
Place of birth - Foreign born (%)
Place of birth - Foreign born (%) - White
Place of birth - Foreign born (%) - Black or African American
Place of birth - Foreign born (%) - Asian
Place of birth - Foreign born (%) - Hispanic or Latino
Place of birth - Foreign born (%) - American Indian and Alaska Native
Place of birth - Foreign born (%) - Multirace
Place of birth - Foreign born (%) - Other Race
Residents speaking English at home (%)
Residents speaking English at home - Born in the United States (%)
Residents speaking English at home - Native, born elsewhere (%)
Residents speaking English at home - Foreign born (%)
Residents speaking Spanish at home (%)
Residents speaking Spanish at home - Born in the United States (%)
Residents speaking Spanish at home - Native, born elsewhere (%)
Residents speaking Spanish at home - Foreign born (%)
Residents speaking other language at home (%)
Residents speaking other language at home - Born in the United States (%)
Residents speaking other language at home - Native, born elsewhere (%)
Residents speaking other language at home - Foreign born (%)
Marital status - Never married (%)
Marital status - Now married (%)
Marital status - Separated (%)
Marital status - Widowed (%)
Marital status - Divorced (%)
Ancestries Reported - Arab (%)
Ancestries Reported - Czech (%)
Ancestries Reported - Danish (%)
Ancestries Reported - Dutch (%)
Ancestries Reported - English (%)
Ancestries Reported - French (%)
Ancestries Reported - French Canadian (%)
Ancestries Reported - German (%)
Ancestries Reported - Greek (%)
Ancestries Reported - Hungarian (%)
Ancestries Reported - Irish (%)
Ancestries Reported - Italian (%)
Ancestries Reported - Lithuanian (%)
Ancestries Reported - Norwegian (%)
Ancestries Reported - Polish (%)
Ancestries Reported - Portuguese (%)
Ancestries Reported - Russian (%)
Ancestries Reported - Scotch-Irish (%)
Ancestries Reported - Scottish (%)
Ancestries Reported - Slovak (%)
Ancestries Reported - Subsaharan African (%)
Ancestries Reported - Swedish (%)
Ancestries Reported - Swiss (%)
Ancestries Reported - Ukrainian (%)
Ancestries Reported - United States (%)
Ancestries Reported - Welsh (%)
Ancestries Reported - West Indian (%)
Ancestries Reported - Other (%)
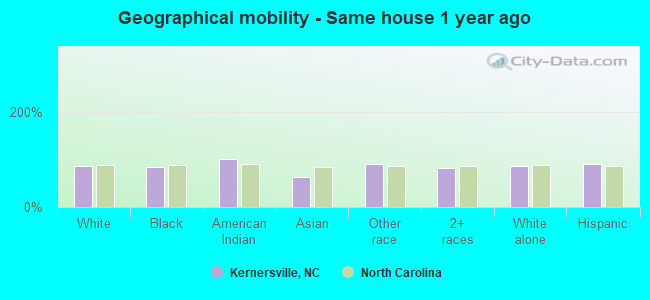
Geographical mobility - Same house 1 year ago (%)
Geographical mobility - Same house 1 year ago (%) - White
Geographical mobility - Same house 1 year ago (%) - Black or African American
Geographical mobility - Same house 1 year ago (%) - Asian
Geographical mobility - Same house 1 year ago (%) - Hispanic or Latino
Geographical mobility - Same house 1 year ago (%) - American Indian and Alaska Native
Geographical mobility - Same house 1 year ago (%) - Multirace
Geographical mobility - Same house 1 year ago (%) - Other Race
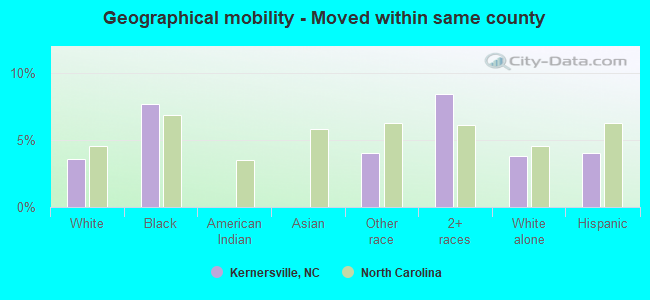
Geographical mobility - Moved within same county (%)
Geographical mobility - Moved within same county (%) - White
Geographical mobility - Moved within same county (%) - Black or African American
Geographical mobility - Moved within same county (%) - Asian
Geographical mobility - Moved within same county (%) - Hispanic or Latino
Geographical mobility - Moved within same county (%) - American Indian and Alaska Native
Geographical mobility - Moved within same county (%) - Multirace
Geographical mobility - Moved within same county (%) - Other Race
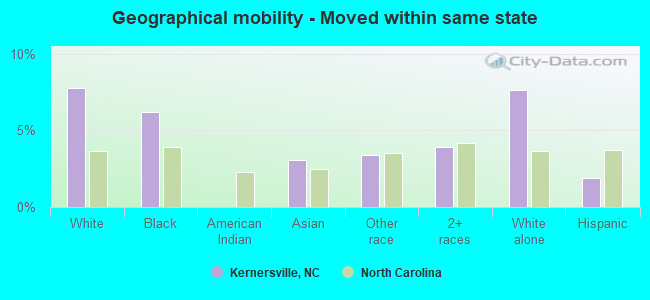
Geographical mobility - Moved from different county within same state (%)
Geographical mobility - Moved from different county within same state (%) - White
Geographical mobility - Moved from different county within same state (%) - Black or African American
Geographical mobility - Moved from different county within same state (%) - Asian
Geographical mobility - Moved from different county within same state (%) - Hispanic or Latino
Geographical mobility - Moved from different county within same state (%) - American Indian and Alaska Native
Geographical mobility - Moved from different county within same state (%) - Multirace
Geographical mobility - Moved from different county within same state (%) - Other Race
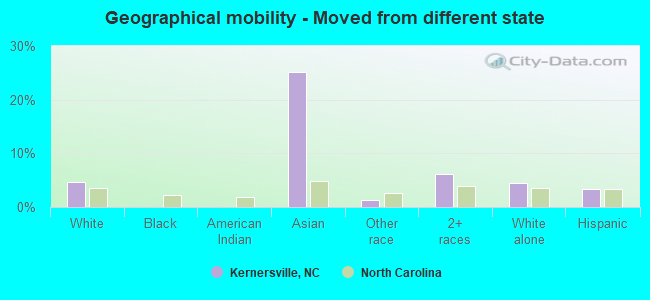
Geographical mobility - Moved from different state (%)
Geographical mobility - Moved from different state (%) - White
Geographical mobility - Moved from different state (%) - Black or African American
Geographical mobility - Moved from different state (%) - Asian
Geographical mobility - Moved from different state (%) - Hispanic or Latino
Geographical mobility - Moved from different state (%) - American Indian and Alaska Native
Geographical mobility - Moved from different state (%) - Multirace
Geographical mobility - Moved from different state (%) - Other Race
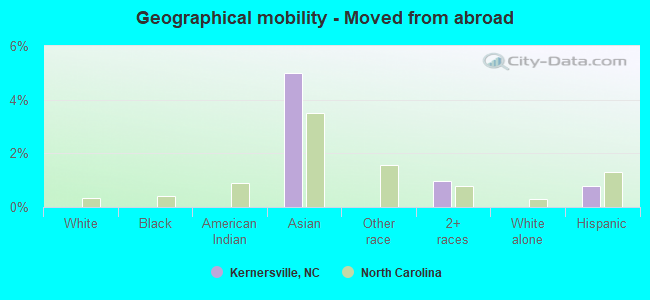
Geographical mobility - Moved from abroad (%)
Geographical mobility - Moved from abroad (%) - White
Geographical mobility - Moved from abroad (%) - Black or African American
Geographical mobility - Moved from abroad (%) - Asian
Geographical mobility - Moved from abroad (%) - Hispanic or Latino
Geographical mobility - Moved from abroad (%) - American Indian and Alaska Native
Geographical mobility - Moved from abroad (%) - Multirace
Geographical mobility - Moved from abroad (%) - Other Race
Place of birth for the foreign-born population - Ireland (%)
Place of birth for the foreign-born population - Denmark (%)
Place of birth for the foreign-born population - Norway (%)
Place of birth for the foreign-born population - Sweden (%)
Place of birth for the foreign-born population - United Kingdom (%)
Place of birth for the foreign-born population - England (%)
Place of birth for the foreign-born population - Scotland (%)
Place of birth for the foreign-born population - Other Northern Europe (%)
Place of birth for the foreign-born population - Austria (%)
Place of birth for the foreign-born population - Belgium (%)
Place of birth for the foreign-born population - France (%)
Place of birth for the foreign-born population - Germany (%)
Place of birth for the foreign-born population - Netherlands (%)
Place of birth for the foreign-born population - Switzerland (%)
Place of birth for the foreign-born population - Other Western Europe (%)
Place of birth for the foreign-born population - Greece (%)
Place of birth for the foreign-born population - Italy (%)
Place of birth for the foreign-born population - Portugal (%)
Place of birth for the foreign-born population - Spain (%)
Place of birth for the foreign-born population - Other Southern Europe (%)
Place of birth for the foreign-born population - Albania (%)
Place of birth for the foreign-born population - Belarus (%)
Place of birth for the foreign-born population - Bosnia and Herzegovina (%)
Place of birth for the foreign-born population - Bulgaria (%)
Place of birth for the foreign-born population - Croatia (%)
Place of birth for the foreign-born population - Czechoslovakia (%)
Place of birth for the foreign-born population - Hungary (%)
Place of birth for the foreign-born population - Latvia (%)
Place of birth for the foreign-born population - Lithuania (%)
Place of birth for the foreign-born population - North Macedonia (Macedonia) (%)
Place of birth for the foreign-born population - Moldova (%)
Place of birth for the foreign-born population - Poland (%)
Place of birth for the foreign-born population - Romania (%)
Place of birth for the foreign-born population - Russia (%)
Place of birth for the foreign-born population - Serbia (%)
Place of birth for the foreign-born population - Ukraine (%)
Place of birth for the foreign-born population - Other Eastern Europe (%)
Place of birth for the foreign-born population - China (%)
Place of birth for the foreign-born population - Hong Kong (%)
Place of birth for the foreign-born population - Taiwan (%)
Place of birth for the foreign-born population - Japan (%)
Place of birth for the foreign-born population - Korea (%)
Place of birth for the foreign-born population - Other Eastern Asia (%)
Place of birth for the foreign-born population - Afghanistan (%)
Place of birth for the foreign-born population - Bangladesh (%)
Place of birth for the foreign-born population - India (%)
Place of birth for the foreign-born population - Iran (%)
Place of birth for the foreign-born population - Kazakhstan (%)
Place of birth for the foreign-born population - Nepal (%)
Place of birth for the foreign-born population - Pakistan (%)
Place of birth for the foreign-born population - Sri Lanka (%)
Place of birth for the foreign-born population - Uzbekistan (%)
Place of birth for the foreign-born population - Other South Central Asia (%)
Place of birth for the foreign-born population - Burma (%)
Place of birth for the foreign-born population - Cambodia (%)
Place of birth for the foreign-born population - Indonesia (%)
Place of birth for the foreign-born population - Laos (%)
Place of birth for the foreign-born population - Malaysia (%)
Place of birth for the foreign-born population - Philippines (%)
Place of birth for the foreign-born population - Singapore (%)
Place of birth for the foreign-born population - Thailand (%)
Place of birth for the foreign-born population - Vietnam (%)
Place of birth for the foreign-born population - Other South Eastern Asia (%)
Place of birth for the foreign-born population - Armenia (%)
Place of birth for the foreign-born population - Iraq (%)
Place of birth for the foreign-born population - Israel (%)
Place of birth for the foreign-born population - Jordan (%)
Place of birth for the foreign-born population - Kuwait (%)
Place of birth for the foreign-born population - Lebanon (%)
Place of birth for the foreign-born population - Saudi Arabia (%)
Place of birth for the foreign-born population - Syria (%)
Place of birth for the foreign-born population - Turkey (%)
Place of birth for the foreign-born population - Yemen (%)
Place of birth for the foreign-born population - Other Western Asia (%)
Place of birth for the foreign-born population - Eritrea (%)
Place of birth for the foreign-born population - Ethiopia (%)
Place of birth for the foreign-born population - Kenya (%)
Place of birth for the foreign-born population - Somalia (%)
Place of birth for the foreign-born population - Uganda (%)
Place of birth for the foreign-born population - Zimbabwe (%)
Place of birth for the foreign-born population - Other Eastern Africa (%)
Place of birth for the foreign-born population - Cameroon (%)
Place of birth for the foreign-born population - Congo (%)
Place of birth for the foreign-born population - Democratic Republic of Congo (Zaire) (%)
Place of birth for the foreign-born population - Other Middle Africa (%)
Place of birth for the foreign-born population - Egypt (%)
Place of birth for the foreign-born population - Morocco (%)
Place of birth for the foreign-born population - Sudan (%)
Place of birth for the foreign-born population - Other Northern Africa (%)
Place of birth for the foreign-born population - South Africa (%)
Place of birth for the foreign-born population - Other Southern Africa (%)
Place of birth for the foreign-born population - Cabo Verde (%)
Place of birth for the foreign-born population - Ghana (%)
Place of birth for the foreign-born population - Liberia (%)
Place of birth for the foreign-born population - Nigeria (%)
Place of birth for the foreign-born population - Senegal (%)
Place of birth for the foreign-born population - Sierra Leone (%)
Place of birth for the foreign-born population - Other Western Africa (%)
Place of birth for the foreign-born population - Australia (%)
Place of birth for the foreign-born population - New Zealand (%)
Place of birth for the foreign-born population - Fiji (%)
Place of birth for the foreign-born population - Micronesia (%)
Place of birth for the foreign-born population - Bahamas (%)
Place of birth for the foreign-born population - Barbados (%)
Place of birth for the foreign-born population - Cuba (%)
Place of birth for the foreign-born population - Dominica (%)
Place of birth for the foreign-born population - Dominican Republic (%)
Place of birth for the foreign-born population - Grenada (%)
Place of birth for the foreign-born population - Haiti (%)
Place of birth for the foreign-born population - Jamaica (%)
Place of birth for the foreign-born population - St. Vincent and the Grenadines (%)
Place of birth for the foreign-born population - Trinidad and Tobago (%)
Place of birth for the foreign-born population - West Indies (%)
Place of birth for the foreign-born population - Other Caribbean (%)
Place of birth for the foreign-born population - Belize (%)
Place of birth for the foreign-born population - Costa Rica (%)
Place of birth for the foreign-born population - El Salvador (%)
Place of birth for the foreign-born population - Guatemala (%)
Place of birth for the foreign-born population - Honduras (%)
Place of birth for the foreign-born population - Mexico (%)
Place of birth for the foreign-born population - Nicaragua (%)
Place of birth for the foreign-born population - Panama (%)
Place of birth for the foreign-born population - Other Central America (%)
Place of birth for the foreign-born population - Argentina (%)
Place of birth for the foreign-born population - Bolivia (%)
Place of birth for the foreign-born population - Brazil (%)
Place of birth for the foreign-born population - Chile (%)
Place of birth for the foreign-born population - Colombia (%)
Place of birth for the foreign-born population - Ecuador (%)
Place of birth for the foreign-born population - Guyana (%)
Place of birth for the foreign-born population - Peru (%)
Place of birth for the foreign-born population - Uruguay (%)
Place of birth for the foreign-born population - Venezuela (%)
Place of birth for the foreign-born population - Other South America (%)
Place of birth for the foreign-born population - Canada (%)
Place of birth for the foreign-born population - Other Northern America (%)
Place of birth for the foreign-born population - Other (%)
Latest news about races in Kernersville, NC collected exclusively by city-data.com from local newspapers, TV, and radio stations
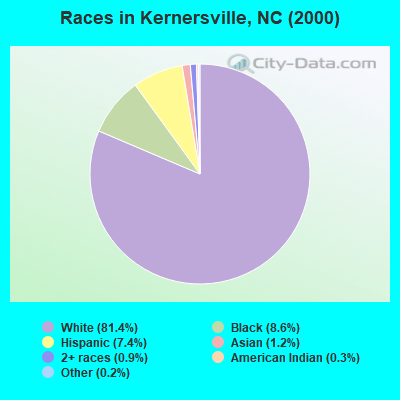
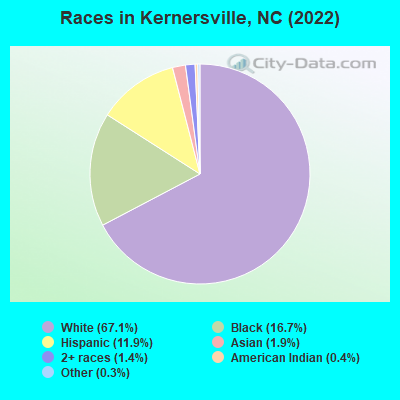
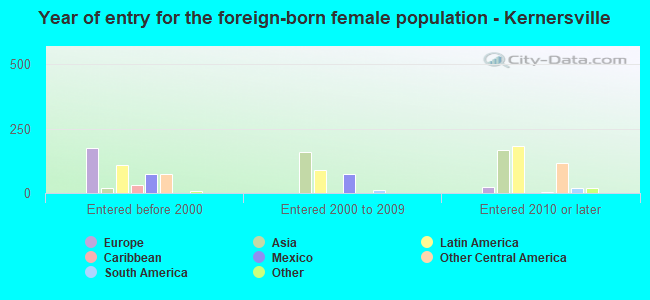
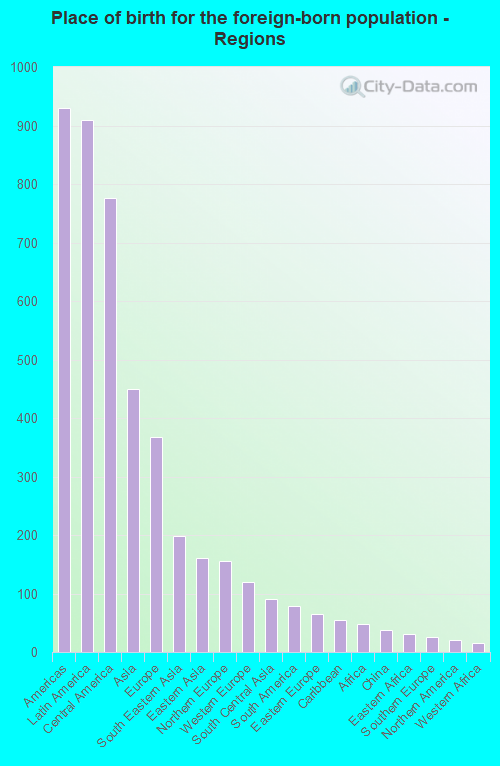
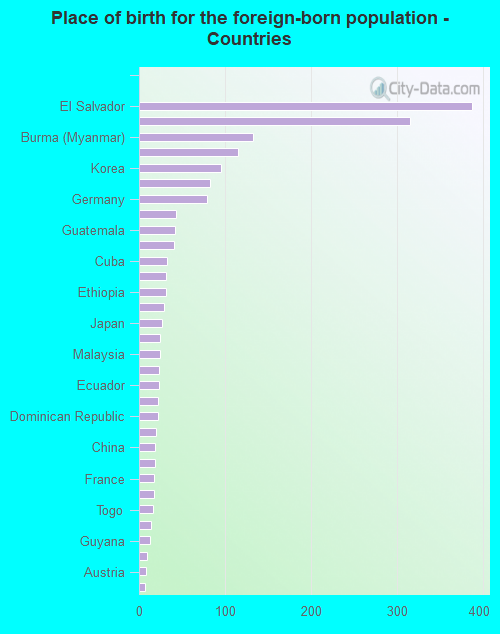
According to 2022 data, the most numerous races in Kernersville, NC are White alone (18,501 residents), Black alone (4,594 residents), and Hispanic (3,287 residents). 89.1% of Kernersville residents speak English at home. 6.5% of Kernersville, NC residents are foreign-born (3.2% born in Latin America, 1.6% born in Asia, 1.3% born in Europe), which is 22.8% less than the foreign-born rate of 8.0% across the entire state of North Carolina.
Race distribution in Kernersville
2000 2022
5,647,155 70.2% White alone 1,723,301 21.4% Black alone 378,963 4.7% Hispanic 112,416 1.4% Asian alone 95,333 1.2% American Indian alone 79,965 1.0% Two or more races 9,015 0.1% Other race alone 3,165 0.04% Native Hawaiian and Other
6,497,519 60.7% White alone 2,155,650 20.1% Black alone 1,114,799 10.4% Hispanic 438,061 4.1% Two or more races 341,052 3.2% Asian alone 91,758 0.9% American Indian alone 50,180 0.5% Other race alone 9,954 0.09% Native Hawaiian and Other
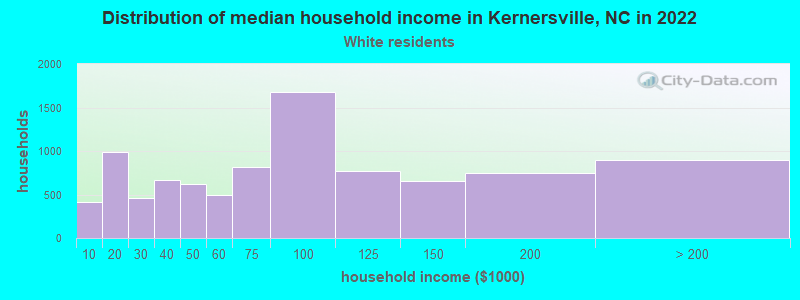
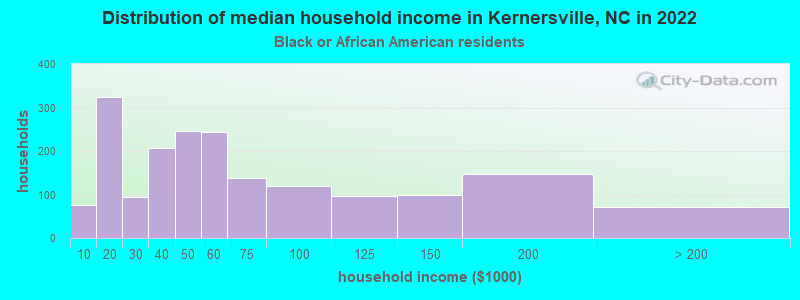
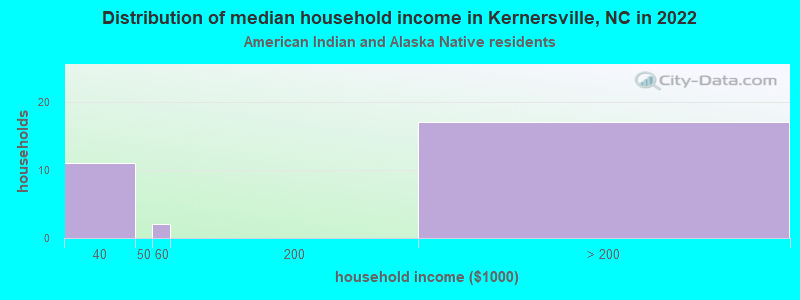
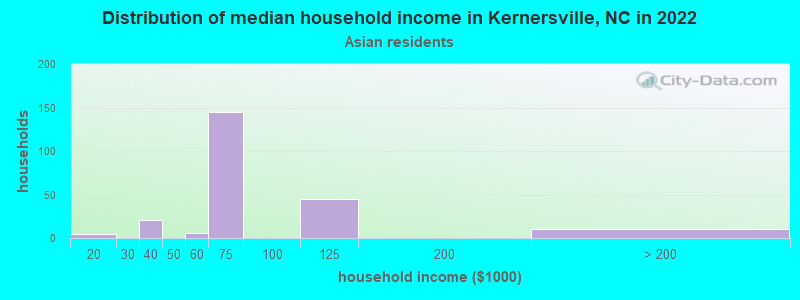
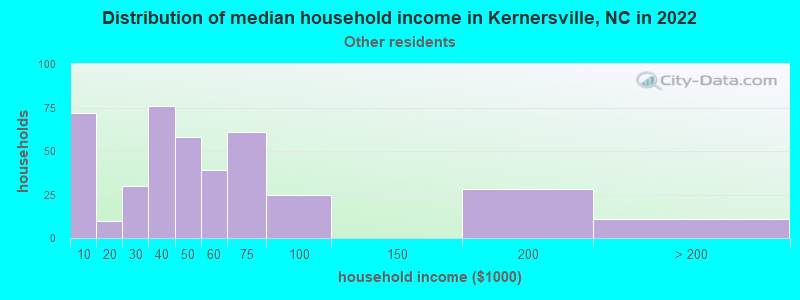
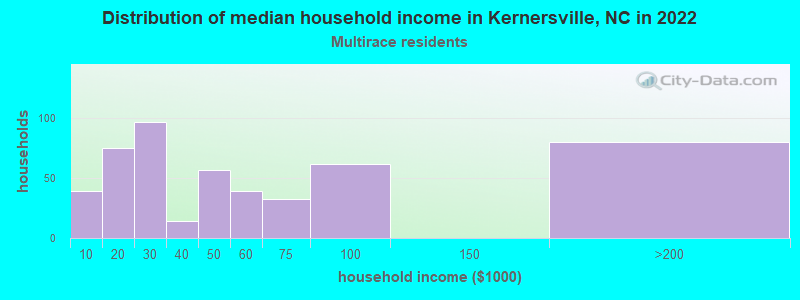
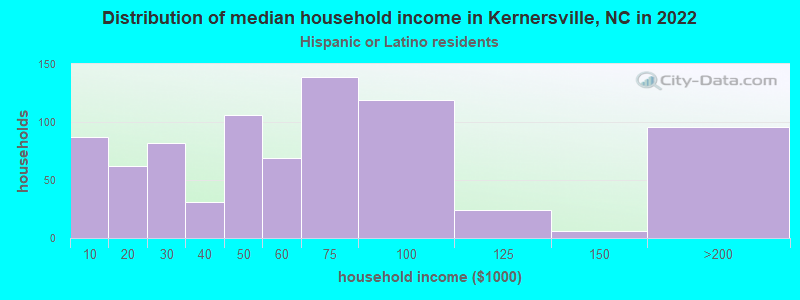
Income and house value in Kernersville Median household income in 2022 $76,769 White non-Hispanic householders$49,223 Black householders$63,564 Asian householders$43,734 Some other race householders$32,239 Two or more races householders$54,483 Hispanic or Latino race householdersMedian 2022 house value $323,349 White Non-Hispanic householders$317,736 Black or African American householders $272,101 Asian householders$119,334 Some other race householders$335,551 Two or more races householders$269,905 Hispanic or Latino householders
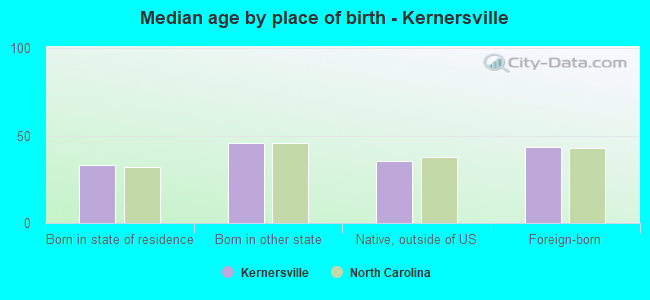
Median age by race in Kernersville
46.2 Median age for White residents44.4 47.6 31.4 Median age for Black or African American residents33.0 30.4 47.7 Median age for American Indian / Alaska Native residents-1,042,471,041.4 26.0 27.8 Median age for Asian residents29.0 24.6 -1,306,122,447.7 Median age for Native Hawaiian / Pacific Islander residents-611,708,482.1 -1,166,666,665.5 16.0 Median age for Other race residents14.4 19.1 26.6 Median age for Two or more races residents21.5 35.5 46.0 Median age for White alone residents44.0 47.8 22.4 Median age for Hispanic or Latino residents22.1 24.3
Owner/renter occupied households by race in Kernersville
House owners and renters - White residents 5,555 61.2% Owner occupied3,528 38.8% Renter occupiedHouse owners and renters - Black or African American residents 629 35.4% Owner occupied1,148 64.6% Renter occupiedHouse owners and renters - American Indian / Alaska Native residents 13 51.2% Owner occupied12 48.8% Renter occupiedHouse owners and renters - Asian residents 65 34.2% Owner occupied124 65.8% Renter occupiedHouse owners and renters - Other race residents 152 36.0% Owner occupied271 64.0% Renter occupiedHouse owners and renters - Two or more races residents 149 27.4% Owner occupied394 72.6% Renter occupiedHouse owners and renters - White alone residents 5,502 60.0% Owner occupied3,663 40.0% Renter occupiedHouse owners and renters - Hispanic or Latino residents 404 50.0% Owner occupied405 50.0% Renter occupied
Language usage in Kernersville
English speakers - Total 89.1% of residents of Kernersville speak English at home.
8.1% of residents speak Spanish at home 1,155 54.5% Speak English very well964 45.5% Speak English less than very well2.5% of residents speak other language at home 571 86.8% Speak English very well87 13.2% Speak English less than very well
English speakers - Born in the United States 95.2% of residents of Kernersville speak English at home.
2.6% of residents speak Spanish at home 236 87.7% Speak English very well33 12.3% Speak English less than very well1.8% of residents speak other language at home 133 72.3% Speak English very well51 27.7% Speak English less than very well
English speakers - Native, born elsewhere 50.7% of residents of Kernersville speak English at home.
56.2% of residents speak Spanish at home 249 72.8% Speak English very well93 27.2% Speak English less than very well
English speakers - Foreign-born 26.7% of residents of Kernersville speak English at home.
48.6% of residents speak Spanish at home 264 31.1% Speak English very well586 68.9% Speak English less than very well26.3% of residents speak other language at home 417 90.7% Speak English very well43 9.3% Speak English less than very well
White (Caucasian) - Speak only English Native:
100.0% (17,459)Foreign-born:
100.0% (331)
White (Caucasian) - Speak another language Native:
1.3% (224)Foreign-born:
55.7% (184)
Black or African American - Speak only English Native:
98.1% (4,328)Foreign-born:
45.1% (26)
Black or African American - Speak another language Native:
1.8% (80)Foreign-born:
40.0% (23)
Asian - Speak only English Native:
98.2% (91)Foreign-born:
22.0% (88)
Asian - Speak another language Native:
8.8% (8)Foreign-born:
78.0% (313)
Other race - Speak another language Native:
66.1% (827)Foreign-born:
100.0% (633)
Two or more races - Speak only English Native:
39.6% (346)Foreign-born:
3.1% (9)
Two or more races - Speak another language Native:
69.8% (610)Foreign-born:
98.2% (286)
White alone - Speak only English Native:
99.2% (17,156)Foreign-born:
89.2% (356)
White alone - Speak another language Native:
0.9% (157)Foreign-born:
21.5% (86)
Hispanic or Latino - Speak only English Native:
40.1% (827)Foreign-born:
3.3% (29)
Hispanic or Latino - Speak another language Native:
59.3% (1,222)Foreign-born:
96.8% (845)
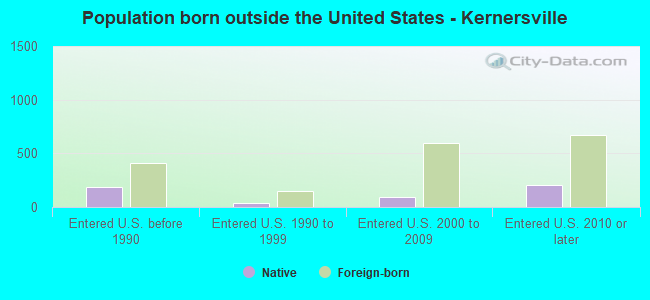
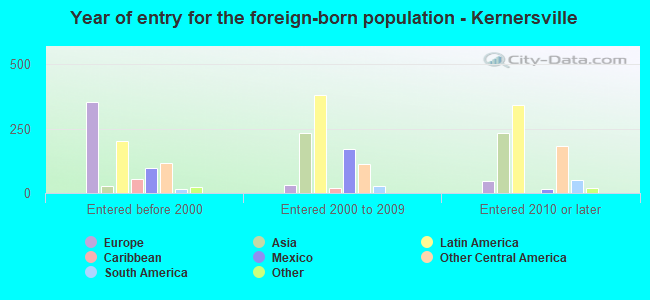
Foreign-born residents in Kernersville 1,796 residents are foreign born (3.2% Latin America , 1.6% Asia , 1.3% Europe ).
This city:
6.5%North Carolina:
8.3%
Marital status for residents in Kernersville Marital status - White (Caucasian) population 15 years and over
Males 32.2% Never married53.9% Now married1.4% Separated2.1% Widowed10.3% DivorcedFemales 22.5% Never married48.5% Now married3.2% Separated13.1% Widowed12.7% DivorcedWomen who gave birth in the past 12 months Now married:
84.6% (146)Unmarried:
15.4% (27)
Women who did not give birth in the past 12 months Now married:
46.2% (1,694)Unmarried:
53.8% (1,971)
Marital status - Black or African American population 15 years and over
Males 50.4% Never married35.3% Now married4.8% Separated3.5% Widowed6.1% DivorcedFemales 45.9% Never married30.3% Now married4.0% Separated7.8% Widowed12.0% DivorcedWomen who gave birth in the past 12 months Now married:
100.0% (54)Unmarried:
0.0% (0)
Women who did not give birth in the past 12 months Now married:
26.8% (321)Unmarried:
73.2% (877)
Marital status - American Indian / Alaska Native population 15 years and over
Males 100.0% Never married0.0% Now married0.0% Separated0.0% Widowed0.0% DivorcedFemales 47.3% Never married16.2% Now married0.0% Separated0.0% Widowed36.5% DivorcedWomen who did not give birth in the past 12 months Now married:
25.5% (13)Unmarried:
74.5% (37)
Marital status - Asian population 15 years and over
Males 33.7% Never married66.3% Now married0.0% Separated0.0% Widowed0.0% DivorcedFemales 53.1% Never married43.2% Now married0.0% Separated0.0% Widowed3.7% DivorcedWomen who gave birth in the past 12 months Now married:
100.0% (19)Unmarried:
0.0% (0)
Women who did not give birth in the past 12 months Now married:
23.7% (46)Unmarried:
76.3% (147)
Marital status - Other race population 15 years and over
Males 42.8% Never married53.5% Now married0.0% Separated0.0% Widowed3.7% DivorcedFemales 67.5% Never married25.5% Now married4.0% Separated3.1% Widowed0.0% DivorcedWomen who gave birth in the past 12 months Now married:
0.0% (0)Unmarried:
100.0% (58)
Women who did not give birth in the past 12 months Now married:
29.1% (170)Unmarried:
70.9% (414)
Marital status - Two or more races population 15 years and over
Males 56.5% Never married40.0% Now married0.0% Separated0.0% Widowed3.5% DivorcedFemales 36.7% Never married48.5% Now married2.7% Separated2.4% Widowed9.7% DivorcedWomen who gave birth in the past 12 months Now married:
100.0% (53)Unmarried:
0.0% (0)
Women who did not give birth in the past 12 months Now married:
57.4% (147)Unmarried:
42.6% (109)
Marital status - White alone, not Hispanic / Latino population 15 years and over
Males 30.6% Never married55.0% Now married1.5% Separated2.3% Widowed10.7% DivorcedFemales 21.1% Never married49.4% Now married2.8% Separated13.6% Widowed13.2% DivorcedWomen who gave birth in the past 12 months Now married:
97.5% (157)Unmarried:
2.5% (4)
Women who did not give birth in the past 12 months Now married:
46.5% (1,708)Unmarried:
53.5% (1,965)
Marital status - Hispanic or Latino population 15 years and over
Males 54.7% Never married43.2% Now married0.0% Separated0.0% Widowed2.1% DivorcedFemales 51.3% Never married36.6% Now married6.2% Separated2.2% Widowed3.7% DivorcedWomen who gave birth in the past 12 months Now married:
38.8% (42)Unmarried:
61.2% (66)
Women who did not give birth in the past 12 months Now married:
41.3% (364)Unmarried:
58.7% (519)
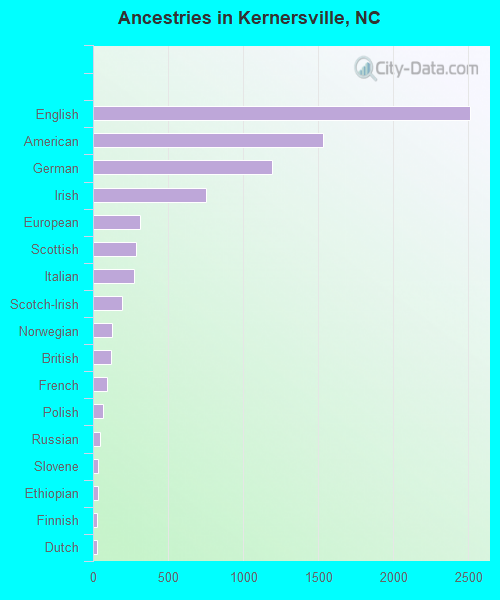
Ancestries in Kernersville
2,511 16.7% English1,530 10.2% American1,194 8.0% German753 5.0% Irish314 2.1% European283 1.9% Scottish270 1.8% Italian194 1.3% Scotch-Irish125 0.8% Norwegian120 0.8% British91 0.6% French67 0.4% Polish44 0.3% Russian36 0.2% Slovene34 0.2% Ethiopian25 0.2% Finnish24 0.2% Dutch22 0.1% Danish22 0.1% French Canadian21 0.1% Swedish17 0.1% Scandinavian14 0.09% African12 0.08% Jamaican10 0.07% Greek9 0.06% Palestinian9 0.06% Cajun8 0.05% Welsh7 0.05% Austrian7 0.05% Iranian3 0.02% Canadian
Geographical mobility in Kernersville Same house 1 year ago 15,458 85.3% White (Caucasian)3,922 84.2% Black or African American118 100.0% American Indian / Alaska Native321 62.7% Asian1,491 91.2% Other race1,087 81.5% Two or more races15,562 85.2% White alone, not Hispanic / Latino2,853 91.5% Hispanic or LatinoMoved within same county 653 3.6% White / Caucasian357 7.7% Black or African American66 4.0% Other race112 8.4% Two or more races696 3.8% White alone, not Hispanic / Latino126 4.0% Hispanic or LatinoMoved within same state 1,404 7.7% White / Caucasian287 6.2% Black or African American16 3.1% Asian56 3.4% Other race52 3.9% Two or more races1,390 7.6% White alone, not Hispanic / Latino60 1.9% Hispanic or LatinoMoved from different state 858 4.7% White / Caucasian1 0.0% Black or African American129 25.1% Asian23 1.4% Other race82 6.2% Two or more races810 4.4% White alone, not Hispanic / Latino103 3.3% Hispanic or LatinoMoved from abroad 26 5.0% Asian13 1.0% Two or more races24 0.8% Hispanic or Latino
Children Nativity (place of birth) in Kernersville
Children under 6 years - Living with two parents Both parents native 995 100.0% NativeBoth parents foreign-born 131 100.0% NativeOne native, one foreign-born parent 35 100.0% NativeChildren under 6 years - Living with one parent Native parent 412 100.0% NativeForeign-born parent 68 100.0% NativeChildren 6 to 17 years - Living with two parents Both parents native 1,650 99.8% Native4 0.2% Foreign-bornBoth parents foreign-born 135 90.5% Native14 9.5% Foreign-bornOne native, one foreign-born parent 204 80.2% Native50 19.8% Foreign-bornChildren 6 to 17 years - Living with one parent Native parent 1,322 100.0% NativeForeign-born parent 284 52.9% Native252 47.1% Foreign-born
Grandparents responsible for own grandchildren in Kernersville
Grandparents (30 to 59 years) White / Caucasian 9 60.3% Responsible for grandchildren6 39.7% Not responsible for grandchildrenBlack or African American 49 33.6% Responsible for grandchildren96 66.4% Not responsible for grandchildrenOther race 58 100.0% Not responsible for grandchildrenWhite alone, not Hispanic / Latino 12 65.5% Responsible for grandchildren6 34.5% Not responsible for grandchildrenHispanic or Latino 22 29.6% Responsible for grandchildren52 70.4% Not responsible for grandchildrenGrandparents (60 years and over) White / Caucasian 6 25.1% Responsible for grandchildren19 74.9% Not responsible for grandchildrenWhite alone, not Hispanic / Latino 6 24.7% Responsible for grandchildren19 75.3% Not responsible for grandchildren