Hilton Head Island, SC (South Carolina) Houses and Residents
Estimated median house or condo value in 2022: $721,950 (it was $280,100 in 2000 )
Hilton Head Island:
$721,950South Carolina:
$254,600
Lower value quartile - upper value quartile: $420,428 - $1,043,657Mean price in 2022: Detached houses: $1,051,903 Here:
$1,051,903State:
$368,255
Townhouses or other attached units: $542,811 Here:
$542,811State:
$292,023
In 2-unit structures: $645,845 Here:
$645,845State:
$358,283
In 3-to-4-unit structures: $310,695 Here:
$310,695State:
$230,702
In 5-or-more-unit structures: $420,179 Here:
$420,179State:
$326,361
Mobile homes: $91,632 Here:
$91,632State:
$102,531
Total population: 40,039 (Urban population: 33,775 (all inside urban clusters), Rural population: 0)
Houses: 31,626 (17,895 occupied: 14,655 owner occupied, 3,495 renter occupied )
% of renters here:
19%State:
28%
Housing density: 752 houses/condos per square mile
Median price asked for vacant for-sale houses and condos in 2022: $414,351.
Median contract rent in 2022: $1,440 (lower quartile is $915, upper quartile is over $2,000)
Median rent asked for vacant for-rent units in 2022: $3,027
Median gross rent in Hilton Head Island, SC in 2022: $1,585
Housing units in Hilton Head Island with a mortgage: 7,476 (356 second mortgage, 21 home equity loan, 303 both second mortgage and home equity loan )Houses without a mortgage: 297
Median household income for houses/condos with a mortgage: $122,804
Median household income for apartments without a mortgage: $85,132
Median monthly housing costs: $1,423
Data:
Median house or condo value ($)
Median house or condo value ($ change since 2000)
Median house or condo value ($) - White
Median house or condo value ($) - Black or African American
Median house or condo value ($) - Asian
Median house or condo value ($) - Hispanic or Latino
Median house or condo value ($) - American Indian and Alaska Native
Median house or condo value ($) - Multirace
Median house or condo value ($) - Other Race
Median price asked for mobile homes ($)
Household density (households per square mile)
Mean house or condo value by units in structure - 1, detached ($)
Mean house or condo value by units in structure - 1, attached ($)
Mean house or condo value by units in structure - 2 ($)
Mean house or condo value by units in structure by units in structure - 3 or 4 ($)
Mean house or condo value by units in structure - 5 or more ($)
Mean house or condo value by units in structure - Boat, RV, van, etc. ($)
Mean house or condo value by units in structure - Mobile home ($)
Median contract rent ($)
Median contract rent - Lower quartile ($)
Median contract rent - Upper quartile ($)
Median gross rent ($)
Urban houses (%)
Rural houses (%)
Houses occupied (%)
Houses occupied (% change since 2000)
Houses owner occupied (%)
Houses owner occupied (% change since 2000)
Houses renter occupied (%)
Houses renter occupied (% change since 2000)
Vacant housing units - For rent (%)
Vacant housing units - For rent (% change since 2000)
Vacant housing units - For sale only (%)
Vacant housing units - For sale only (% change since 2000)
Vacant housing units - Rented or sold, not occupied (%)
Vacant housing units - Rented or sold, not occupied (% change since 2000)
Vacant housing units - For seasonal, recreational, or occasional use (%)
Vacant housing units - For seasonal, recreational, or occasional use (% change since 2000)
Vacant housing units - For migrant workers (%)
Vacant housing units - For migrant workers (% change since 2000)
Vacant housing units - Other vacant (%)
Vacant housing units - Other vacant (% change since 2000)
Median monthly housing costs ($)
Median household income for houses/condos with a mortgage ($)
Median household income for houses/condos without a mortgage ($)
Median household income ($)
Median household income ($) - White
Median household income ($) - Black or African American
Median household income ($) - Asian
Median household income ($) - Hispanic or Latino
Median household income ($) - American Indian and Alaska Native
Median household income ($) - Multirace
Median household income ($) - Other Race
Mortgage status - with mortgage (%)
Mortgage status - with second mortgage (%)
Mortgage status - with home equity loan (%)
Mortgage status - with both second mortgage and home equity loan (%)
Mortgage status - without a mortgage (%)
Median year house/condo built
Median year apartment built
Household type by relationship - Male householder living alone (%)
Household type by relationship - Male householder not living alone (%)
Household type by relationship - Female householder living alone (%)
Household type by relationship - Female householder not living alone (%)
Household type by relationship - Opposite-Sex spouse (%)
Household type by relationship - Same-Sex spouse (%)
Household type by relationship - Opposite-Sex unmarried partner (%)
Household type by relationship - Same-Sex unmarried partner (%)
Household type by relationship - In group quarters (%)
Size of family households - 2-person household (%)
Size of family households - 3-person household (%)
Size of family households - 4-person household (%)
Size of family households - 5-person household (%)
Size of family households - 6-person household (%)
Size of family households - 7-or-more-person household (%)
Size of nonfamily households - 1-person household (%)
Size of nonfamily households - 2-person household (%)
Size of nonfamily households - 3-person household (%)
Size of nonfamily households - 4-person household (%)
Size of nonfamily households - 5-person household (%)
Size of nonfamily households - 6-person household (%)
Size of nonfamily households - 7-or-moreperson household (%)
Year house built - Built 2010 or later (%)
Year house built - Built 2000 to 2009 (%)
Year house built - Built 1990 to 1999 (%)
Year house built - Built 1980 to 1989 (%)
Year house built - Built 1970 to 1979 (%)
Year house built - Built 1960 to 1969 (%)
Year house built - Built 1950 to 1959 (%)
Year house built - Built 1940 to 1949 (%)
Year house built - Built 1939 or earlier (%)
Median number of rooms in houses and condos
Median number of rooms in apartments
Median number of bedrooms in owner occupied houses
Mean number of bedrooms in owner occupied houses
Median number of bedrooms in renter occupied houses
Mean number of bedrooms in renter occupied houses
Median number of vehichles in owner occupied houses
Mean number of vehichles in owner occupied houses
Median number of vehichles in renter occupied houses
Mean number of vehichles in renter occupied houses
Rooms in owner-occupied houses - 1 room (%)
Rooms in owner-occupied houses - 2 rooms (%)
Rooms in owner-occupied houses - 3 rooms (%)
Rooms in owner-occupied houses - 4 rooms (%)
Rooms in owner-occupied houses - 5 rooms (%)
Rooms in owner-occupied houses - 6 rooms (%)
Rooms in owner-occupied houses - 7 rooms (%)
Rooms in owner-occupied houses - 8 rooms (%)
Rooms in owner-occupied houses - 9+ rooms (%)
Rooms in renter-occupied houses - 1 room (%)
Rooms in renter-occupied houses - 2 rooms (%)
Rooms in renter-occupied houses - 3 rooms (%)
Rooms in renter-occupied houses - 4 rooms (%)
Rooms in renter-occupied houses - 5 rooms (%)
Rooms in renter-occupied houses - 6 rooms (%)
Rooms in renter-occupied houses - 7 rooms (%)
Rooms in renter-occupied houses - 8 rooms (%)
Rooms in renter-occupied houses - 9+ rooms (%)
Bedrooms in owner-occupied houses - no bedrooms (%)
Bedrooms in owner-occupied houses - 1 bedroom (%)
Bedrooms in owner-occupied houses - 2 bedrooms (%)
Bedrooms in owner-occupied houses - 3 bedrooms (%)
Bedrooms in owner-occupied houses - 4 bedrooms (%)
Bedrooms in owner-occupied houses - 5+ bedrooms (%)
Bedrooms in renter-occupied houses - no bedrooms (%)
Bedrooms in renter-occupied houses - 1 bedroom (%)
Bedrooms in renter-occupied houses - 2 bedrooms (%)
Bedrooms in renter-occupied houses - 3 bedrooms (%)
Bedrooms in renter-occupied houses - 4 bedrooms (%)
Bedrooms in renter-occupied houses - 5+ bedrooms (%)
Vehicles available in owner-occupied houses - no vehicle available (%)
Vehicles available in owner-occupied houses - 1 vehicle available(%)
Vehicles available in owner-occupied houses - 2 Vehicles available (%)
Vehicles available in owner-occupied houses - 3 Vehicles available (%)
Vehicles available in owner-occupied houses - 4 Vehicles available (%)
Vehicles available in owner-occupied houses - 5+ Vehicles available (%)
Vehicles available in renter-occupied houses - no vehicle available (%)
Vehicles available in renter-occupied houses - 1 vehicle available (%)
Vehicles available in renter-occupied houses - 2 Vehicles available (%)
Vehicles available in renter-occupied houses - 3 Vehicles available (%)
Vehicles available in renter-occupied houses - 4 Vehicles available (%)
Vehicles available in renter-occupied houses - 5+ Vehicles available (%)
Housing units in structures - 1, detached (%)
Housing units in structures - 1, attached (%)
Housing units in structures - 2 (%)
Housing units in structures - 3 or 4 (%)
Housing units in structures - 5 to 9 (%)
Housing units in structures - 10 to 19 (%)
Housing units in structures - 20 to 49 (%)
Housing units in structures - 50 or more (%)
Housing units in structures - Mobile home (%)
Housing units in structures - Boat, RV, van, etc. (%)
Housing units in structures - Owners - 1, detached (%)
Housing units in structures - Owners - 1, attached (%)
Housing units in structures - Owners - 2 (%)
Housing units in structures - Owners - 3 or 4 (%)
Housing units in structures - Owners - 5 to 9 (%)
Housing units in structures - Owners - 10 to 19 (%)
Housing units in structures - Owners - 20 to 49 (%)
Housing units in structures - Owners - 50 or more (%)
Housing units in structures - Owners - Mobile home (%)
Housing units in structures - Owners - Boat, RV, van, etc. (%)
Housing units in structures - Renters - 1, detached (%)
Housing units in structures - Renters - 1, attached (%)
Housing units in structures - Renters - 2 (%)
Housing units in structures - Renters - 3 or 4 (%)
Housing units in structures - Renters - 5 to 9 (%)
Housing units in structures - Renters - 10 to 19 (%)
Housing units in structures - Renters - 20 to 49 (%)
Housing units in structures - Renters - 50 or more (%)
Housing units in structures - Renters - Mobile home (%)
Housing units in structures - Renters - Boat, RV, van, etc. (%)
House/condo owner moved in on average (years ago)
Renter moved in on average (years ago)
Year householder moved into unit - Moved in 1999 to March 2000 (%)
Year householder moved into unit - Moved in 1999 to March 2000 (%) - White
Year householder moved into unit - Moved in 1999 to March 2000 (%) - Black or African American
Year householder moved into unit - Moved in 1999 to March 2000 (%) - Asian
Year householder moved into unit - Moved in 1999 to March 2000 (%) - Hispanic or Latino
Year householder moved into unit - Moved in 1999 to March 2000 (%) - American Indian and Alaska Native
Year householder moved into unit - Moved in 1999 to March 2000 (%) - Multirace
Year householder moved into unit - Moved in 1999 to March 2000 (%) - Other Race
Year householder moved into unit - Moved in 1995 to 1998 (%)
Year householder moved into unit - Moved in 1995 to 1998 (%) - White
Year householder moved into unit - Moved in 1995 to 1998 (%) - Black or African American
Year householder moved into unit - Moved in 1995 to 1998 (%) - Asian
Year householder moved into unit - Moved in 1995 to 1998 (%) - Hispanic or Latino
Year householder moved into unit - Moved in 1995 to 1998 (%) - American Indian and Alaska Native
Year householder moved into unit - Moved in 1995 to 1998 (%) - Multirace
Year householder moved into unit - Moved in 1995 to 1998 (%) - Other Race
Year householder moved into unit - Moved in 1990 to 1994 (%)
Year householder moved into unit - Moved in 1990 to 1994 (%) - White
Year householder moved into unit - Moved in 1990 to 1994 (%) - Black or African American
Year householder moved into unit - Moved in 1990 to 1994 (%) - Asian
Year householder moved into unit - Moved in 1990 to 1994 (%) - Hispanic or Latino
Year householder moved into unit - Moved in 1990 to 1994 (%) - American Indian and Alaska Native
Year householder moved into unit - Moved in 1990 to 1994 (%) - Multirace
Year householder moved into unit - Moved in 1990 to 1994 (%) - Other Race
Year householder moved into unit - Moved in 1980 to 1989 (%)
Year householder moved into unit - Moved in 1980 to 1989 (%) - White
Year householder moved into unit - Moved in 1980 to 1989 (%) - Black or African American
Year householder moved into unit - Moved in 1980 to 1989 (%) - Asian
Year householder moved into unit - Moved in 1980 to 1989 (%) - Hispanic or Latino
Year householder moved into unit - Moved in 1980 to 1989 (%) - American Indian and Alaska Native
Year householder moved into unit - Moved in 1980 to 1989 (%) - Multirace
Year householder moved into unit - Moved in 1980 to 1989 (%) - Other Race
Year householder moved into unit - Moved in 1970 to 1979 (%)
Year householder moved into unit - Moved in 1970 to 1979 (%) - White
Year householder moved into unit - Moved in 1970 to 1979 (%) - Black or African American
Year householder moved into unit - Moved in 1970 to 1979 (%) - Asian
Year householder moved into unit - Moved in 1970 to 1979 (%) - Hispanic or Latino
Year householder moved into unit - Moved in 1970 to 1979 (%) - American Indian and Alaska Native
Year householder moved into unit - Moved in 1970 to 1979 (%) - Multirace
Year householder moved into unit - Moved in 1970 to 1979 (%) - Other Race
Year householder moved into unit - Moved in 1969 or earlier (%)
Year householder moved into unit - Moved in 1969 or earlier (%) - White
Year householder moved into unit - Moved in 1969 or earlier (%) - Black or African American
Year householder moved into unit - Moved in 1969 or earlier (%) - Asian
Year householder moved into unit - Moved in 1969 or earlier (%) - Hispanic or Latino
Year householder moved into unit - Moved in 1969 or earlier (%) - American Indian and Alaska Native
Year householder moved into unit - Moved in 1969 or earlier (%) - Multirace
Year householder moved into unit - Moved in 1969 or earlier (%) - Other Race
Housing units lacking complete plumbing facilities (%)
Housing units lacking complete kitchen facilities (%)
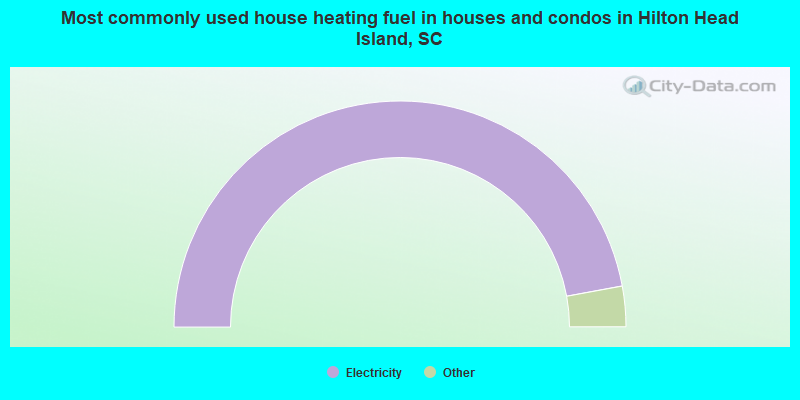
House heating fuel used in houses and condos - Utility gas (%)
House heating fuel used in houses and condos - Bottled, tank, or LP gas (%)
House heating fuel used in houses and condos - Electricity (%)
House heating fuel used in houses and condos - Fuel oil, kerosene, etc. (%)
House heating fuel used in houses and condos - Coal or coke (%)
House heating fuel used in houses and condos - Wood (%)
House heating fuel used in houses and condos - Solar energy (%)
House heating fuel used in houses and condos - Other fuel (%)
House heating fuel used in houses and condos - No fuel used (%)
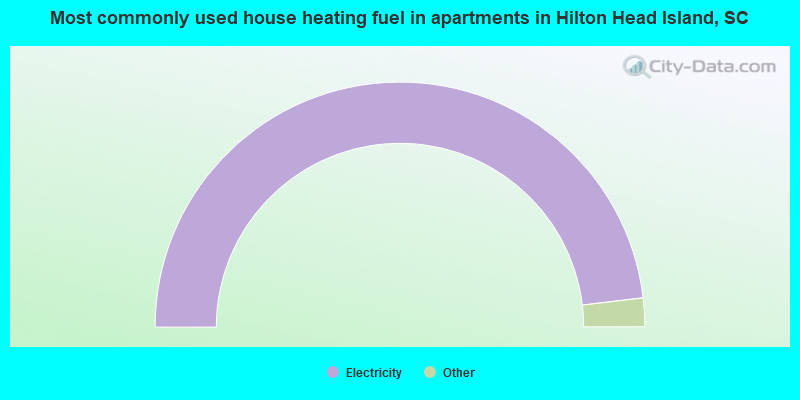
House heating fuel used in apartments - Utility gas (%)
House heating fuel used in apartments - Bottled, tank, or LP gas (%)
House heating fuel used in apartments - Electricity (%)
House heating fuel used in apartments - Fuel oil, kerosene, etc. (%)
House heating fuel used in apartments - Coal or coke (%)
House heating fuel used in apartments - Wood (%)
House heating fuel used in apartments - Solar energy (%)
House heating fuel used in apartments - Other fuel (%)
House heating fuel used in apartments - No fuel used (%)
Median year house/condo built: 1990Median year apartment built: 1988Household type by relationship:
Households: 39,163
Male householders: 9,504 (1,982 living alone ), Female householders: 8,282 (3,257 living alone )9,870 spouses (9,757 opposite-sex spouses ), 789 unmarried partners , (665 opposite-sex unmarried partners ), 7,113 children (6,831 natural , 187 adopted , 93 stepchildren ), 644 grandchildren , 490 brothers or sisters , 189 parents , 0 foster children , 724 other relatives , 1,315 non-relatives In group quarters: 237
Size of family households: 8,595 2-persons , 1,376 3-persons , 966 4-persons , 338 5-persons , 142 6-persons , 87 7-or-more-persons .
Size of nonfamily households: 5,864 1-person , 887 2-persons , 92 3-persons .
2,369 married couples with children. single-parent households (537 men , 1,118 women ).
86.2% of residents of Hilton Head Island speak English at home. of residents speak Spanish at home (55% speak English very well , 24% speak English well , 13% speak English not well , 8% don't speak English at all ).of residents speak other Indo-European language at home (88% speak English very well , 12% speak English well ).of residents speak Asian or Pacific Island language at home (86% speak English very well , 14% speak English well ).of residents speak other language at home (100% speak English very well ).
Foreign born population: 4,223 (10.8%)of them are naturalized citizens )
Median number of rooms in houses and condos:
Median number of rooms in apartments
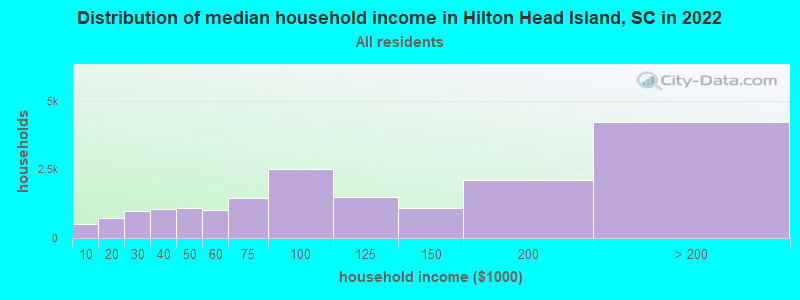
Hilton Head Island, SC household income distribution 501 Less than $10,000716 $10,000 to $19,9991,000 $20,000 to $29,9991,041 $30,000 to $39,9991,081 $40,000 to $49,9991,017 $50,000 to $59,9991,444 $60,000 to $74,9992,536 $75,000 to $99,9991,480 $100,000 to $124,9991,101 $125,000 to $149,9992,113 $150,000 to $199,9994,233 $200,000 or more
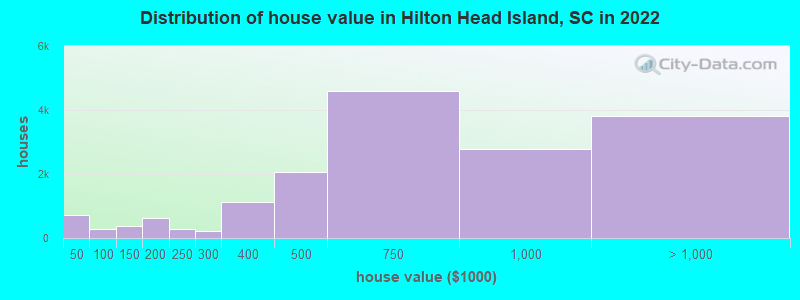
Home value of owner - occupied houses in 2022 in Hilton Head Island, SC 292 Less than $10,000243 $10,000 to $14,99928 $15,000 to $19,99925 $20,000 to $24,99920 $25,000 to $29,99913 $30,000 to $34,99920 $35,000 to $39,99963 $40,000 to $49,99954 $50,000 to $59,99958 $60,000 to $69,99944 $80,000 to $89,99970 $90,000 to $99,999172 $100,000 to $124,999187 $125,000 to $149,999178 $150,000 to $174,999444 $175,000 to $199,999275 $200,000 to $249,999231 $250,000 to $299,9991,127 $300,000 to $399,9992,070 $400,000 to $499,9994,593 $500,000 to $749,9992,784 $750,000 to $999,9992,326 $1,000,000 to $1,499,999799 $1,500,000 to $1,999,999693 $2,000,000 or moreRent paid by renters in 2022 in Hilton Head Island, SC 105 Less than $10020 $100 to $14951 $150 to $19966 $400 to $4497 $450 to $49951 $500 to $54933 $550 to $59955 $600 to $64924 $650 to $69935 $700 to $74984 $750 to $799133 $800 to $899112 $900 to $999594 $1,000 to $1,249371 $1,250 to $1,499782 $1,500 to $1,999377 $2,000 to $2,499318 $2,500 to $2,999163 $3,000 to $3,499212 $3,500 or more135 No cash rent
Percentage of workers working in this county: 92.4%Number of people working at home: 3,408 (20.7% of all workers )
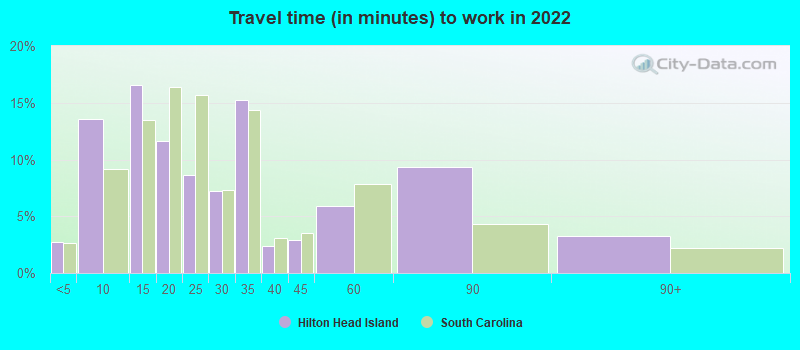
Travel time to work (commute)
Less than 5 minutes: 6745 to 9 minutes: 2,59710 to 14 minutes: 3,34015 to 19 minutes: 2,30120 to 24 minutes: 1,77525 to 29 minutes: 55330 to 34 minutes: 1,06735 to 39 minutes: 47440 to 44 minutes: 9545 to 59 minutes: 26960 to 89 minutes: 18790 or more minutes: 213
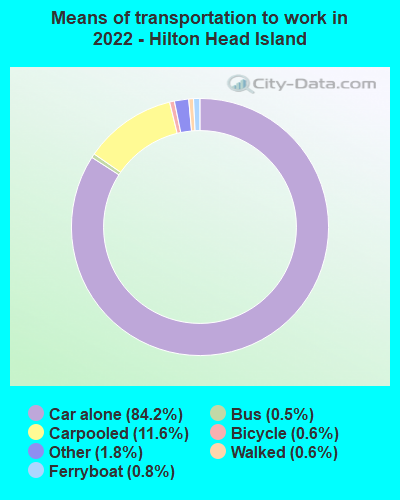
Means of transportation to work:
Drove a car alone: 19,621 (73.4%)Carpooled: 2,836 (10.6%)Bus : 103 (0.4%)Ferryboat: 99 (0.4%)Taxi: 460 (1.7%)Bicycle: 147 (0.5%)Walked: 119 (0.4%)Worked at home: 3,408 (12.8%)
Unemployment by race in 2022
Unemployment rate for White non-Hispanic residents 1.7% Males1.0% FemalesUnemployment rate for Black residents 2.0% Males5.2% FemalesUnemployment rate for American Indian and Alaska Native residents 100.0% MalesUnemployment rate for other race residents 1.3% Males5.9% FemalesUnemployment rate for two or more race residents 2.0% Males4.0% FemalesUnemployment rate for Hispanic or Latino residents 1.6% Males6.3% Females
Year of entry for the foreign-born population in Hilton Head Island, South Carolina
1,166 2010 or later 1,351 2000 to 2009 754 1990 to 1999 463 1980 to 1989 311 1970 to 1979 689 Before 1970
First ancestries reported:
English: 3,072 (16.0%)
German: 2,115 (11.0%)
Irish: 2,042 (10.6%)
American: 1,541 (8.0%)
Italian: 1,526 (7.9%)
European: 475 (2.5%)
Scotch-Irish: 446 (2.3%)
Scottish: 441 (2.3%)
Polish: 376 (2.0%)
Dutch: 270 (1.4%)
Swedish: 196 (1.0%)
Ukrainian: 164 (0.9%)
Welsh: 142 (0.7%)
Russian: 120 (0.6%)
Norwegian: 118 (0.6%)
African: 110 (0.6%)
Canadian: 108 (0.6%)
French: 108 (0.6%)
French Canadian: 100 (0.5%)
Eastern European: 99 (0.5%)
British: 97 (0.5%)
Scandinavian: 97 (0.5%)
Hungarian: 87 (0.5%)
Slovak: 69 (0.4%)
Austrian: 67 (0.3%)
Swiss: 59 (0.3%)
Jamaican: 52 (0.3%)
Armenian: 51 (0.3%)
Portuguese: 48 (0.2%)
Macedonian: 39 (0.2%)
Slavic: 38 (0.2%)
Greek: 34 (0.2%)
Yugoslavian: 34 (0.2%)
Czech: 32 (0.2%)
Lithuanian: 30 (0.2%)
Lebanese: 17 (0.09%)
Icelander: 16 (0.08%)
Belgian: 15 (0.08%)
Croatian: 14 (0.07%)
Barbadian: 14 (0.07%)
Northern European: 13 (0.07%)
Iranian: 13 (0.07%)
Pennsylvania German: 13 (0.07%)
New Zealander: 11 (0.06%)
Latvian: 7 (0.04%)
Czechoslovakian: 5 (0.03%)
Serbian: 3 (0.02%)
Danish: 3 (0.02%)
Most common places of birth for foreign-born residents (%): Mexico Hilton Head Island:
24.0% (1,040)South Carolina:
22.5% (60,774)
Colombia Hilton Head Island:
12.7% (552)South Carolina:
4.3% (11,533)
Canada Hilton Head Island:
6.9% (300)South Carolina:
3.0% (8,193)
Honduras Hilton Head Island:
6.5% (282)South Carolina:
4.8% (12,834)
United Kingdom, excluding England and Scotland Hilton Head Island:
4.8% (208)South Carolina:
1.2% (3,296)
Germany Hilton Head Island:
4.5% (196)South Carolina:
3.7% (9,982)
Netherlands Hilton Head Island:
4.0% (174)South Carolina:
0.3% (727)
Jamaica Hilton Head Island:
2.7% (118)South Carolina:
2.6% (7,073)
South Africa Hilton Head Island:
2.6% (111)South Carolina:
0.4% (1,091)
China, excluding Hong Kong and Taiwan Hilton Head Island:
2.1% (93)South Carolina:
3.2% (8,721)
Bolivia Hilton Head Island:
1.9% (84)South Carolina:
0.3% (698)
Venezuela Hilton Head Island:
1.8% (80)South Carolina:
1.4% (3,822)
England Hilton Head Island:
1.8% (79)South Carolina:
1.9% (5,117)
Guatemala Hilton Head Island:
1.6% (69)South Carolina:
3.4% (9,058)
Argentina Hilton Head Island:
1.6% (68)South Carolina:
0.5% (1,414)
Place of birth for U.S.-born residents:
This state: 6,881Other state: 27,859Northeast: 9,927Midwest: 7,354South: 8,687West: 1,589 84.8% of Hilton Head Island residents lived in the same house 1 years ago.
Out of people who lived in different houses, 17.3% lived in this county.
Out of people who lived in different counties, 18.3% lived in South Carolina.
Hilton Head Island:
84.8%State average:
86.5%
Education attainment for males 25 years and older:
No schooling: 119Nursery to 4th grade: 725th and 6th grade: 947th and 8th grade: 1949th grade: 9610th grade: 11811th grade: 24412th grade, no diploma: 209High school graduate (or equivalency): 3,141Less than 1 year of college: 868Some college more than 1 year, no degree: 1,280Associate degree: 507Bachelor's degree: 5,045Master's degree: 2,389Professional school degree: 784Doctorate degree: 750
Education attainment for females 25 years and older:
No schooling: 138Nursery to 4th grade: 285th and 6th grade: 707th and 8th grade: 1319th grade: 44510th grade: 27211th grade: 14312th grade, no diploma: 316High school graduate (or equivalency): 2,317Less than 1 year of college: 814Some college more than 1 year, no degree: 1,378Associate degree: 1,562Bachelor's degree: 5,364Master's degree: 3,678Professional school degree: 578Doctorate degree: 387
Housing units in structures:
One, detached: 15,288One, attached: 1,975Two: 2073 or 4: 1,5525 to 9: 2,63310 to 19: 1,75220 to 49: 3,50850 or more: 3,209Mobile homes: 1,482Boats, RVs, vans, etc.: 14Median worth of mobile homes: $101,189
Housing units lacking complete plumbing facilities in 2022: 0.2%Housing units lacking complete kitchen facilities in 2022: 0.9%House/condo owner moved in on average 7 years ago
Renter moved in on average 5 years ago
Private vs. public school enrollment:
Students in private schools in grades 1 to 8 (elementary and middle school): 477 Here:
24.7%South Carolina:
14.4%
Students in private schools in grades 9 to 12 (high school): 243 Here:
22.2%South Carolina:
11.1%
Students in private undergraduate colleges: 343 Here:
42.7%South Carolina:
21.9%