Races in Hilton Head Island, South Carolina (SC) Detailed Stats
Data:
Races - White alone (%)
Races - White alone (% change since 2000)
Races - Black alone (%)
Races - Black alone (% change since 2000)
Races - American Indian alone (%)
Races - American Indian alone (% change since 2000)
Races - Asian alone (%)
Races - Asian alone (% change since 2000)
Races - Hispanic (%)
Races - Hispanic (% change since 2000)
Races - Native Hawaiian and Other Pacific Islander alone (%)
Races - Native Hawaiian and Other Pacific Islander alone (% change since 2000)
Races - Two or more races(%)
Races - Two or more races(% change since 2000)
Races - Other race alone (%)
Races - Other race alone (% change since 2000)
Racial diversity
Place of birth - Born in state of residence (%)
Place of birth - Born in state of residence (%) - White
Place of birth - Born in state of residence (%) - Black or African American
Place of birth - Born in state of residence (%) - Asian
Place of birth - Born in state of residence (%) - Hispanic or Latino
Place of birth - Born in state of residence (%) - American Indian and Alaska Native
Place of birth - Born in state of residence (%) - Multirace
Place of birth - Born in state of residence (%) - Other Race
Place of birth - Born in other state (%)
Place of birth - Born in other state (%) - White
Place of birth - Born in other state (%) - Black or African American
Place of birth - Born in other state (%) - Asian
Place of birth - Born in other state (%) - Hispanic or Latino
Place of birth - Born in other state (%) - American Indian and Alaska Native
Place of birth - Born in other state (%) - Multirace
Place of birth - Born in other state (%) - Other Race
Place of birth - Native, outside of US (%)
Place of birth - Native, outside of US (%) - White
Place of birth - Native, outside of US (%) - Black or African American
Place of birth - Native, outside of US (%) - Asian
Place of birth - Native, outside of US (%) - Hispanic or Latino
Place of birth - Native, outside of US (%) - American Indian and Alaska Native
Place of birth - Native, outside of US (%) - Multirace
Place of birth - Native, outside of US (%) - Other Race
Place of birth - Foreign born (%)
Place of birth - Foreign born (%) - White
Place of birth - Foreign born (%) - Black or African American
Place of birth - Foreign born (%) - Asian
Place of birth - Foreign born (%) - Hispanic or Latino
Place of birth - Foreign born (%) - American Indian and Alaska Native
Place of birth - Foreign born (%) - Multirace
Place of birth - Foreign born (%) - Other Race
Residents speaking English at home (%)
Residents speaking English at home - Born in the United States (%)
Residents speaking English at home - Native, born elsewhere (%)
Residents speaking English at home - Foreign born (%)
Residents speaking Spanish at home (%)
Residents speaking Spanish at home - Born in the United States (%)
Residents speaking Spanish at home - Native, born elsewhere (%)
Residents speaking Spanish at home - Foreign born (%)
Residents speaking other language at home (%)
Residents speaking other language at home - Born in the United States (%)
Residents speaking other language at home - Native, born elsewhere (%)
Residents speaking other language at home - Foreign born (%)
Marital status - Never married (%)
Marital status - Now married (%)
Marital status - Separated (%)
Marital status - Widowed (%)
Marital status - Divorced (%)
Ancestries Reported - Arab (%)
Ancestries Reported - Czech (%)
Ancestries Reported - Danish (%)
Ancestries Reported - Dutch (%)
Ancestries Reported - English (%)
Ancestries Reported - French (%)
Ancestries Reported - French Canadian (%)
Ancestries Reported - German (%)
Ancestries Reported - Greek (%)
Ancestries Reported - Hungarian (%)
Ancestries Reported - Irish (%)
Ancestries Reported - Italian (%)
Ancestries Reported - Lithuanian (%)
Ancestries Reported - Norwegian (%)
Ancestries Reported - Polish (%)
Ancestries Reported - Portuguese (%)
Ancestries Reported - Russian (%)
Ancestries Reported - Scotch-Irish (%)
Ancestries Reported - Scottish (%)
Ancestries Reported - Slovak (%)
Ancestries Reported - Subsaharan African (%)
Ancestries Reported - Swedish (%)
Ancestries Reported - Swiss (%)
Ancestries Reported - Ukrainian (%)
Ancestries Reported - United States (%)
Ancestries Reported - Welsh (%)
Ancestries Reported - West Indian (%)
Ancestries Reported - Other (%)
Geographical mobility - Same house 1 year ago (%)
Geographical mobility - Same house 1 year ago (%) - White
Geographical mobility - Same house 1 year ago (%) - Black or African American
Geographical mobility - Same house 1 year ago (%) - Asian
Geographical mobility - Same house 1 year ago (%) - Hispanic or Latino
Geographical mobility - Same house 1 year ago (%) - American Indian and Alaska Native
Geographical mobility - Same house 1 year ago (%) - Multirace
Geographical mobility - Same house 1 year ago (%) - Other Race
Geographical mobility - Moved within same county (%)
Geographical mobility - Moved within same county (%) - White
Geographical mobility - Moved within same county (%) - Black or African American
Geographical mobility - Moved within same county (%) - Asian
Geographical mobility - Moved within same county (%) - Hispanic or Latino
Geographical mobility - Moved within same county (%) - American Indian and Alaska Native
Geographical mobility - Moved within same county (%) - Multirace
Geographical mobility - Moved within same county (%) - Other Race
Geographical mobility - Moved from different county within same state (%)
Geographical mobility - Moved from different county within same state (%) - White
Geographical mobility - Moved from different county within same state (%) - Black or African American
Geographical mobility - Moved from different county within same state (%) - Asian
Geographical mobility - Moved from different county within same state (%) - Hispanic or Latino
Geographical mobility - Moved from different county within same state (%) - American Indian and Alaska Native
Geographical mobility - Moved from different county within same state (%) - Multirace
Geographical mobility - Moved from different county within same state (%) - Other Race
Geographical mobility - Moved from different state (%)
Geographical mobility - Moved from different state (%) - White
Geographical mobility - Moved from different state (%) - Black or African American
Geographical mobility - Moved from different state (%) - Asian
Geographical mobility - Moved from different state (%) - Hispanic or Latino
Geographical mobility - Moved from different state (%) - American Indian and Alaska Native
Geographical mobility - Moved from different state (%) - Multirace
Geographical mobility - Moved from different state (%) - Other Race
Geographical mobility - Moved from abroad (%)
Geographical mobility - Moved from abroad (%) - White
Geographical mobility - Moved from abroad (%) - Black or African American
Geographical mobility - Moved from abroad (%) - Asian
Geographical mobility - Moved from abroad (%) - Hispanic or Latino
Geographical mobility - Moved from abroad (%) - American Indian and Alaska Native
Geographical mobility - Moved from abroad (%) - Multirace
Geographical mobility - Moved from abroad (%) - Other Race
Place of birth for the foreign-born population - Ireland (%)
Place of birth for the foreign-born population - Denmark (%)
Place of birth for the foreign-born population - Norway (%)
Place of birth for the foreign-born population - Sweden (%)
Place of birth for the foreign-born population - United Kingdom (%)
Place of birth for the foreign-born population - England (%)
Place of birth for the foreign-born population - Scotland (%)
Place of birth for the foreign-born population - Other Northern Europe (%)
Place of birth for the foreign-born population - Austria (%)
Place of birth for the foreign-born population - Belgium (%)
Place of birth for the foreign-born population - France (%)
Place of birth for the foreign-born population - Germany (%)
Place of birth for the foreign-born population - Netherlands (%)
Place of birth for the foreign-born population - Switzerland (%)
Place of birth for the foreign-born population - Other Western Europe (%)
Place of birth for the foreign-born population - Greece (%)
Place of birth for the foreign-born population - Italy (%)
Place of birth for the foreign-born population - Portugal (%)
Place of birth for the foreign-born population - Spain (%)
Place of birth for the foreign-born population - Other Southern Europe (%)
Place of birth for the foreign-born population - Albania (%)
Place of birth for the foreign-born population - Belarus (%)
Place of birth for the foreign-born population - Bosnia and Herzegovina (%)
Place of birth for the foreign-born population - Bulgaria (%)
Place of birth for the foreign-born population - Croatia (%)
Place of birth for the foreign-born population - Czechoslovakia (%)
Place of birth for the foreign-born population - Hungary (%)
Place of birth for the foreign-born population - Latvia (%)
Place of birth for the foreign-born population - Lithuania (%)
Place of birth for the foreign-born population - North Macedonia (Macedonia) (%)
Place of birth for the foreign-born population - Moldova (%)
Place of birth for the foreign-born population - Poland (%)
Place of birth for the foreign-born population - Romania (%)
Place of birth for the foreign-born population - Russia (%)
Place of birth for the foreign-born population - Serbia (%)
Place of birth for the foreign-born population - Ukraine (%)
Place of birth for the foreign-born population - Other Eastern Europe (%)
Place of birth for the foreign-born population - China (%)
Place of birth for the foreign-born population - Hong Kong (%)
Place of birth for the foreign-born population - Taiwan (%)
Place of birth for the foreign-born population - Japan (%)
Place of birth for the foreign-born population - Korea (%)
Place of birth for the foreign-born population - Other Eastern Asia (%)
Place of birth for the foreign-born population - Afghanistan (%)
Place of birth for the foreign-born population - Bangladesh (%)
Place of birth for the foreign-born population - India (%)
Place of birth for the foreign-born population - Iran (%)
Place of birth for the foreign-born population - Kazakhstan (%)
Place of birth for the foreign-born population - Nepal (%)
Place of birth for the foreign-born population - Pakistan (%)
Place of birth for the foreign-born population - Sri Lanka (%)
Place of birth for the foreign-born population - Uzbekistan (%)
Place of birth for the foreign-born population - Other South Central Asia (%)
Place of birth for the foreign-born population - Burma (%)
Place of birth for the foreign-born population - Cambodia (%)
Place of birth for the foreign-born population - Indonesia (%)
Place of birth for the foreign-born population - Laos (%)
Place of birth for the foreign-born population - Malaysia (%)
Place of birth for the foreign-born population - Philippines (%)
Place of birth for the foreign-born population - Singapore (%)
Place of birth for the foreign-born population - Thailand (%)
Place of birth for the foreign-born population - Vietnam (%)
Place of birth for the foreign-born population - Other South Eastern Asia (%)
Place of birth for the foreign-born population - Armenia (%)
Place of birth for the foreign-born population - Iraq (%)
Place of birth for the foreign-born population - Israel (%)
Place of birth for the foreign-born population - Jordan (%)
Place of birth for the foreign-born population - Kuwait (%)
Place of birth for the foreign-born population - Lebanon (%)
Place of birth for the foreign-born population - Saudi Arabia (%)
Place of birth for the foreign-born population - Syria (%)
Place of birth for the foreign-born population - Turkey (%)
Place of birth for the foreign-born population - Yemen (%)
Place of birth for the foreign-born population - Other Western Asia (%)
Place of birth for the foreign-born population - Eritrea (%)
Place of birth for the foreign-born population - Ethiopia (%)
Place of birth for the foreign-born population - Kenya (%)
Place of birth for the foreign-born population - Somalia (%)
Place of birth for the foreign-born population - Uganda (%)
Place of birth for the foreign-born population - Zimbabwe (%)
Place of birth for the foreign-born population - Other Eastern Africa (%)
Place of birth for the foreign-born population - Cameroon (%)
Place of birth for the foreign-born population - Congo (%)
Place of birth for the foreign-born population - Democratic Republic of Congo (Zaire) (%)
Place of birth for the foreign-born population - Other Middle Africa (%)
Place of birth for the foreign-born population - Egypt (%)
Place of birth for the foreign-born population - Morocco (%)
Place of birth for the foreign-born population - Sudan (%)
Place of birth for the foreign-born population - Other Northern Africa (%)
Place of birth for the foreign-born population - South Africa (%)
Place of birth for the foreign-born population - Other Southern Africa (%)
Place of birth for the foreign-born population - Cabo Verde (%)
Place of birth for the foreign-born population - Ghana (%)
Place of birth for the foreign-born population - Liberia (%)
Place of birth for the foreign-born population - Nigeria (%)
Place of birth for the foreign-born population - Senegal (%)
Place of birth for the foreign-born population - Sierra Leone (%)
Place of birth for the foreign-born population - Other Western Africa (%)
Place of birth for the foreign-born population - Australia (%)
Place of birth for the foreign-born population - New Zealand (%)
Place of birth for the foreign-born population - Fiji (%)
Place of birth for the foreign-born population - Micronesia (%)
Place of birth for the foreign-born population - Bahamas (%)
Place of birth for the foreign-born population - Barbados (%)
Place of birth for the foreign-born population - Cuba (%)
Place of birth for the foreign-born population - Dominica (%)
Place of birth for the foreign-born population - Dominican Republic (%)
Place of birth for the foreign-born population - Grenada (%)
Place of birth for the foreign-born population - Haiti (%)
Place of birth for the foreign-born population - Jamaica (%)
Place of birth for the foreign-born population - St. Vincent and the Grenadines (%)
Place of birth for the foreign-born population - Trinidad and Tobago (%)
Place of birth for the foreign-born population - West Indies (%)
Place of birth for the foreign-born population - Other Caribbean (%)
Place of birth for the foreign-born population - Belize (%)
Place of birth for the foreign-born population - Costa Rica (%)
Place of birth for the foreign-born population - El Salvador (%)
Place of birth for the foreign-born population - Guatemala (%)
Place of birth for the foreign-born population - Honduras (%)
Place of birth for the foreign-born population - Mexico (%)
Place of birth for the foreign-born population - Nicaragua (%)
Place of birth for the foreign-born population - Panama (%)
Place of birth for the foreign-born population - Other Central America (%)
Place of birth for the foreign-born population - Argentina (%)
Place of birth for the foreign-born population - Bolivia (%)
Place of birth for the foreign-born population - Brazil (%)
Place of birth for the foreign-born population - Chile (%)
Place of birth for the foreign-born population - Colombia (%)
Place of birth for the foreign-born population - Ecuador (%)
Place of birth for the foreign-born population - Guyana (%)
Place of birth for the foreign-born population - Peru (%)
Place of birth for the foreign-born population - Uruguay (%)
Place of birth for the foreign-born population - Venezuela (%)
Place of birth for the foreign-born population - Other South America (%)
Place of birth for the foreign-born population - Canada (%)
Place of birth for the foreign-born population - Other Northern America (%)
Place of birth for the foreign-born population - Other (%)
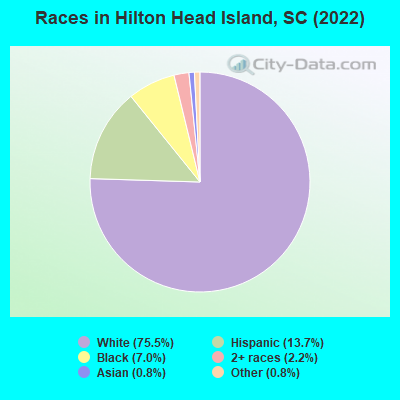
According to 2022 data, the most numerous races in Hilton Head Island, SC are White alone (29,581 residents), Black alone (2,734 residents), and Hispanic (5,366 residents). 85.3% of Hilton Head Island residents speak English at home. 11.1% of Hilton Head Island, SC residents are foreign-born (7.2% born in Latin America, 2.4% born in Europe), which is 54.8% greater than the foreign-born rate of 5.0% across the entire state of South Carolina.
Race distribution in Hilton Head Island
2000 2022
2,652,291 66.1% White alone 1,178,486 29.4% Black alone 95,076 2.4% Hispanic 35,568 0.9% Asian alone 33,290 0.8% Two or more races 12,765 0.3% American Indian alone 3,266 0.08% Other race alone 1,270 0.03% Native Hawaiian and Other
3,301,739 62.5% White alone 1,313,290 24.9% Black alone 343,783 6.5% Hispanic 190,508 3.6% Two or more races 89,888 1.7% Asian alone 29,390 0.6% Other race alone 12,112 0.2% American Indian alone 1,924 0.04% Native Hawaiian and Other
Income and house value in Hilton Head Island Median household income in 2022 $105,555 White non-Hispanic householders$41,318 Black householders$45,209 Some other race householders$70,534 Two or more races householders$60,453 Hispanic or Latino race householdersMedian 2022 house value $845,668 White Non-Hispanic householders$296,151 Black or African American householders$115,986 American Indian or Alaska Native householders over $1,000,000 Asian householders$193,310 Some other race householders$564,466 Two or more races householders$549,774 Hispanic or Latino householders
Median age by race in Hilton Head Island
64.3 Median age for White residents63.6 65.0 60.6 Median age for Black or African American residents42.7 61.2 -345,679,012.0 Median age for American Indian / Alaska Native residents-464,419,475.2 -659,400,544.3 42.9 Median age for Asian residents54.7 41.8 -698,412,697.7 Median age for Native Hawaiian / Pacific Islander residents-551,574,375.1 -666,666,666.0 44.8 Median age for Other race residents41.0 54.2 29.7 Median age for Two or more races residents29.1 30.6 65.1 Median age for White alone residents64.6 65.0 30.3 Median age for Hispanic or Latino residents29.5 31.1
Owner/renter occupied households by race in Hilton Head Island
House owners and renters - White residents 12,561 83.8% Owner occupied2,424 16.2% Renter occupiedHouse owners and renters - Black or African American residents 788 75.1% Owner occupied261 24.9% Renter occupiedHouse owners and renters - American Indian / Alaska Native residents 4 100.0% Owner occupiedHouse owners and renters - Asian residents 50 61.0% Owner occupied32 39.0% Renter occupiedHouse owners and renters - Other race residents 533 52.6% Owner occupied481 47.4% Renter occupiedHouse owners and renters - Two or more races residents 453 53.6% Owner occupied393 46.4% Renter occupiedHouse owners and renters - White alone residents 12,507 84.6% Owner occupied2,273 15.4% Renter occupiedHouse owners and renters - Hispanic or Latino residents 600 38.8% Owner occupied947 61.2% Renter occupied
Language usage in Hilton Head Island
English speakers - Total 85.3% of residents of Hilton Head Island speak English at home.
11.4% of residents speak Spanish at home 2,780 63.9% Speak English very well1,572 36.1% Speak English less than very well3.0% of residents speak other language at home 1,018 87.9% Speak English very well140 12.1% Speak English less than very well
English speakers - Born in the United States 96.0% of residents of Hilton Head Island speak English at home.
2.7% of residents speak Spanish at home 712 97.4% Speak English very well19 2.6% Speak English less than very well1.1% of residents speak other language at home 305 100.0% Speak English very well
English speakers - Native, born elsewhere 56.1% of residents of Hilton Head Island speak English at home.
30.4% of residents speak Spanish at home 108 73.0% Speak English very well40 27.0% Speak English less than very well26.9% of residents speak other language at home 131 100.0% Speak English very well
English speakers - Foreign-born 26.8% of residents of Hilton Head Island speak English at home.
56.8% of residents speak Spanish at home 1,043 43.3% Speak English very well1,364 56.7% Speak English less than very well14.3% of residents speak other language at home 474 78.0% Speak English very well134 22.0% Speak English less than very well
White (Caucasian) - Speak only English Native:
96.7% (27,389)Foreign-born:
55.1% (900)
White (Caucasian) - Speak another language Native:
3.2% (916)Foreign-born:
44.4% (725)
Black or African American - Speak only English Native:
97.2% (2,361)Foreign-born:
35.9% (58)
Black or African American - Speak another language Native:
3.0% (73)Foreign-born:
68.2% (109)
Asian - Speak only English Native:
95.1% (83)Foreign-born:
19.7% (44)
Other race - Speak only English Native:
26.0% (353)Foreign-born:
3.5% (46)
Other race - Speak another language Native:
68.6% (930)Foreign-born:
95.1% (1,246)
Two or more races - Speak only English Native:
68.4% (1,162)Foreign-born:
6.1% (52)
Two or more races - Speak another language Native:
28.5% (484)Foreign-born:
87.7% (757)
White alone - Speak only English Native:
97.4% (27,207)Foreign-born:
72.7% (975)
White alone - Speak another language Native:
2.7% (766)Foreign-born:
26.9% (361)
Hispanic or Latino - Speak only English Native:
30.1% (730)Foreign-born:
3.4% (79)
Hispanic or Latino - Speak another language Native:
65.0% (1,578)Foreign-born:
98.0% (2,292)
Foreign-born residents in Hilton Head Island 4,337 residents are foreign born (7.2% Latin America , 2.4% Europe ).
This city:
11.1%South Carolina:
5.3%
Marital status for residents in Hilton Head Island Marital status - White (Caucasian) population 15 years and over
Males 20.8% Never married64.4% Now married0.9% Separated4.5% Widowed9.4% DivorcedFemales 14.7% Never married59.8% Now married1.2% Separated13.6% Widowed10.7% DivorcedWomen who gave birth in the past 12 months Now married:
87.0% (39)Unmarried:
13.0% (6)
Women who did not give birth in the past 12 months Now married:
39.7% (1,314)Unmarried:
60.3% (1,996)
Marital status - Black or African American population 15 years and over
Males 62.0% Never married30.9% Now married0.0% Separated0.0% Widowed7.1% DivorcedFemales 23.2% Never married51.6% Now married1.4% Separated10.2% Widowed13.6% DivorcedWomen who did not give birth in the past 12 months Now married:
17.3% (41)Unmarried:
82.7% (193)
Marital status - Asian population 15 years and over
Males 48.4% Never married51.6% Now married0.0% Separated0.0% Widowed0.0% DivorcedFemales 15.6% Never married84.4% Now married0.0% Separated0.0% Widowed0.0% DivorcedWomen who did not give birth in the past 12 months Now married:
76.6% (149)Unmarried:
23.4% (45)
Marital status - Other race population 15 years and over
Males 40.7% Never married51.3% Now married2.7% Separated4.0% Widowed1.1% DivorcedFemales 27.3% Never married67.3% Now married1.9% Separated0.6% Widowed2.9% DivorcedWomen who gave birth in the past 12 months Now married:
62.5% (61)Unmarried:
37.5% (37)
Women who did not give birth in the past 12 months Now married:
45.9% (322)Unmarried:
54.1% (379)
Marital status - Two or more races population 15 years and over
Males 49.6% Never married38.6% Now married0.0% Separated4.3% Widowed7.5% DivorcedFemales 53.3% Never married33.0% Now married2.7% Separated0.5% Widowed10.5% DivorcedWomen who gave birth in the past 12 months Now married:
100.0% (23)Unmarried:
0.0% (0)
Women who did not give birth in the past 12 months Now married:
30.9% (289)Unmarried:
69.1% (646)
Marital status - White alone, not Hispanic / Latino population 15 years and over
Males 20.4% Never married65.5% Now married0.9% Separated4.3% Widowed8.9% DivorcedFemales 14.2% Never married59.6% Now married1.2% Separated14.0% Widowed11.0% DivorcedWomen who gave birth in the past 12 months Now married:
80.6% (25)Unmarried:
19.4% (6)
Women who did not give birth in the past 12 months Now married:
39.3% (1,222)Unmarried:
60.7% (1,888)
Marital status - Hispanic or Latino population 15 years and over
Males 42.4% Never married43.0% Now married2.3% Separated5.4% Widowed6.9% DivorcedFemales 35.1% Never married60.0% Now married2.5% Separated0.3% Widowed2.1% DivorcedWomen who gave birth in the past 12 months Now married:
74.0% (86)Unmarried:
26.0% (30)
Women who did not give birth in the past 12 months Now married:
47.5% (622)Unmarried:
52.5% (686)
Ancestries in Hilton Head Island
3,072 16.0% English2,115 11.0% German2,042 10.6% Irish1,541 8.0% American1,526 7.9% Italian475 2.5% European446 2.3% Scotch-Irish441 2.3% Scottish376 2.0% Polish270 1.4% Dutch196 1.0% Swedish164 0.9% Ukrainian142 0.7% Welsh120 0.6% Russian118 0.6% Norwegian110 0.6% African108 0.6% Canadian108 0.6% French100 0.5% French Canadian99 0.5% Eastern European97 0.5% British97 0.5% Scandinavian87 0.5% Hungarian69 0.4% Slovak67 0.3% Austrian59 0.3% Swiss52 0.3% Jamaican51 0.3% Armenian48 0.2% Portuguese39 0.2% Macedonian38 0.2% Slavic34 0.2% Greek34 0.2% Yugoslavian32 0.2% Czech30 0.2% Lithuanian17 0.09% Lebanese16 0.08% Icelander15 0.08% Belgian14 0.07% Croatian14 0.07% Barbadian13 0.07% Northern European13 0.07% Iranian13 0.07% Pennsylvania German11 0.06% New Zealander7 0.04% Latvian5 0.03% Czechoslovakian3 0.02% Serbian3 0.02% Danish
Geographical mobility in Hilton Head Island Same house 1 year ago 25,747 84.8% White (Caucasian)2,480 89.9% Black or African American4 100.0% American Indian / Alaska Native297 95.6% Asian8 100.0% Native Hawaiian / Pacific Islander3,041 93.4% Other race2,527 82.0% Two or more races24,995 84.4% White alone, not Hispanic / Latino4,516 84.2% Hispanic or LatinoMoved within same county 1,058 3.5% White / Caucasian194 7.0% Black or African American97 3.0% Other race41 1.3% Two or more races1,011 3.4% White alone, not Hispanic / Latino160 3.0% Hispanic or LatinoMoved within same state 560 1.8% White / Caucasian36 1.3% Black or African American113 3.7% Two or more races560 1.9% White alone, not Hispanic / Latino79 1.5% Hispanic or LatinoMoved from different state 2,683 8.8% White / Caucasian10 3.1% Asian84 2.6% Other race423 13.7% Two or more races2,796 9.4% White alone, not Hispanic / Latino313 5.8% Hispanic or LatinoMoved from abroad 99 0.3% White15 0.5% Other race69 0.2% White alone, not Hispanic / Latino14 0.3% Hispanic or Latino
Children Nativity (place of birth) in Hilton Head Island
Children under 6 years - Living with two parents Both parents native 210 100.0% NativeBoth parents foreign-born 63 73.5% Native23 26.5% Foreign-bornOne native, one foreign-born parent 445 100.0% NativeChildren under 6 years - Living with one parent Native parent 261 100.0% NativeForeign-born parent 90 92.3% Native7 7.7% Foreign-bornChildren 6 to 17 years - Living with two parents Both parents native 1,154 98.8% Native14 1.2% Foreign-bornBoth parents foreign-born 387 90.0% Native43 10.0% Foreign-bornOne native, one foreign-born parent 296 100.0% NativeChildren 6 to 17 years - Living with one parent Native parent 858 100.0% NativeForeign-born parent 278 58.6% Native196 41.4% Foreign-born
Grandparents responsible for own grandchildren in Hilton Head Island
Grandparents (30 to 59 years) White / Caucasian 32 35.1% Responsible for grandchildren60 64.9% Not responsible for grandchildrenTwo or more races 24 100.0% Responsible for grandchildrenWhite alone, not Hispanic / Latino 32 100.0% Not responsible for grandchildrenHispanic or Latino 49 52.5% Responsible for grandchildren45 47.5% Not responsible for grandchildrenGrandparents (60 years and over) White / Caucasian 66 57.9% Responsible for grandchildren48 42.1% Not responsible for grandchildrenWhite alone, not Hispanic / Latino 67 57.5% Responsible for grandchildren50 42.5% Not responsible for grandchildrenHispanic or Latino 10 19.9% Responsible for grandchildren40 80.1% Not responsible for grandchildren