Hershey, PA (Pennsylvania) Houses and Residents
| Hershey: | $341,345 |
| Pennsylvania: | $245,500 |
Mean price in 2022:
Detached houses: $383,554
Here: $383,554 State: $317,202 Townhouses or other attached units: $318,007
Here: $318,007 State: $254,369 In 2-unit structures: $108,205
Here: $108,205 State: $249,182 In 3-to-4-unit structures: $392,367
Here: $392,367 State: $297,446 In 5-or-more-unit structures: $167,329
Here: $167,329 State: $320,068
Total population: 14,257 (Urban population: 12,164, Rural population: 613 (all nonfarm))
Houses: 5,965 (5,686 occupied: 3,288 owner occupied, 2,558 renter occupied)
| % of renters here: | 44% |
| State: | 31% |
Housing density: 414 houses/condos per square mile
Median price asked for vacant for-sale houses and condos in 2022: $294,674.
Median contract rent in 2022: $1,044 (lower quartile is $950, upper quartile is $1,231)
Median rent asked for vacant for-rent units in 2022: $1,556
Median gross rent in Hershey, PA in 2022: $1,176
Housing units in Hershey with a mortgage: 2,043 (146 second mortgage, 0 home equity loan, 124 both second mortgage and home equity loan)
Houses without a mortgage: 58
Median household income for houses/condos with a mortgage: $118,528
Median household income for apartments without a mortgage: $126,505
Median monthly housing costs: $1,241
Compare current foreclosures near Hershey, PA:
| Photo | Address | Area | Beds / Baths | Price | Details |
|---|---|---|---|---|---|

|
#1
Sunny Ln
Hershey, PA 17033
|
1,915 sq. feet
|
1 baths 2 beds |
show details | |

|
#2
Sand Hill Rd
Hershey, PA 17033
|
1,896 sq. feet
|
2 baths 4 beds |
show details | |

|
#3
Concord Ct
Hershey, PA 17033
|
2,437 sq. feet
|
2 baths 3 beds |
show details | |

|
#4
E Caracas Ave
Hershey, PA 17033
|
1,296 sq. feet
|
2 baths 4 beds |
show details | |

|
#5
E Caracas Ave
Hershey, PA 17033
|
988 sq. feet
|
1 baths 2 beds |
show details | |

|
#6
Penzance Rd
Hershey, PA 17033
|
3,077 sq. feet
|
3 baths 4 beds |
show details | |

|
#7
Brookside Ave
Hershey, PA 17033
|
2,040 sq. feet
|
2 baths 4 beds |
show details | |

|
#8
Colebrook Rd
Hershey, PA 17033
|
2,994 sq. feet
|
3 baths 4 beds |
show details | |

|
#9
Elizabethtown Rd
Hershey, PA 17033
|
1,074 sq. feet
|
1 baths - beds |
show details | |

|
#10
Clark Rd
Hershey, PA 17033
|
- sq. feet
|
- baths - beds |
show details |
| Photo | Address | Area | Beds / Baths | Price | Details |
|---|---|---|---|---|---|

|
#11
Homestead Ln
Hershey, PA 17033
|
- sq. feet
|
- baths - beds |
show details | |

|
#12
Townhouse
Hershey, PA 17033
|
- sq. feet
|
- baths - beds |
show details | |

|
#13
W Granada Ave
Hershey, PA 17033
|
- sq. feet
|
- baths - beds |
show details | |

|
#14
International Ln
Hershey, PA 17033
|
- sq. feet
|
- baths - beds |
show details | |

|
#15
Randolph St
Harrisburg, PA 17104
|
1,220 sq. feet
|
1 baths 3 beds |
show details | |

|
#16
Moore Rd
Lebanon, PA 17046
|
1,196 sq. feet
|
1 baths 3 beds |
show details | |

|
#17
2nd St
Lemoyne, PA 17043
|
1,120 sq. feet
|
1 baths 2 beds |
show details | |

|
#18
Orchard Rd
Mount Joy, PA 17552
|
1,120 sq. feet
|
1 baths 3 beds |
show details | |

|
#19
Hill St
Mount Joy, PA 17552
|
1,276 sq. feet
|
3 baths 3 beds |
show details | |

|
#20
Governor Stable Rd
Bainbridge, PA 17502
|
1,599 sq. feet
|
2 baths 3 beds |
show details |
| Photo | Address | Area | Beds / Baths | Price | Details |
|---|---|---|---|---|---|

|
#21
S 16th St
Harrisburg, PA 17104
|
800 sq. feet
|
1 baths 2 beds |
show details | |

|
#22
E High St
Elizabethtown, PA 17022
|
1,276 sq. feet
|
2 baths 3 beds |
show details | |

|
#23
Main St
Harrisburg, PA 17113
|
1,205 sq. feet
|
1 baths 4 beds |
show details | |

|
#24
N 5th St
Harrisburg, PA 17110
|
1,815 sq. feet
|
1 baths 4 beds |
show details | |

|
#25
Heatherfield Way
Harrisburg, PA 17112
|
1,308 sq. feet
|
2 baths 3 beds |
show details | |

|
#26
Park St
Harrisburg, PA 17103
|
1,820 sq. feet
|
1 baths 5 beds |
show details | |

|
#27
E Elm St
Lebanon, PA 17042
|
1,156 sq. feet
|
1 baths 3 beds |
show details | |

|
#28
N 2nd St
Lemoyne, PA 17043
|
1,520 sq. feet
|
1 baths 3 beds |
show details | |

|
#29
Old Line Rd
Manheim, PA 17545
|
1,184 sq. feet
|
2 baths 3 beds |
show details | |

|
#30
Heisey Ave
Elizabethtown, PA 17022
|
1,072 sq. feet
|
1 baths 3 beds |
show details |
| Photo | Address | Area | Beds / Baths | Price | Details |
|---|---|---|---|---|---|

|
#31
Conewago Ave
Manchester, PA 17345
|
768 sq. feet
|
1 baths 2 beds |
show details | |

|
#32
Groff Ave
Elizabethtown, PA 17022
|
1,384 sq. feet
|
1 baths 4 beds |
show details | |

|
#33
State Route 72
Jonestown, PA 17038
|
1,517 sq. feet
|
2 baths 4 beds |
show details | |

|
#34
Laurel Grove Rd
Annville, PA 17003
|
1,176 sq. feet
|
1 baths 3 beds |
show details | |

|
#35
Hilltop View Way
Elizabethtown, PA 17022
|
1,092 sq. feet
|
1 baths 3 beds |
show details | |

|
#36
2nd St
Enola, PA 17025
|
1,488 sq. feet
|
2 baths 3 beds |
show details | |

|
#37
Front St
Enola, PA 17025
|
2,092 sq. feet
|
3 baths 4 beds |
show details | |

|
#38
S 18th St
Camp Hill, PA 17011
|
1,064 sq. feet
|
1 baths 3 beds |
show details | |

|
#39
Terrace Ct
Harrisburg, PA 17111
|
1,531 sq. feet
|
3 baths 3 beds |
show details | |

|
#40
College Ave
Elizabethtown, PA 17022
|
1,419 sq. feet
|
1 baths 3 beds |
show details |
| Photo | Address | Area | Beds / Baths | Price | Details |
|---|---|---|---|---|---|

|
#41
Race St
Bainbridge, PA 17502
|
1,290 sq. feet
|
3 baths 3 beds |
show details | |

|
#42
East Cumberland Aka 517 E Cumberland St
Lebanon, PA 17042
|
1,580 sq. feet
|
2 baths 3 beds |
show details | |

|
#43
Mulberry St
Harrisburg, PA 17104
|
1,683 sq. feet
|
1 baths 4 beds |
show details | |

|
#44
E Washington St
Elizabethtown, PA 17022
|
1,578 sq. feet
|
1 baths 3 beds |
show details | |

|
#45
Donegal Springs Rd
Mount Joy, PA 17552
|
1,532 sq. feet
|
2 baths 3 beds |
show details | |

|
#46
Green St
Harrisburg, PA 17102
|
2,412 sq. feet
|
1 baths 5 beds |
show details | |

|
#47
S Lancaster St
Lebanon, PA 17046
|
900 sq. feet
|
1 baths 3 beds |
show details | |

|
#48
N Market St
Elizabethtown, PA 17022
|
1,656 sq. feet
|
1 baths 3 beds |
show details | |

|
#49
Harrisburg Ave
Mount Joy, PA 17552
|
720 sq. feet
|
1 baths 2 beds |
show details | |

|
Check over 1 million property listings on Foreclosure.com!
|
browse all offers | |||

Latest news about housing in Hershey, PA collected exclusively by city-data.com from local newspapers, TV, and radio stations


Median year apartment built: 1972
Household type by relationship:
Households: 14,820- Male householders: 2,658 (636 living alone), Female householders: 3,027 (1,168 living alone)
2,792 spouses (2,772 opposite-sex spouses), 270 unmarried partners, (254 opposite-sex unmarried partners), 3,465 children (3,285 natural, 112 adopted, 67 stepchildren), 31 grandchildren, 20 brothers or sisters, 108 parents, 0 foster children, 293 other relatives, 348 non-relatives
- In group quarters: 1,804
Size of family households: 1,919 2-persons, 575 3-persons, 544 4-persons, 387 5-persons, 27 6-persons, 39 7-or-more-persons.
Size of nonfamily households: 1,855 1-person, 530 2-persons, 23 3-persons.
2,019 married couples with children.
634 single-parent households (206 men, 428 women).
81.6% of residents of Hershey speak English at home.
11.2% of residents speak Spanish at home (36% speak English very well, 1% speak English well, 63% speak English not well).
3.1% of residents speak other Indo-European language at home (79% speak English very well, 13% speak English well, 4% speak English not well, 4% don't speak English at all).
3.8% of residents speak Asian or Pacific Island language at home (68% speak English very well, 26% speak English well, 3% speak English not well, 3% don't speak English at all).
0.9% of residents speak other language at home (100% speak English very well).
Foreign born population: 2,282 (15.4%)
(30.1% of them are naturalized citizens)
| Here: | 7.3 |
| State: | 6.8 |
| Here: | 4.2 |
| State: | 4.3 |

- Bedrooms in owner-occupied houses and condos in Hershey, Pennsylvania
- 0no bedroom
- 01 bedroom
- 4642 bedrooms
- 1,5693 bedrooms
- 9294 bedrooms
- 3275+ bedrooms

- Bedrooms in renter-occupied apartments in Hershey, Pennsylvania
- 64no bedroom
- 6471 bedroom
- 1,2102 bedrooms
- 6163 bedrooms
- 84 bedrooms
- 135+ bedrooms

- Cars and other vehicles available in Hershey in owner-occupied houses/condos
- 25no vehicle
- 6971 vehicle
- 1,5912 vehicles
- 6733 vehicles
- 1394 vehicles
- 1645+ vehicles

- Cars and other vehicles available in Hershey in renter-occupied apartments
- 303no vehicle
- 1,5851 vehicle
- 5842 vehicles
- 593 vehicles
- 274 vehicles
- 05+ vehicles

- Rooms in owner-occupied houses in Hershey, Pennsylvania
- 01 room
- 02 rooms
- 03 rooms
- 3774 rooms
- 3625 rooms
- 6416 rooms
- 3367 rooms
- 3898 rooms
- 1,1839+ rooms

- Rooms in renter-occupied apartments in Hershey, Pennsylvania
- 641 room
- 552 rooms
- 4703 rooms
- 8604 rooms
- 4315 rooms
- 3796 rooms
- 1557 rooms
- 398 rooms
- 1069+ rooms


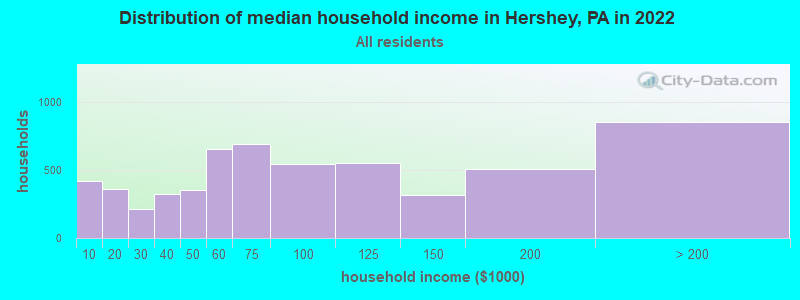
Hershey, PA household income distribution

- 417Less than $10,000
- 359$10,000 to $19,999
- 216$20,000 to $29,999
- 325$30,000 to $39,999
- 352$40,000 to $49,999
- 655$50,000 to $59,999
- 697$60,000 to $74,999
- 547$75,000 to $99,999
- 551$100,000 to $124,999
- 314$125,000 to $149,999
- 506$150,000 to $199,999
- 856$200,000 or more
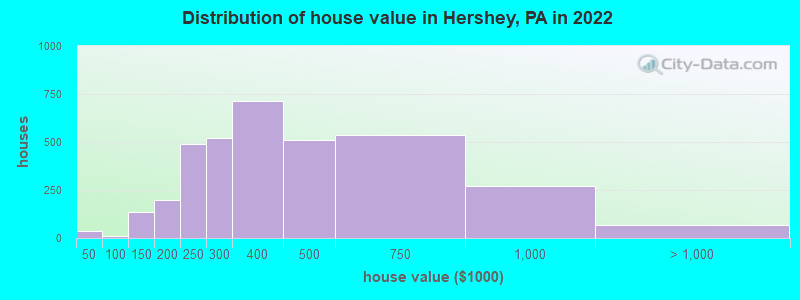
Home value of owner - occupied houses in 2022 in Hershey, PA
-
- 10$15,000 to $19,999
- 28$20,000 to $24,999
- 7$70,000 to $79,999
- 79$100,000 to $124,999
- 54$125,000 to $149,999
- 46$150,000 to $174,999
- 149$175,000 to $199,999
- 488$200,000 to $249,999
- 523$250,000 to $299,999
- 716$300,000 to $399,999
- 509$400,000 to $499,999
- 538$500,000 to $749,999
- 269$750,000 to $999,999
- 67$1,000,000 to $1,499,999
Rent paid by renters in 2022 in Hershey, PA
-
- 3$200 to $249
- 46$250 to $299
- 20$300 to $349
- 2$350 to $399
- 14$400 to $449
- 9$450 to $499
- 9$500 to $549
- 9$550 to $599
- 30$600 to $649
- 129$650 to $699
- 26$700 to $749
- 47$750 to $799
- 262$800 to $899
- 511$900 to $999
- 893$1,000 to $1,249
- 362$1,250 to $1,499
- 101$1,500 to $1,999
- 18$2,000 to $2,499
- 23$3,000 to $3,499
- 42$3,500 or more
- 72No cash rent

Percentage of workers working in this county: 72.8%
Number of people working at home: 2,229 (28.0% of all workers)
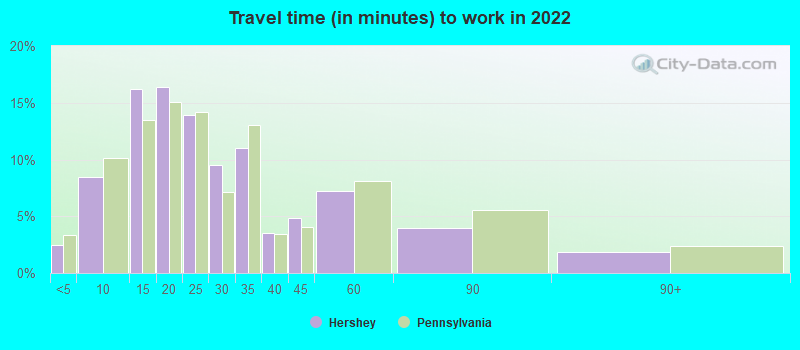
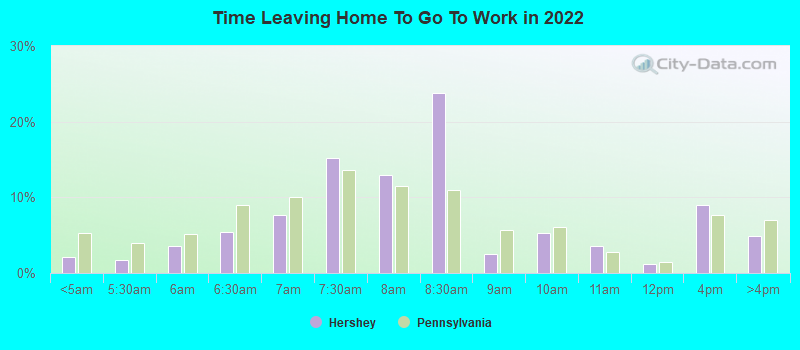
Travel time to work (commute)
- Less than 5 minutes: 1,341
- 5 to 9 minutes: 1,088
- 10 to 14 minutes: 851
- 15 to 19 minutes: 594
- 20 to 24 minutes: 530
- 25 to 29 minutes: 557
- 30 to 34 minutes: 500
- 35 to 39 minutes: 194
- 40 to 44 minutes: 251
- 45 to 59 minutes: 147
- 60 to 89 minutes: 68
- 90 or more minutes: 125
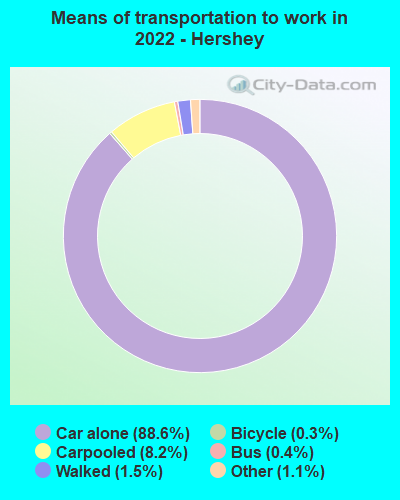
Means of transportation to work:
- Drove a car alone: 22,040 (79.9%)
- Carpooled: 1,766 (6.4%)
- Bus: 97 (0.4%)
- Taxi: 374 (1.4%)
- Bicycle: 46 (0.2%)
- Walked: 396 (1.4%)
- Worked at home: 2,229 (8.1%)
- Unemployment by race in 2022
- Unemployment rate for White non-Hispanic residents
- 2.2%Males
- 1.4%Females
- Unemployment rate for Black residents
- 27.2%Males
- Unemployment rate for Asian residents
- 3.2%Females
- Unemployment rate for other race residents
- 1.7%Males
- Unemployment rate for two or more race residents
- 12.4%Males
- 38.1%Females
- Unemployment rate for Hispanic or Latino residents
- 5.0%Males
- 10.4%Females

- Year of entry for the foreign-born population in Hershey, Pennsylvania
- 6382010 or later
- 2262000 to 2009
- 8821990 to 1999
- 1201980 to 1989
- 1111970 to 1979
- 197Before 1970
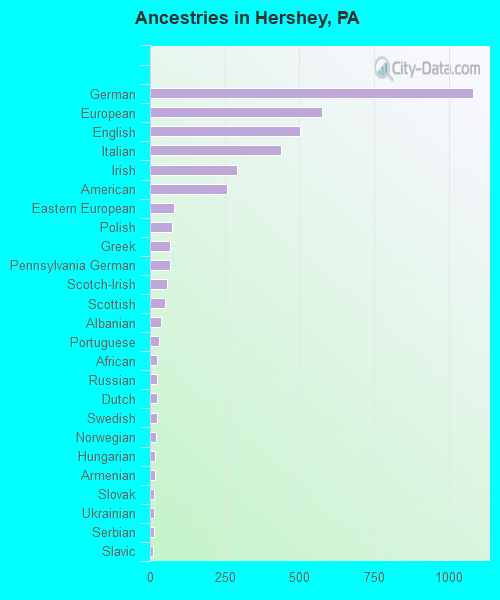
First ancestries reported:
- German: 1,081 (17.5%)
- European: 575 (9.3%)
- English: 503 (8.1%)
- Italian: 438 (7.1%)
- Irish: 290 (4.7%)
- American: 258 (4.2%)
- Eastern European: 81 (1.3%)
- Polish: 74 (1.2%)
- Greek: 67 (1.1%)
- Pennsylvania German: 66 (1.1%)
- Scotch-Irish: 56 (0.9%)
- Scottish: 51 (0.8%)
- Albanian: 36 (0.6%)
- Portuguese: 31 (0.5%)
- African: 25 (0.4%)
- Russian: 23 (0.4%)
- Dutch: 22 (0.4%)
- Swedish: 22 (0.4%)
- Norwegian: 19 (0.3%)
- Hungarian: 17 (0.3%)
- Armenian: 16 (0.3%)
- Slovak: 15 (0.2%)
- Ukrainian: 13 (0.2%)
- Serbian: 12 (0.2%)
- Slavic: 11 (0.2%)
- Egyptian: 10 (0.2%)
- Austrian: 10 (0.2%)
- Swiss: 8 (0.1%)
- Belgian: 7 (0.1%)
- Brazilian: 7 (0.1%)
- Croatian: 5 (0.08%)
Most common places of birth for foreign-born residents (%):
| Hershey: | 42.4% (829) |
| Pennsylvania: | 5.8% (54,190) |
| Hershey: | 8.5% (166) |
| Pennsylvania: | 7.2% (67,704) |
| Hershey: | 6.5% (128) |
| Pennsylvania: | 10.7% (100,596) |
| Hershey: | 6.0% (118) |
| Pennsylvania: | 1.2% (11,211) |
| Hershey: | 2.6% (50) |
| Pennsylvania: | 1.4% (13,268) |
| Hershey: | 2.3% (45) |
| Pennsylvania: | 2.2% (21,039) |
| Hershey: | 2.1% (42) |
| Pennsylvania: | 1.4% (13,077) |
| Hershey: | 2.0% (40) |
| Pennsylvania: | 3.3% (31,542) |
| Hershey: | 1.8% (36) |
| Pennsylvania: | 1.0% (9,386) |
| Hershey: | 1.6% (31) |
| Pennsylvania: | 1.1% (10,331) |
| Hershey: | 1.6% (31) |
| Pennsylvania: | 0.6% (6,097) |
| Hershey: | 1.5% (30) |
| Pennsylvania: | 0.4% (4,204) |
Place of birth for U.S.-born residents:
- This state: 7,061
- Other state: 5,328
- Northeast: 2,105
- Midwest: 1,160
- South: 1,225
- West: 670
78.0% of Hershey residents lived in the same house 1 years ago.
Out of people who lived in different houses, 24.0% lived in this county.
Out of people who lived in different counties, 69.7% lived in Pennsylvania.
| Hershey: | 78.0% |
| State average: | 89.3% |
Education attainment for males 25 years and older:
- No schooling: 4
- Nursery to 4th grade: 0
- 5th and 6th grade: 546
- 7th and 8th grade: 46
- 9th grade: 4
- 10th grade: 10
- 11th grade: 3
- 12th grade, no diploma: 59
- High school graduate (or equivalency): 882
- Less than 1 year of college: 156
- Some college more than 1 year, no degree: 373
- Associate degree: 154
- Bachelor's degree: 1,417
- Master's degree: 606
- Professional school degree: 370
- Doctorate degree: 451

Education attainment for females 25 years and older:
- No schooling: 19
- Nursery to 4th grade: 0
- 5th and 6th grade: 8
- 7th and 8th grade: 12
- 9th grade: 12
- 10th grade: 88
- 11th grade: 8
- 12th grade, no diploma: 23
- High school graduate (or equivalency): 929
- Less than 1 year of college: 224
- Some college more than 1 year, no degree: 415
- Associate degree: 981
- Bachelor's degree: 1,626
- Master's degree: 849
- Professional school degree: 412
- Doctorate degree: 169


Housing units in structures:
- One, detached: 2,836
- One, attached: 1,030
- Two: 273
- 3 or 4: 360
- 5 to 9: 425
- 10 to 19: 353
- 20 to 49: 175
- 50 or more: 502
- Mobile homes: 7
Housing units lacking complete kitchen facilities in 2022: 1.4%
House/condo owner moved in on average 12 years ago
Renter moved in on average 2 years ago

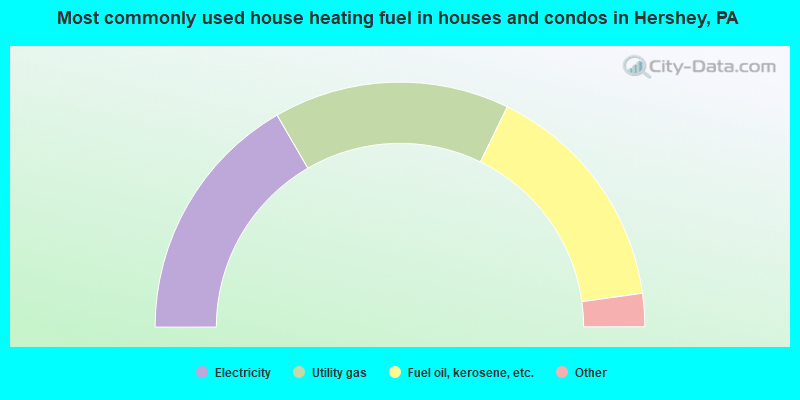
- 33.3%Electricity
- 31.2%Utility gas
- 31.2%Fuel oil, kerosene, etc.
- 2.7%Bottled, tank, or LP gas
- 0.9%Coal or coke
- 0.4%Wood
- 0.3%Other fuel
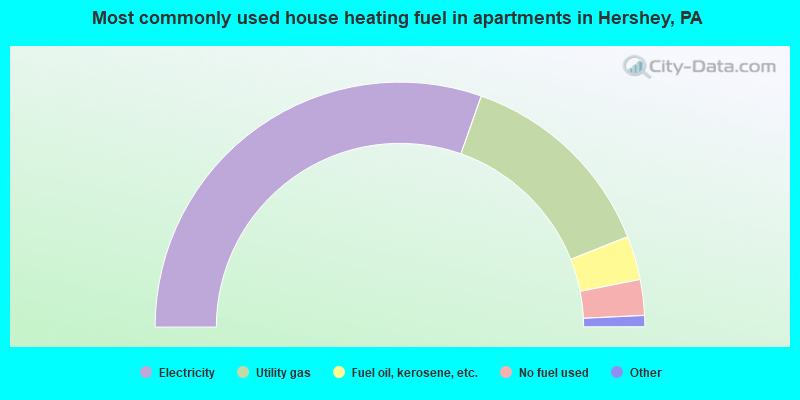
- 60.8%Electricity
- 27.2%Utility gas
- 5.8%Fuel oil, kerosene, etc.
- 4.7%No fuel used
- 1.1%Bottled, tank, or LP gas
- 0.4%Other fuel
Private vs. public school enrollment:
| Here: | 17.6% |
| Pennsylvania: | 15.7% |
| Here: | 8.8% |
| Pennsylvania: | 13.4% |
| Here: | 39.0% |
| Pennsylvania: | 39.8% |


