Gulf Gate Estates, FL (Florida) Houses and Residents
Estimated median house or condo value in 2022: $370,024 (it was $101,900 in 2000 )
Gulf Gate Estates:
$370,024Florida:
$354,100
Lower value quartile - upper value quartile: $285,751 - $473,892Mean price in 2022: Detached houses: $361,939 Here:
$361,939State:
$500,941
Townhouses or other attached units: $206,149 Here:
$206,149State:
$370,869
In 2-unit structures: $280,358 Here:
$280,358State:
$423,188
In 3-to-4-unit structures: $222,525 Here:
$222,525State:
$309,944
In 5-or-more-unit structures: $204,165 Here:
$204,165State:
$447,145
Mobile homes: $116,623 Here:
$116,623State:
$113,202
Total population: 10,911 (All urban)
Houses: 7,572 (5,883 occupied: 3,384 owner occupied, 2,604 renter occupied )
% of renters here:
43%State:
33%
Housing density: 2,693 houses/condos per square mile
Median price asked for vacant for-sale houses and condos in 2022: $573,049.
Median contract rent in 2022: $1,695 (lower quartile is $1,328, upper quartile is over $2,000)
Median rent asked for vacant for-rent units in 2022: $1,891
Median gross rent in Gulf Gate Estates, FL in 2022: $1,787
Housing units in Gulf Gate Estates with a mortgage: 1,730 (59 second mortgage, 210 home equity loan, 0 both second mortgage and home equity loan )Houses without a mortgage: 1,436
Median household income for houses/condos with a mortgage: $79,694
Median household income for apartments without a mortgage: $60,016
Median monthly housing costs: $1,317
Data:
Median house or condo value ($)
Median house or condo value ($ change since 2000)
Median house or condo value ($) - White
Median house or condo value ($) - Black or African American
Median house or condo value ($) - Asian
Median house or condo value ($) - Hispanic or Latino
Median house or condo value ($) - American Indian and Alaska Native
Median house or condo value ($) - Multirace
Median house or condo value ($) - Other Race
Median price asked for mobile homes ($)
Household density (households per square mile)
Mean house or condo value by units in structure - 1, detached ($)
Mean house or condo value by units in structure - 1, attached ($)
Mean house or condo value by units in structure - 2 ($)
Mean house or condo value by units in structure by units in structure - 3 or 4 ($)
Mean house or condo value by units in structure - 5 or more ($)
Mean house or condo value by units in structure - Boat, RV, van, etc. ($)
Mean house or condo value by units in structure - Mobile home ($)
Median contract rent ($)
Median contract rent - Lower quartile ($)
Median contract rent - Upper quartile ($)
Median gross rent ($)
Urban houses (%)
Rural houses (%)
Houses occupied (%)
Houses occupied (% change since 2000)
Houses owner occupied (%)
Houses owner occupied (% change since 2000)
Houses renter occupied (%)
Houses renter occupied (% change since 2000)
Vacant housing units - For rent (%)
Vacant housing units - For rent (% change since 2000)
Vacant housing units - For sale only (%)
Vacant housing units - For sale only (% change since 2000)
Vacant housing units - Rented or sold, not occupied (%)
Vacant housing units - Rented or sold, not occupied (% change since 2000)
Vacant housing units - For seasonal, recreational, or occasional use (%)
Vacant housing units - For seasonal, recreational, or occasional use (% change since 2000)
Vacant housing units - For migrant workers (%)
Vacant housing units - For migrant workers (% change since 2000)
Vacant housing units - Other vacant (%)
Vacant housing units - Other vacant (% change since 2000)
Median monthly housing costs ($)
Median household income for houses/condos with a mortgage ($)
Median household income for houses/condos without a mortgage ($)
Median household income ($)
Median household income ($) - White
Median household income ($) - Black or African American
Median household income ($) - Asian
Median household income ($) - Hispanic or Latino
Median household income ($) - American Indian and Alaska Native
Median household income ($) - Multirace
Median household income ($) - Other Race
Mortgage status - with mortgage (%)
Mortgage status - with second mortgage (%)
Mortgage status - with home equity loan (%)
Mortgage status - with both second mortgage and home equity loan (%)
Mortgage status - without a mortgage (%)
Median year house/condo built
Median year apartment built
Household type by relationship - Male householder living alone (%)
Household type by relationship - Male householder not living alone (%)
Household type by relationship - Female householder living alone (%)
Household type by relationship - Female householder not living alone (%)
Household type by relationship - Opposite-Sex spouse (%)
Household type by relationship - Same-Sex spouse (%)
Household type by relationship - Opposite-Sex unmarried partner (%)
Household type by relationship - Same-Sex unmarried partner (%)
Household type by relationship - In group quarters (%)
Size of family households - 2-person household (%)
Size of family households - 3-person household (%)
Size of family households - 4-person household (%)
Size of family households - 5-person household (%)
Size of family households - 6-person household (%)
Size of family households - 7-or-more-person household (%)
Size of nonfamily households - 1-person household (%)
Size of nonfamily households - 2-person household (%)
Size of nonfamily households - 3-person household (%)
Size of nonfamily households - 4-person household (%)
Size of nonfamily households - 5-person household (%)
Size of nonfamily households - 6-person household (%)
Size of nonfamily households - 7-or-moreperson household (%)
Year house built - Built 2010 or later (%)
Year house built - Built 2000 to 2009 (%)
Year house built - Built 1990 to 1999 (%)
Year house built - Built 1980 to 1989 (%)
Year house built - Built 1970 to 1979 (%)
Year house built - Built 1960 to 1969 (%)
Year house built - Built 1950 to 1959 (%)
Year house built - Built 1940 to 1949 (%)
Year house built - Built 1939 or earlier (%)
Median number of rooms in houses and condos
Median number of rooms in apartments
Median number of bedrooms in owner occupied houses
Mean number of bedrooms in owner occupied houses
Median number of bedrooms in renter occupied houses
Mean number of bedrooms in renter occupied houses
Median number of vehichles in owner occupied houses
Mean number of vehichles in owner occupied houses
Median number of vehichles in renter occupied houses
Mean number of vehichles in renter occupied houses
Rooms in owner-occupied houses - 1 room (%)
Rooms in owner-occupied houses - 2 rooms (%)
Rooms in owner-occupied houses - 3 rooms (%)
Rooms in owner-occupied houses - 4 rooms (%)
Rooms in owner-occupied houses - 5 rooms (%)
Rooms in owner-occupied houses - 6 rooms (%)
Rooms in owner-occupied houses - 7 rooms (%)
Rooms in owner-occupied houses - 8 rooms (%)
Rooms in owner-occupied houses - 9+ rooms (%)
Rooms in renter-occupied houses - 1 room (%)
Rooms in renter-occupied houses - 2 rooms (%)
Rooms in renter-occupied houses - 3 rooms (%)
Rooms in renter-occupied houses - 4 rooms (%)
Rooms in renter-occupied houses - 5 rooms (%)
Rooms in renter-occupied houses - 6 rooms (%)
Rooms in renter-occupied houses - 7 rooms (%)
Rooms in renter-occupied houses - 8 rooms (%)
Rooms in renter-occupied houses - 9+ rooms (%)
Bedrooms in owner-occupied houses - no bedrooms (%)
Bedrooms in owner-occupied houses - 1 bedroom (%)
Bedrooms in owner-occupied houses - 2 bedrooms (%)
Bedrooms in owner-occupied houses - 3 bedrooms (%)
Bedrooms in owner-occupied houses - 4 bedrooms (%)
Bedrooms in owner-occupied houses - 5+ bedrooms (%)
Bedrooms in renter-occupied houses - no bedrooms (%)
Bedrooms in renter-occupied houses - 1 bedroom (%)
Bedrooms in renter-occupied houses - 2 bedrooms (%)
Bedrooms in renter-occupied houses - 3 bedrooms (%)
Bedrooms in renter-occupied houses - 4 bedrooms (%)
Bedrooms in renter-occupied houses - 5+ bedrooms (%)
Vehicles available in owner-occupied houses - no vehicle available (%)
Vehicles available in owner-occupied houses - 1 vehicle available(%)
Vehicles available in owner-occupied houses - 2 Vehicles available (%)
Vehicles available in owner-occupied houses - 3 Vehicles available (%)
Vehicles available in owner-occupied houses - 4 Vehicles available (%)
Vehicles available in owner-occupied houses - 5+ Vehicles available (%)
Vehicles available in renter-occupied houses - no vehicle available (%)
Vehicles available in renter-occupied houses - 1 vehicle available (%)
Vehicles available in renter-occupied houses - 2 Vehicles available (%)
Vehicles available in renter-occupied houses - 3 Vehicles available (%)
Vehicles available in renter-occupied houses - 4 Vehicles available (%)
Vehicles available in renter-occupied houses - 5+ Vehicles available (%)
Housing units in structures - 1, detached (%)
Housing units in structures - 1, attached (%)
Housing units in structures - 2 (%)
Housing units in structures - 3 or 4 (%)
Housing units in structures - 5 to 9 (%)
Housing units in structures - 10 to 19 (%)
Housing units in structures - 20 to 49 (%)
Housing units in structures - 50 or more (%)
Housing units in structures - Mobile home (%)
Housing units in structures - Boat, RV, van, etc. (%)
Housing units in structures - Owners - 1, detached (%)
Housing units in structures - Owners - 1, attached (%)
Housing units in structures - Owners - 2 (%)
Housing units in structures - Owners - 3 or 4 (%)
Housing units in structures - Owners - 5 to 9 (%)
Housing units in structures - Owners - 10 to 19 (%)
Housing units in structures - Owners - 20 to 49 (%)
Housing units in structures - Owners - 50 or more (%)
Housing units in structures - Owners - Mobile home (%)
Housing units in structures - Owners - Boat, RV, van, etc. (%)
Housing units in structures - Renters - 1, detached (%)
Housing units in structures - Renters - 1, attached (%)
Housing units in structures - Renters - 2 (%)
Housing units in structures - Renters - 3 or 4 (%)
Housing units in structures - Renters - 5 to 9 (%)
Housing units in structures - Renters - 10 to 19 (%)
Housing units in structures - Renters - 20 to 49 (%)
Housing units in structures - Renters - 50 or more (%)
Housing units in structures - Renters - Mobile home (%)
Housing units in structures - Renters - Boat, RV, van, etc. (%)
House/condo owner moved in on average (years ago)
Renter moved in on average (years ago)
Year householder moved into unit - Moved in 1999 to March 2000 (%)
Year householder moved into unit - Moved in 1999 to March 2000 (%) - White
Year householder moved into unit - Moved in 1999 to March 2000 (%) - Black or African American
Year householder moved into unit - Moved in 1999 to March 2000 (%) - Asian
Year householder moved into unit - Moved in 1999 to March 2000 (%) - Hispanic or Latino
Year householder moved into unit - Moved in 1999 to March 2000 (%) - American Indian and Alaska Native
Year householder moved into unit - Moved in 1999 to March 2000 (%) - Multirace
Year householder moved into unit - Moved in 1999 to March 2000 (%) - Other Race
Year householder moved into unit - Moved in 1995 to 1998 (%)
Year householder moved into unit - Moved in 1995 to 1998 (%) - White
Year householder moved into unit - Moved in 1995 to 1998 (%) - Black or African American
Year householder moved into unit - Moved in 1995 to 1998 (%) - Asian
Year householder moved into unit - Moved in 1995 to 1998 (%) - Hispanic or Latino
Year householder moved into unit - Moved in 1995 to 1998 (%) - American Indian and Alaska Native
Year householder moved into unit - Moved in 1995 to 1998 (%) - Multirace
Year householder moved into unit - Moved in 1995 to 1998 (%) - Other Race
Year householder moved into unit - Moved in 1990 to 1994 (%)
Year householder moved into unit - Moved in 1990 to 1994 (%) - White
Year householder moved into unit - Moved in 1990 to 1994 (%) - Black or African American
Year householder moved into unit - Moved in 1990 to 1994 (%) - Asian
Year householder moved into unit - Moved in 1990 to 1994 (%) - Hispanic or Latino
Year householder moved into unit - Moved in 1990 to 1994 (%) - American Indian and Alaska Native
Year householder moved into unit - Moved in 1990 to 1994 (%) - Multirace
Year householder moved into unit - Moved in 1990 to 1994 (%) - Other Race
Year householder moved into unit - Moved in 1980 to 1989 (%)
Year householder moved into unit - Moved in 1980 to 1989 (%) - White
Year householder moved into unit - Moved in 1980 to 1989 (%) - Black or African American
Year householder moved into unit - Moved in 1980 to 1989 (%) - Asian
Year householder moved into unit - Moved in 1980 to 1989 (%) - Hispanic or Latino
Year householder moved into unit - Moved in 1980 to 1989 (%) - American Indian and Alaska Native
Year householder moved into unit - Moved in 1980 to 1989 (%) - Multirace
Year householder moved into unit - Moved in 1980 to 1989 (%) - Other Race
Year householder moved into unit - Moved in 1970 to 1979 (%)
Year householder moved into unit - Moved in 1970 to 1979 (%) - White
Year householder moved into unit - Moved in 1970 to 1979 (%) - Black or African American
Year householder moved into unit - Moved in 1970 to 1979 (%) - Asian
Year householder moved into unit - Moved in 1970 to 1979 (%) - Hispanic or Latino
Year householder moved into unit - Moved in 1970 to 1979 (%) - American Indian and Alaska Native
Year householder moved into unit - Moved in 1970 to 1979 (%) - Multirace
Year householder moved into unit - Moved in 1970 to 1979 (%) - Other Race
Year householder moved into unit - Moved in 1969 or earlier (%)
Year householder moved into unit - Moved in 1969 or earlier (%) - White
Year householder moved into unit - Moved in 1969 or earlier (%) - Black or African American
Year householder moved into unit - Moved in 1969 or earlier (%) - Asian
Year householder moved into unit - Moved in 1969 or earlier (%) - Hispanic or Latino
Year householder moved into unit - Moved in 1969 or earlier (%) - American Indian and Alaska Native
Year householder moved into unit - Moved in 1969 or earlier (%) - Multirace
Year householder moved into unit - Moved in 1969 or earlier (%) - Other Race
Housing units lacking complete plumbing facilities (%)
Housing units lacking complete kitchen facilities (%)
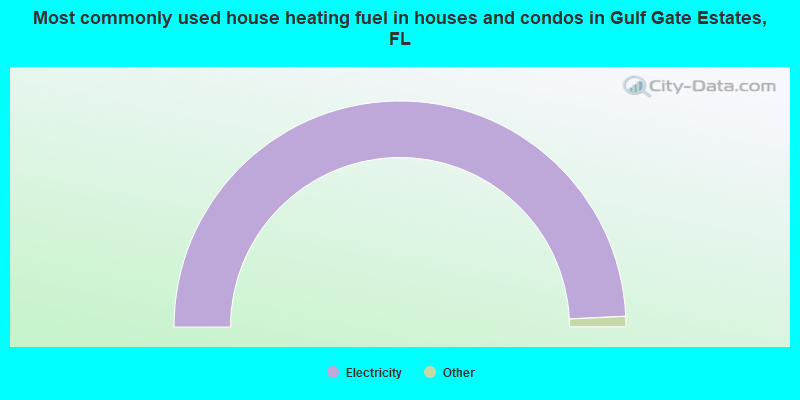
House heating fuel used in houses and condos - Utility gas (%)
House heating fuel used in houses and condos - Bottled, tank, or LP gas (%)
House heating fuel used in houses and condos - Electricity (%)
House heating fuel used in houses and condos - Fuel oil, kerosene, etc. (%)
House heating fuel used in houses and condos - Coal or coke (%)
House heating fuel used in houses and condos - Wood (%)
House heating fuel used in houses and condos - Solar energy (%)
House heating fuel used in houses and condos - Other fuel (%)
House heating fuel used in houses and condos - No fuel used (%)
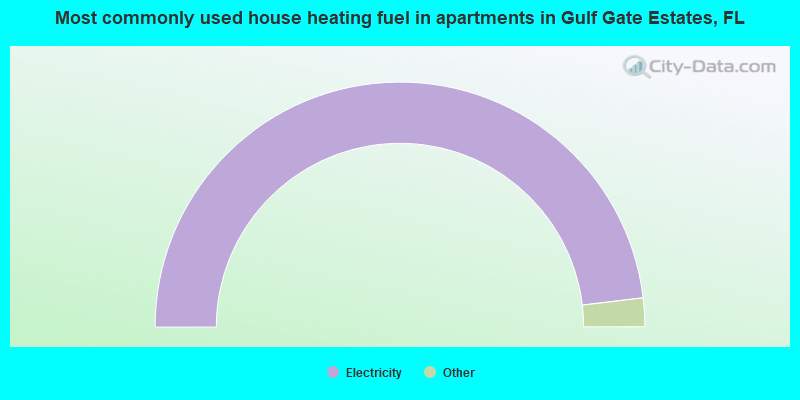
House heating fuel used in apartments - Utility gas (%)
House heating fuel used in apartments - Bottled, tank, or LP gas (%)
House heating fuel used in apartments - Electricity (%)
House heating fuel used in apartments - Fuel oil, kerosene, etc. (%)
House heating fuel used in apartments - Coal or coke (%)
House heating fuel used in apartments - Wood (%)
House heating fuel used in apartments - Solar energy (%)
House heating fuel used in apartments - Other fuel (%)
House heating fuel used in apartments - No fuel used (%)
Median year house/condo built: 1975Median year apartment built: 1976Household type by relationship:
Households: 11,825
Male householders: 2,573 (910 living alone ), Female householders: 3,181 (1,808 living alone )1,953 spouses (1,934 opposite-sex spouses ), 407 unmarried partners , (385 opposite-sex unmarried partners ), 2,389 children (2,137 natural , 78 adopted , 173 stepchildren ), 115 grandchildren , 163 brothers or sisters , 75 parents , 0 foster children , 168 other relatives , 448 non-relatives In group quarters: 346
Size of family households: 1,583 2-persons , 527 3-persons , 419 4-persons , 71 5-persons , 29 6-persons , 55 7-or-more-persons .
Size of nonfamily households: 2,791 1-person , 468 2-persons , 12 3-persons .
923 married couples with children. single-parent households (66 men , 706 women ).
87.0% of residents of Gulf Gate Estates speak English at home. of residents speak Spanish at home (48% speak English very well , 40% speak English well , 3% speak English not well , 9% don't speak English at all ).of residents speak other Indo-European language at home (84% speak English very well , 10% speak English well , 5% speak English not well ).of residents speak Asian or Pacific Island language at home (22% speak English very well , 56% speak English well , 22% speak English not well ).of residents speak other language at home (100% speak English very well ).
Foreign born population: 1,449 (12.2%)of them are naturalized citizens )
Median number of rooms in houses and condos:
Median number of rooms in apartments
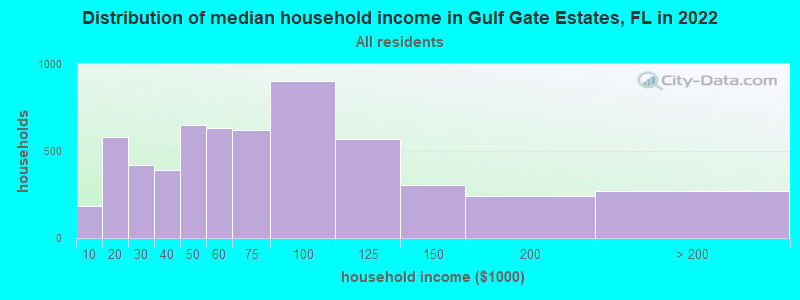
Gulf Gate Estates, FL household income distribution 182 Less than $10,000578 $10,000 to $19,999422 $20,000 to $29,999393 $30,000 to $39,999651 $40,000 to $49,999630 $50,000 to $59,999623 $60,000 to $74,999904 $75,000 to $99,999567 $100,000 to $124,999302 $125,000 to $149,999239 $150,000 to $199,999269 $200,000 or more
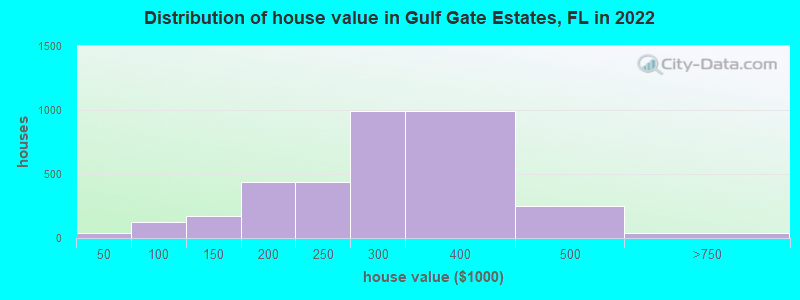
Home value of owner - occupied houses in 2022 in Gulf Gate Estates, FL 12 $15,000 to $19,99913 $20,000 to $24,99911 $30,000 to $34,9994 $40,000 to $49,9998 $50,000 to $59,99916 $60,000 to $69,99917 $70,000 to $79,99936 $80,000 to $89,99942 $90,000 to $99,99981 $100,000 to $124,99986 $125,000 to $149,999278 $150,000 to $174,999158 $175,000 to $199,999437 $200,000 to $249,999990 $250,000 to $299,999994 $300,000 to $399,999249 $400,000 to $499,99935 $500,000 to $749,999Rent paid by renters in 2022 in Gulf Gate Estates, FL 9 $100 to $14950 $150 to $1997 $250 to $29928 $450 to $49910 $500 to $54911 $600 to $64913 $700 to $74992 $750 to $799141 $800 to $899119 $900 to $999692 $1,000 to $1,249464 $1,250 to $1,499799 $1,500 to $1,99944 $2,000 to $2,49974 $3,000 to $3,49968 $3,500 or more86 No cash rent
Percentage of workers working in this county: 89.1%Number of people working at home: 779 (14.4% of all workers )
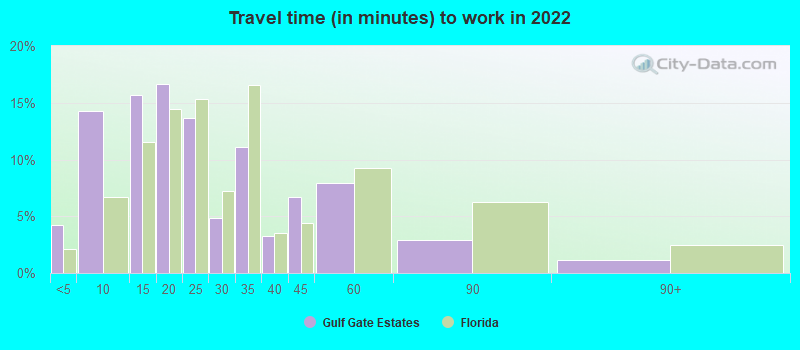
Travel time to work (commute)
Less than 5 minutes: 1445 to 9 minutes: 43410 to 14 minutes: 71315 to 19 minutes: 62020 to 24 minutes: 1,44125 to 29 minutes: 15930 to 34 minutes: 45735 to 39 minutes: 2940 to 44 minutes: 21545 to 59 minutes: 16360 to 89 minutes: 25490 or more minutes: 55
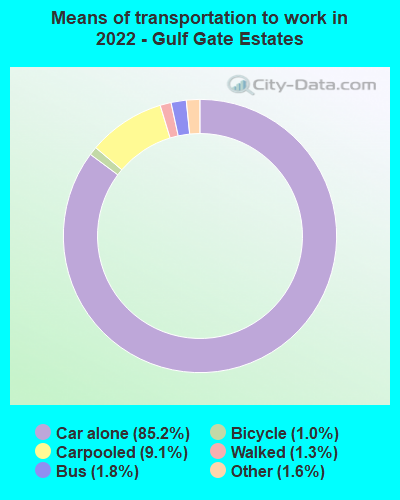
Means of transportation to work:
Drove a car alone: 3,715 (72.7%)Carpooled: 413 (8.1%)Bus : 50 (1.0%)Taxi: 97 (1.9%)Bicycle: 37 (0.7%)Walked: 65 (1.3%)Worked at home: 872 (17.1%)
Unemployment by race in 2022
Unemployment rate for White non-Hispanic residents 4.8% Males1.8% Females
Year of entry for the foreign-born population in Gulf Gate Estates, Florida
651 2010 or later 253 2000 to 2009 294 1990 to 1999 119 1980 to 1989 85 1970 to 1979 439 Before 1970
First ancestries reported:
American: 1,779 (28.8%)
English: 564 (9.1%)
German: 479 (7.8%)
Irish: 443 (7.2%)
Italian: 436 (7.1%)
Polish: 237 (3.8%)
South African: 118 (1.9%)
European: 93 (1.5%)
French: 70 (1.1%)
Eastern European: 69 (1.1%)
Dutch: 63 (1.0%)
Scottish: 63 (1.0%)
Scotch-Irish: 51 (0.8%)
Swedish: 51 (0.8%)
British: 49 (0.8%)
Hungarian: 42 (0.7%)
Brazilian: 37 (0.6%)
Northern European: 37 (0.6%)
Ukrainian: 34 (0.6%)
Russian: 27 (0.4%)
French Canadian: 23 (0.4%)
Welsh: 22 (0.4%)
Greek: 20 (0.3%)
Turkish: 20 (0.3%)
Slovak: 19 (0.3%)
Iranian: 18 (0.3%)
Canadian: 17 (0.3%)
Norwegian: 16 (0.3%)
Serbian: 14 (0.2%)
Swiss: 14 (0.2%)
Czech: 13 (0.2%)
Pennsylvania German: 11 (0.2%)
Romanian: 7 (0.1%)
Belizean: 7 (0.1%)
Finnish: 5 (0.08%) Most common places of birth for foreign-born residents (%): Colombia Gulf Gate Estates:
17.0% (247)Florida:
100.0% (-1)
Venezuela Gulf Gate Estates:
10.4% (151)Florida:
100.0% (-1)
Italy Gulf Gate Estates:
7.7% (112)Florida:
100.0% (-1)
England Gulf Gate Estates:
7.3% (106)Florida:
100.0% (-1)
Germany Gulf Gate Estates:
5.6% (82)Florida:
100.0% (-1)
South Africa Gulf Gate Estates:
5.5% (80)Florida:
100.0% (-1)
Mexico Gulf Gate Estates:
5.3% (77)Florida:
100.0% (-1)
Portugal Gulf Gate Estates:
3.9% (56)Florida:
100.0% (-1)
Poland Gulf Gate Estates:
3.3% (48)Florida:
100.0% (-1)
Brazil Gulf Gate Estates:
3.3% (48)Florida:
100.0% (-1)
Cuba Gulf Gate Estates:
3.2% (47)Florida:
100.0% (-1)
China, excluding Hong Kong and Taiwan Gulf Gate Estates:
3.0% (43)Florida:
100.0% (-1)
Ukraine Gulf Gate Estates:
2.9% (42)Florida:
100.0% (-1)
Canada Gulf Gate Estates:
2.5% (36)Florida:
100.0% (-1)
Chile Gulf Gate Estates:
2.1% (31)Florida:
100.0% (-1)
Place of birth for U.S.-born residents:
This state: 2,909Other state: 7,283Northeast: 3,199Midwest: 2,739South: 906West: 409 83.3% of Gulf Gate Estates residents lived in the same house 1 years ago.
Out of people who lived in different houses, 37.6% lived in this county.
Out of people who lived in different counties, 29.3% lived in Florida.
Gulf Gate Estates:
83.3%State average:
86.3%
Education attainment for males 25 years and older:
No schooling: 62Nursery to 4th grade: 05th and 6th grade: 07th and 8th grade: 59th grade: 3510th grade: 12311th grade: 8212th grade, no diploma: 57High school graduate (or equivalency): 1,118Less than 1 year of college: 414Some college more than 1 year, no degree: 593Associate degree: 192Bachelor's degree: 867Master's degree: 532Professional school degree: 187Doctorate degree: 52
Education attainment for females 25 years and older:
No schooling: 36Nursery to 4th grade: 05th and 6th grade: 227th and 8th grade: 499th grade: 6710th grade: 7111th grade: 9912th grade, no diploma: 16High school graduate (or equivalency): 1,331Less than 1 year of college: 383Some college more than 1 year, no degree: 891Associate degree: 562Bachelor's degree: 923Master's degree: 551Professional school degree: 40Doctorate degree: 15
Housing units in structures:
One, detached: 4,075One, attached: 472Two: 1833 or 4: 4875 to 9: 54610 to 19: 28920 to 49: 43550 or more: 608Mobile homes: 472Median worth of mobile homes: $121,566
Housing units lacking complete plumbing facilities in 2022: 0.2%Housing units lacking complete kitchen facilities in 2022: 4.1%House/condo owner moved in on average 12 years ago
Renter moved in on average 1 years ago
Private vs. public school enrollment:
Students in private schools in grades 1 to 8 (elementary and middle school): 174 Students in private schools in grades 9 to 12 (high school): 39 Students in private undergraduate colleges: 8