Fort Lauderdale, FL (Florida) Houses and Residents
Estimated median house or condo value in 2022: $485,800 (it was $132,600 in 2000 )
Fort Lauderdale:
$485,800Florida:
$354,100
Lower value quartile - upper value quartile: $335,100 - $844,000Mean price in 2022: Detached houses: $884,233 Here:
$884,233State:
$500,941
Townhouses or other attached units: $841,956 Here:
$841,956State:
$370,869
In 2-unit structures: $569,559 Here:
$569,559State:
$423,188
In 3-to-4-unit structures: $688,953 Here:
$688,953State:
$309,944
In 5-or-more-unit structures: $605,185 Here:
$605,185State:
$447,145
Mobile homes: $17,152 Here:
$17,152State:
$113,202
Total population: 176,013 (Urban population: 152,125, Rural population: 0)
Houses: 101,840 (80,089 occupied: 41,178 owner occupied, 38,911 renter occupied )
% of renters here:
49%State:
33%
Housing density: 3,210 houses/condos per square mile
Median price asked for vacant for-sale houses and condos in 2022: $756,378.
Median contract rent in 2022: $1,658 (lower quartile is $1,164, upper quartile is over $2,000)
Median rent asked for vacant for-rent units in 2022: $1,968
Median gross rent in Fort Lauderdale, FL in 2022: $1,799
Housing units in Fort Lauderdale with a mortgage: 23,000 (2,168 second mortgage, 0 home equity loan, 1,717 both second mortgage and home equity loan )Houses without a mortgage: 376
Median household income for houses/condos with a mortgage: $132,975
Median household income for apartments without a mortgage: $78,872
Median monthly housing costs: $1,772
Data:
Median house or condo value ($)
Median house or condo value ($ change since 2000)
Median house or condo value ($) - White
Median house or condo value ($) - Black or African American
Median house or condo value ($) - Asian
Median house or condo value ($) - Hispanic or Latino
Median house or condo value ($) - American Indian and Alaska Native
Median house or condo value ($) - Multirace
Median house or condo value ($) - Other Race
Median price asked for mobile homes ($)
Household density (households per square mile)
Mean house or condo value by units in structure - 1, detached ($)
Mean house or condo value by units in structure - 1, attached ($)
Mean house or condo value by units in structure - 2 ($)
Mean house or condo value by units in structure by units in structure - 3 or 4 ($)
Mean house or condo value by units in structure - 5 or more ($)
Mean house or condo value by units in structure - Boat, RV, van, etc. ($)
Mean house or condo value by units in structure - Mobile home ($)
Median contract rent ($)
Median contract rent - Lower quartile ($)
Median contract rent - Upper quartile ($)
Median gross rent ($)
Urban houses (%)
Rural houses (%)
Houses occupied (%)
Houses occupied (% change since 2000)
Houses owner occupied (%)
Houses owner occupied (% change since 2000)
Houses renter occupied (%)
Houses renter occupied (% change since 2000)
Vacant housing units - For rent (%)
Vacant housing units - For rent (% change since 2000)
Vacant housing units - For sale only (%)
Vacant housing units - For sale only (% change since 2000)
Vacant housing units - Rented or sold, not occupied (%)
Vacant housing units - Rented or sold, not occupied (% change since 2000)
Vacant housing units - For seasonal, recreational, or occasional use (%)
Vacant housing units - For seasonal, recreational, or occasional use (% change since 2000)
Vacant housing units - For migrant workers (%)
Vacant housing units - For migrant workers (% change since 2000)
Vacant housing units - Other vacant (%)
Vacant housing units - Other vacant (% change since 2000)
Median monthly housing costs ($)
Median household income for houses/condos with a mortgage ($)
Median household income for houses/condos without a mortgage ($)
Median household income ($)
Median household income ($) - White
Median household income ($) - Black or African American
Median household income ($) - Asian
Median household income ($) - Hispanic or Latino
Median household income ($) - American Indian and Alaska Native
Median household income ($) - Multirace
Median household income ($) - Other Race
Mortgage status - with mortgage (%)
Mortgage status - with second mortgage (%)
Mortgage status - with home equity loan (%)
Mortgage status - with both second mortgage and home equity loan (%)
Mortgage status - without a mortgage (%)
Median year house/condo built
Median year apartment built
Household type by relationship - Male householder living alone (%)
Household type by relationship - Male householder not living alone (%)
Household type by relationship - Female householder living alone (%)
Household type by relationship - Female householder not living alone (%)
Household type by relationship - Opposite-Sex spouse (%)
Household type by relationship - Same-Sex spouse (%)
Household type by relationship - Opposite-Sex unmarried partner (%)
Household type by relationship - Same-Sex unmarried partner (%)
Household type by relationship - In group quarters (%)
Size of family households - 2-person household (%)
Size of family households - 3-person household (%)
Size of family households - 4-person household (%)
Size of family households - 5-person household (%)
Size of family households - 6-person household (%)
Size of family households - 7-or-more-person household (%)
Size of nonfamily households - 1-person household (%)
Size of nonfamily households - 2-person household (%)
Size of nonfamily households - 3-person household (%)
Size of nonfamily households - 4-person household (%)
Size of nonfamily households - 5-person household (%)
Size of nonfamily households - 6-person household (%)
Size of nonfamily households - 7-or-moreperson household (%)
Year house built - Built 2010 or later (%)
Year house built - Built 2000 to 2009 (%)
Year house built - Built 1990 to 1999 (%)
Year house built - Built 1980 to 1989 (%)
Year house built - Built 1970 to 1979 (%)
Year house built - Built 1960 to 1969 (%)
Year house built - Built 1950 to 1959 (%)
Year house built - Built 1940 to 1949 (%)
Year house built - Built 1939 or earlier (%)
Median number of rooms in houses and condos
Median number of rooms in apartments
Median number of bedrooms in owner occupied houses
Mean number of bedrooms in owner occupied houses
Median number of bedrooms in renter occupied houses
Mean number of bedrooms in renter occupied houses
Median number of vehichles in owner occupied houses
Mean number of vehichles in owner occupied houses
Median number of vehichles in renter occupied houses
Mean number of vehichles in renter occupied houses
Rooms in owner-occupied houses - 1 room (%)
Rooms in owner-occupied houses - 2 rooms (%)
Rooms in owner-occupied houses - 3 rooms (%)
Rooms in owner-occupied houses - 4 rooms (%)
Rooms in owner-occupied houses - 5 rooms (%)
Rooms in owner-occupied houses - 6 rooms (%)
Rooms in owner-occupied houses - 7 rooms (%)
Rooms in owner-occupied houses - 8 rooms (%)
Rooms in owner-occupied houses - 9+ rooms (%)
Rooms in renter-occupied houses - 1 room (%)
Rooms in renter-occupied houses - 2 rooms (%)
Rooms in renter-occupied houses - 3 rooms (%)
Rooms in renter-occupied houses - 4 rooms (%)
Rooms in renter-occupied houses - 5 rooms (%)
Rooms in renter-occupied houses - 6 rooms (%)
Rooms in renter-occupied houses - 7 rooms (%)
Rooms in renter-occupied houses - 8 rooms (%)
Rooms in renter-occupied houses - 9+ rooms (%)
Bedrooms in owner-occupied houses - no bedrooms (%)
Bedrooms in owner-occupied houses - 1 bedroom (%)
Bedrooms in owner-occupied houses - 2 bedrooms (%)
Bedrooms in owner-occupied houses - 3 bedrooms (%)
Bedrooms in owner-occupied houses - 4 bedrooms (%)
Bedrooms in owner-occupied houses - 5+ bedrooms (%)
Bedrooms in renter-occupied houses - no bedrooms (%)
Bedrooms in renter-occupied houses - 1 bedroom (%)
Bedrooms in renter-occupied houses - 2 bedrooms (%)
Bedrooms in renter-occupied houses - 3 bedrooms (%)
Bedrooms in renter-occupied houses - 4 bedrooms (%)
Bedrooms in renter-occupied houses - 5+ bedrooms (%)
Vehicles available in owner-occupied houses - no vehicle available (%)
Vehicles available in owner-occupied houses - 1 vehicle available(%)
Vehicles available in owner-occupied houses - 2 Vehicles available (%)
Vehicles available in owner-occupied houses - 3 Vehicles available (%)
Vehicles available in owner-occupied houses - 4 Vehicles available (%)
Vehicles available in owner-occupied houses - 5+ Vehicles available (%)
Vehicles available in renter-occupied houses - no vehicle available (%)
Vehicles available in renter-occupied houses - 1 vehicle available (%)
Vehicles available in renter-occupied houses - 2 Vehicles available (%)
Vehicles available in renter-occupied houses - 3 Vehicles available (%)
Vehicles available in renter-occupied houses - 4 Vehicles available (%)
Vehicles available in renter-occupied houses - 5+ Vehicles available (%)
Housing units in structures - 1, detached (%)
Housing units in structures - 1, attached (%)
Housing units in structures - 2 (%)
Housing units in structures - 3 or 4 (%)
Housing units in structures - 5 to 9 (%)
Housing units in structures - 10 to 19 (%)
Housing units in structures - 20 to 49 (%)
Housing units in structures - 50 or more (%)
Housing units in structures - Mobile home (%)
Housing units in structures - Boat, RV, van, etc. (%)
Housing units in structures - Owners - 1, detached (%)
Housing units in structures - Owners - 1, attached (%)
Housing units in structures - Owners - 2 (%)
Housing units in structures - Owners - 3 or 4 (%)
Housing units in structures - Owners - 5 to 9 (%)
Housing units in structures - Owners - 10 to 19 (%)
Housing units in structures - Owners - 20 to 49 (%)
Housing units in structures - Owners - 50 or more (%)
Housing units in structures - Owners - Mobile home (%)
Housing units in structures - Owners - Boat, RV, van, etc. (%)
Housing units in structures - Renters - 1, detached (%)
Housing units in structures - Renters - 1, attached (%)
Housing units in structures - Renters - 2 (%)
Housing units in structures - Renters - 3 or 4 (%)
Housing units in structures - Renters - 5 to 9 (%)
Housing units in structures - Renters - 10 to 19 (%)
Housing units in structures - Renters - 20 to 49 (%)
Housing units in structures - Renters - 50 or more (%)
Housing units in structures - Renters - Mobile home (%)
Housing units in structures - Renters - Boat, RV, van, etc. (%)
House/condo owner moved in on average (years ago)
Renter moved in on average (years ago)
Year householder moved into unit - Moved in 1999 to March 2000 (%)
Year householder moved into unit - Moved in 1999 to March 2000 (%) - White
Year householder moved into unit - Moved in 1999 to March 2000 (%) - Black or African American
Year householder moved into unit - Moved in 1999 to March 2000 (%) - Asian
Year householder moved into unit - Moved in 1999 to March 2000 (%) - Hispanic or Latino
Year householder moved into unit - Moved in 1999 to March 2000 (%) - American Indian and Alaska Native
Year householder moved into unit - Moved in 1999 to March 2000 (%) - Multirace
Year householder moved into unit - Moved in 1999 to March 2000 (%) - Other Race
Year householder moved into unit - Moved in 1995 to 1998 (%)
Year householder moved into unit - Moved in 1995 to 1998 (%) - White
Year householder moved into unit - Moved in 1995 to 1998 (%) - Black or African American
Year householder moved into unit - Moved in 1995 to 1998 (%) - Asian
Year householder moved into unit - Moved in 1995 to 1998 (%) - Hispanic or Latino
Year householder moved into unit - Moved in 1995 to 1998 (%) - American Indian and Alaska Native
Year householder moved into unit - Moved in 1995 to 1998 (%) - Multirace
Year householder moved into unit - Moved in 1995 to 1998 (%) - Other Race
Year householder moved into unit - Moved in 1990 to 1994 (%)
Year householder moved into unit - Moved in 1990 to 1994 (%) - White
Year householder moved into unit - Moved in 1990 to 1994 (%) - Black or African American
Year householder moved into unit - Moved in 1990 to 1994 (%) - Asian
Year householder moved into unit - Moved in 1990 to 1994 (%) - Hispanic or Latino
Year householder moved into unit - Moved in 1990 to 1994 (%) - American Indian and Alaska Native
Year householder moved into unit - Moved in 1990 to 1994 (%) - Multirace
Year householder moved into unit - Moved in 1990 to 1994 (%) - Other Race
Year householder moved into unit - Moved in 1980 to 1989 (%)
Year householder moved into unit - Moved in 1980 to 1989 (%) - White
Year householder moved into unit - Moved in 1980 to 1989 (%) - Black or African American
Year householder moved into unit - Moved in 1980 to 1989 (%) - Asian
Year householder moved into unit - Moved in 1980 to 1989 (%) - Hispanic or Latino
Year householder moved into unit - Moved in 1980 to 1989 (%) - American Indian and Alaska Native
Year householder moved into unit - Moved in 1980 to 1989 (%) - Multirace
Year householder moved into unit - Moved in 1980 to 1989 (%) - Other Race
Year householder moved into unit - Moved in 1970 to 1979 (%)
Year householder moved into unit - Moved in 1970 to 1979 (%) - White
Year householder moved into unit - Moved in 1970 to 1979 (%) - Black or African American
Year householder moved into unit - Moved in 1970 to 1979 (%) - Asian
Year householder moved into unit - Moved in 1970 to 1979 (%) - Hispanic or Latino
Year householder moved into unit - Moved in 1970 to 1979 (%) - American Indian and Alaska Native
Year householder moved into unit - Moved in 1970 to 1979 (%) - Multirace
Year householder moved into unit - Moved in 1970 to 1979 (%) - Other Race
Year householder moved into unit - Moved in 1969 or earlier (%)
Year householder moved into unit - Moved in 1969 or earlier (%) - White
Year householder moved into unit - Moved in 1969 or earlier (%) - Black or African American
Year householder moved into unit - Moved in 1969 or earlier (%) - Asian
Year householder moved into unit - Moved in 1969 or earlier (%) - Hispanic or Latino
Year householder moved into unit - Moved in 1969 or earlier (%) - American Indian and Alaska Native
Year householder moved into unit - Moved in 1969 or earlier (%) - Multirace
Year householder moved into unit - Moved in 1969 or earlier (%) - Other Race
Housing units lacking complete plumbing facilities (%)
Housing units lacking complete kitchen facilities (%)
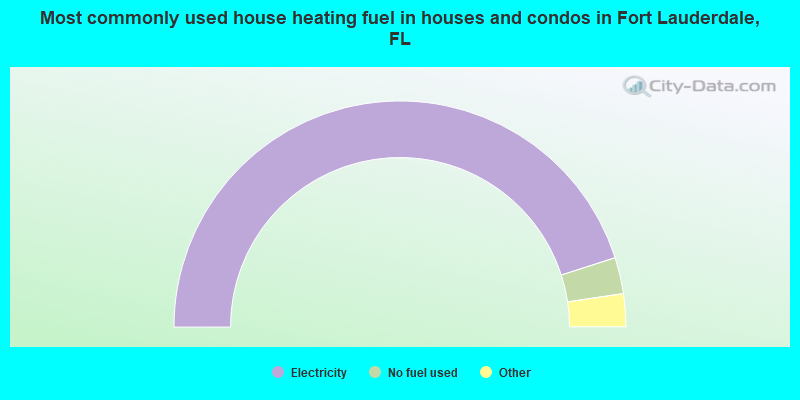
House heating fuel used in houses and condos - Utility gas (%)
House heating fuel used in houses and condos - Bottled, tank, or LP gas (%)
House heating fuel used in houses and condos - Electricity (%)
House heating fuel used in houses and condos - Fuel oil, kerosene, etc. (%)
House heating fuel used in houses and condos - Coal or coke (%)
House heating fuel used in houses and condos - Wood (%)
House heating fuel used in houses and condos - Solar energy (%)
House heating fuel used in houses and condos - Other fuel (%)
House heating fuel used in houses and condos - No fuel used (%)
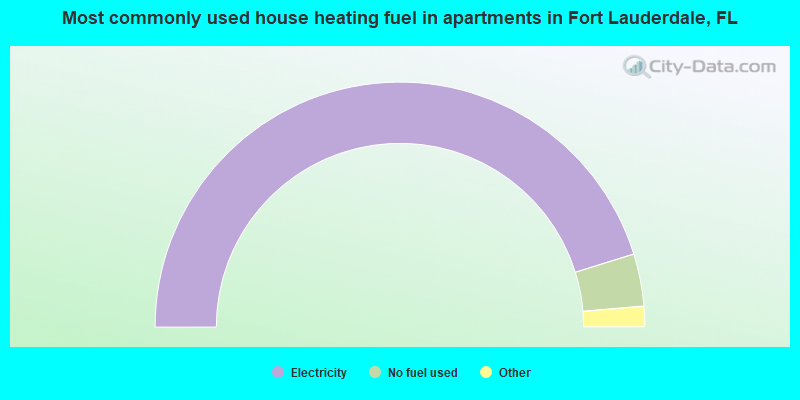
House heating fuel used in apartments - Utility gas (%)
House heating fuel used in apartments - Bottled, tank, or LP gas (%)
House heating fuel used in apartments - Electricity (%)
House heating fuel used in apartments - Fuel oil, kerosene, etc. (%)
House heating fuel used in apartments - Coal or coke (%)
House heating fuel used in apartments - Wood (%)
House heating fuel used in apartments - Solar energy (%)
House heating fuel used in apartments - Other fuel (%)
House heating fuel used in apartments - No fuel used (%)
Median year house/condo built: 1968Median year apartment built: 1984Household type by relationship:
Households: 183,156
Male householders: 43,190 (16,926 living alone ), Female householders: 36,899 (15,080 living alone )27,642 spouses (25,537 opposite-sex spouses ), 6,055 unmarried partners , (4,805 opposite-sex unmarried partners ), 41,209 children (39,541 natural , 681 adopted , 987 stepchildren ), 3,584 grandchildren , 1,372 brothers or sisters , 2,685 parents , 90 foster children , 4,113 other relatives , 12,566 non-relatives In group quarters: 3,751
Size of family households: 19,030 2-persons , 7,850 3-persons , 6,719 4-persons , 2,049 5-persons , 1,172 6-persons , 1,804 7-or-more-persons .
Size of nonfamily households: 32,006 1-person , 7,867 2-persons , 1,186 3-persons , 259 4-persons , 147 5-persons .
16,308 married couples with children. single-parent households (2,107 men , 8,021 women ).
67.8% of residents of Fort Lauderdale speak English at home. of residents speak Spanish at home (59% speak English very well , 13% speak English well , 16% speak English not well , 12% don't speak English at all ).of residents speak other Indo-European language at home (65% speak English very well , 17% speak English well , 13% speak English not well , 4% don't speak English at all ).of residents speak Asian or Pacific Island language at home (75% speak English very well , 20% speak English well , 2% speak English not well , 2% don't speak English at all ).of residents speak other language at home (93% speak English very well , 6% speak English well , 2% speak English not well ).
Foreign born population: 47,324 (25.8%)of them are naturalized citizens )
Median number of rooms in houses and condos:
Median number of rooms in apartments
Owner-occupied Renter-occupied
Bedrooms in owner-occupied houses and condos in Fort Lauderdale, Florida
158 no bedroom 3,116 1 bedroom 12,902 2 bedrooms 18,176 3 bedrooms 4,738 4 bedrooms 2,088 5+ bedrooms
Bedrooms in renter-occupied apartments in Fort Lauderdale, Florida
2,636 no bedroom 13,432 1 bedroom 15,055 2 bedrooms 5,775 3 bedrooms 1,778 4 bedrooms 235 5+ bedrooms
Owner-occupied Renter-occupied
Rooms in owner-occupied houses in Fort Lauderdale, Florida
158 1 room 520 2 rooms 4,794 3 rooms 7,721 4 rooms 7,910 5 rooms 8,111 6 rooms 5,594 7 rooms 2,687 8 rooms 3,683 9+ rooms
Rooms in renter-occupied apartments in Fort Lauderdale, Florida
2,379 1 room 3,858 2 rooms 11,652 3 rooms 12,074 4 rooms 4,676 5 rooms 3,113 6 rooms 599 7 rooms 0 8 rooms 560 9+ rooms
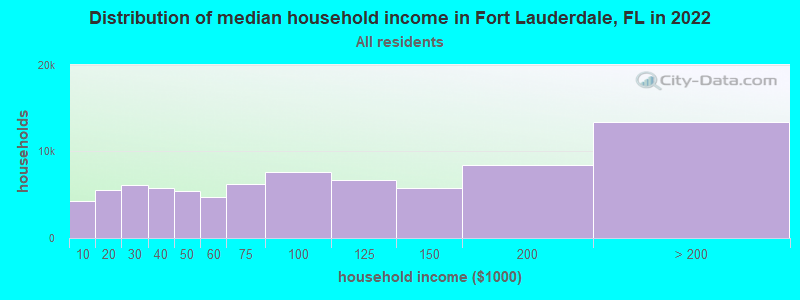
Fort Lauderdale, FL household income distribution 4,299 Less than $10,0005,508 $10,000 to $19,9996,139 $20,000 to $29,9995,821 $30,000 to $39,9995,366 $40,000 to $49,9994,744 $50,000 to $59,9996,218 $60,000 to $74,9997,668 $75,000 to $99,9996,738 $100,000 to $124,9995,737 $125,000 to $149,9998,466 $150,000 to $199,99913,385 $200,000 or more
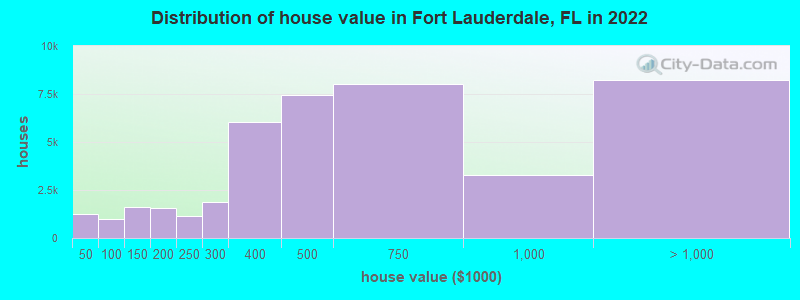
Home value of owner - occupied houses in 2022 in Fort Lauderdale, FL 176 Less than $10,000146 $10,000 to $14,999158 $20,000 to $24,999346 $30,000 to $34,999142 $35,000 to $39,999270 $40,000 to $49,999183 $60,000 to $69,999301 $70,000 to $79,99973 $80,000 to $89,999169 $90,000 to $99,999692 $100,000 to $124,999944 $125,000 to $149,999548 $150,000 to $174,9991,024 $175,000 to $199,9991,140 $200,000 to $249,9991,860 $250,000 to $299,9996,042 $300,000 to $399,9997,427 $400,000 to $499,9998,008 $500,000 to $749,9993,285 $750,000 to $999,9992,697 $1,000,000 to $1,499,9992,212 $1,500,000 to $1,999,9993,335 $2,000,000 or moreRent paid by renters in 2022 in Fort Lauderdale, FL 795 Less than $10071 $100 to $14947 $200 to $24950 $300 to $349194 $350 to $39999 $400 to $449537 $500 to $549114 $550 to $599308 $600 to $649179 $650 to $699530 $700 to $749255 $750 to $7991,002 $800 to $899781 $900 to $9996,753 $1,000 to $1,2494,618 $1,250 to $1,4997,709 $1,500 to $1,9995,753 $2,000 to $2,4992,950 $2,500 to $2,9991,706 $3,000 to $3,4993,073 $3,500 or more1,387 No cash rent
Percentage of workers working in this county: 87.3%Number of people working at home: 20,611 (20.8% of all workers )
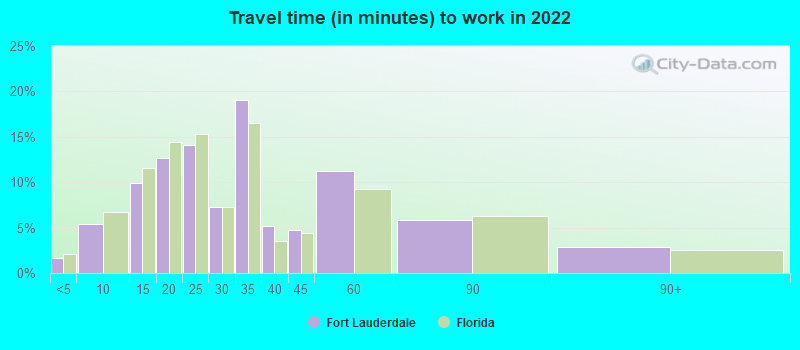
Travel time to work (commute)
Less than 5 minutes: 1,6225 to 9 minutes: 6,61010 to 14 minutes: 12,16715 to 19 minutes: 12,15220 to 24 minutes: 10,52925 to 29 minutes: 3,69230 to 34 minutes: 12,32535 to 39 minutes: 3,45440 to 44 minutes: 3,66945 to 59 minutes: 5,37460 to 89 minutes: 3,88990 or more minutes: 2,973
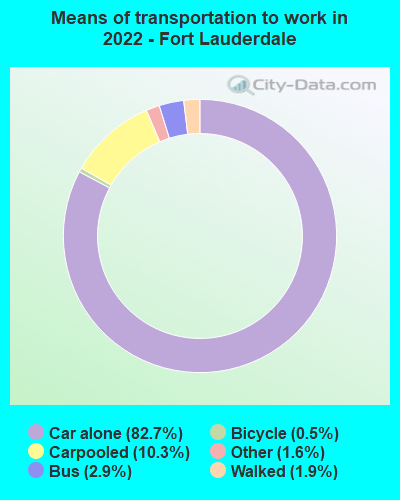
Means of transportation to work:
Drove a car alone: 125,846 (72.9%)Carpooled: 15,656 (9.1%)Bus : 4,437 (2.6%)Long-distance train or commuter rail : 92 (0.1%)Taxi: 2,502 (1.4%)Bicycle: 763 (0.4%)Walked: 2,815 (1.6%)Worked at home: 20,611 (11.9%)
Unemployment by race in 2022
Unemployment rate for White non-Hispanic residents 1.2% Males1.4% FemalesUnemployment rate for Black residents 3.3% Males8.8% FemalesUnemployment rate for American Indian and Alaska Native residents 6.6% Males2.9% FemalesUnemployment rate for Asian residents 3.0% Males2.1% FemalesUnemployment rate for other race residents 4.3% Males6.6% FemalesUnemployment rate for two or more race residents 1.5% Males2.1% FemalesUnemployment rate for Hispanic or Latino residents 1.0% Males3.0% Females
Year of entry for the foreign-born population in Fort Lauderdale, Florida
18,261 2010 or later 8,853 2000 to 2009 7,502 1990 to 1999 9,141 1980 to 1989 3,895 1970 to 1979 5,132 Before 1970
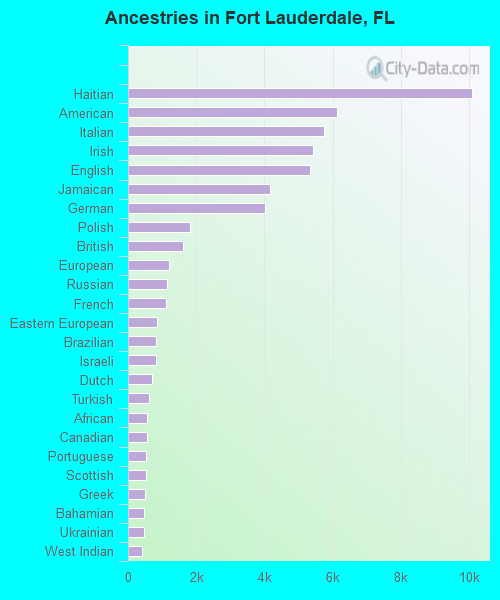
First ancestries reported:
Haitian: 10,082 (8.8%)
American: 6,134 (5.3%)
Italian: 5,756 (5.0%)
Irish: 5,435 (4.7%)
English: 5,341 (4.6%)
Jamaican: 4,175 (3.6%)
German: 4,004 (3.5%)
Polish: 1,807 (1.6%)
British: 1,627 (1.4%)
European: 1,196 (1.0%)
Russian: 1,133 (1.0%)
French: 1,104 (1.0%)
Eastern European: 842 (0.7%)
Brazilian: 827 (0.7%)
Israeli: 810 (0.7%)
Dutch: 708 (0.6%)
Turkish: 606 (0.5%)
African: 564 (0.5%)
Canadian: 551 (0.5%)
Portuguese: 525 (0.5%)
Scottish: 521 (0.5%)
Greek: 484 (0.4%)
Bahamian: 466 (0.4%)
Ukrainian: 458 (0.4%)
West Indian: 424 (0.4%)
French Canadian: 404 (0.4%)
Lebanese: 388 (0.3%)
Romanian: 342 (0.3%)
Czech: 321 (0.3%)
Slovak: 321 (0.3%)
Hungarian: 290 (0.3%)
Swedish: 273 (0.2%)
Norwegian: 270 (0.2%)
Serbian: 261 (0.2%)
Trinidadian and Tobagonian: 212 (0.2%)
Scotch-Irish: 198 (0.2%)
Australian: 181 (0.2%)
Nigerian: 171 (0.1%)
Welsh: 162 (0.1%)
Iranian: 152 (0.1%)
Albanian: 146 (0.1%)
Austrian: 137 (0.1%)
Northern European: 134 (0.1%)
Guyanese: 129 (0.1%)
Egyptian: 127 (0.1%)
Lithuanian: 121 (0.1%)
Moroccan: 113 (0.10%)
British West Indian: 107 (0.09%)
Dutch West Indian: 98 (0.09%)
Armenian: 93 (0.08%)
Macedonian: 91 (0.08%)
Slavic: 88 (0.08%)
Danish: 83 (0.07%)
South African: 80 (0.07%)
Scandinavian: 67 (0.06%)
Syrian: 61 (0.05%)
Arab: 54 (0.05%)
Zimbabwean: 38 (0.03%)
Belizean: 25 (0.02%)
Cypriot: 22 (0.02%)
Bulgarian: 20 (0.02%)
Iraqi: 19 (0.02%)
Barbadian: 16 (0.01%)
Finnish: 16 (0.01%)
Czechoslovakian: 16 (0.01%)
Luxembourger: 14 (0.01%)
Slovene: 14 (0.01%)
Belgian: 13 (0.01%)
Pennsylvania German: 12 (0.01%)
Jordanian: 10 (0.01%)
Palestinian: 9 (0.01%)
Latvian: 8 (0.01%)
Swiss: 8 (0.01%)
Maltese: 8 (0.01%)
U.S. Virgin Islander: 8 (0.01%)
Croatian: 6 (0.01%)
Most common places of birth for foreign-born residents (%): Haiti Fort Lauderdale:
15.5% (7,892)Florida:
7.5% (342,375)
Cuba Fort Lauderdale:
7.7% (3,935)Florida:
22.0% (1,006,576)
Jamaica Fort Lauderdale:
7.4% (3,784)Florida:
5.0% (227,319)
Guatemala Fort Lauderdale:
6.2% (3,164)Florida:
2.1% (97,632)
Brazil Fort Lauderdale:
4.9% (2,496)Florida:
2.7% (122,906)
Colombia Fort Lauderdale:
4.5% (2,291)Florida:
6.5% (298,669)
Venezuela Fort Lauderdale:
4.4% (2,239)Florida:
5.7% (262,042)
Honduras Fort Lauderdale:
3.6% (1,832)Florida:
2.3% (107,160)
Canada Fort Lauderdale:
3.5% (1,786)Florida:
2.4% (109,132)
Mexico Fort Lauderdale:
3.4% (1,735)Florida:
5.6% (257,152)
El Salvador Fort Lauderdale:
3.0% (1,555)Florida:
1.1% (49,838)
Peru Fort Lauderdale:
2.3% (1,183)Florida:
2.1% (96,693)
Argentina Fort Lauderdale:
2.1% (1,088)Florida:
1.3% (57,263)
United Kingdom, excluding England and Scotland Fort Lauderdale:
2.1% (1,060)Florida:
0.7% (34,227)
Bahamas Fort Lauderdale:
2.0% (1,023)Florida:
0.4% (17,749)
Place of birth for U.S.-born residents:
This state: 68,690Other state: 61,883Northeast: 31,452Midwest: 15,360South: 11,642West: 3,429 84.9% of Fort Lauderdale residents lived in the same house 1 years ago.
Out of people who lived in different houses, 40.0% lived in this county.
Out of people who lived in different counties, 28.6% lived in Florida.
Fort Lauderdale:
84.9%State average:
86.3%
Education attainment for males 25 years and older:
No schooling: 1,016Nursery to 4th grade: 7925th and 6th grade: 1,0247th and 8th grade: 5299th grade: 93810th grade: 86711th grade: 1,20312th grade, no diploma: 2,227High school graduate (or equivalency): 17,563Less than 1 year of college: 2,685Some college more than 1 year, no degree: 8,805Associate degree: 5,890Bachelor's degree: 17,824Master's degree: 7,802Professional school degree: 4,532Doctorate degree: 1,829
Education attainment for females 25 years and older:
No schooling: 977Nursery to 4th grade: 8485th and 6th grade: 7447th and 8th grade: 3519th grade: 56810th grade: 68011th grade: 90312th grade, no diploma: 998High school graduate (or equivalency): 14,928Less than 1 year of college: 3,416Some college more than 1 year, no degree: 6,204Associate degree: 5,612Bachelor's degree: 18,091Master's degree: 6,507Professional school degree: 2,114Doctorate degree: 1,570
Housing units in structures:
One, detached: 34,155One, attached: 6,593Two: 2,7833 or 4: 7,3035 to 9: 5,32110 to 19: 6,03120 to 49: 9,48150 or more: 29,499Mobile homes: 674Median worth of mobile homes: $20,600
Housing units lacking complete plumbing facilities in 2022: 1.0%Housing units lacking complete kitchen facilities in 2022: 1.7%House/condo owner moved in on average 11 years ago
Renter moved in on average 1 years ago
Private vs. public school enrollment:
Students in private schools in grades 1 to 8 (elementary and middle school): 3,401 Students in private schools in grades 9 to 12 (high school): 1,601 Students in private undergraduate colleges: 538