Races in Fort Lauderdale, Florida (FL) Detailed Stats
Data:
Races - White alone (%)
Races - White alone (% change since 2000)
Races - Black alone (%)
Races - Black alone (% change since 2000)
Races - American Indian alone (%)
Races - American Indian alone (% change since 2000)
Races - Asian alone (%)
Races - Asian alone (% change since 2000)
Races - Hispanic (%)
Races - Hispanic (% change since 2000)
Races - Native Hawaiian and Other Pacific Islander alone (%)
Races - Native Hawaiian and Other Pacific Islander alone (% change since 2000)
Races - Two or more races(%)
Races - Two or more races(% change since 2000)
Races - Other race alone (%)
Races - Other race alone (% change since 2000)
Racial diversity
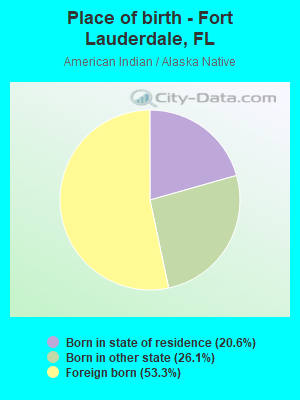
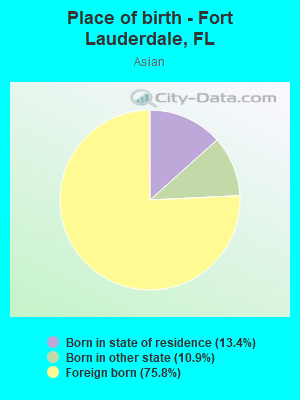
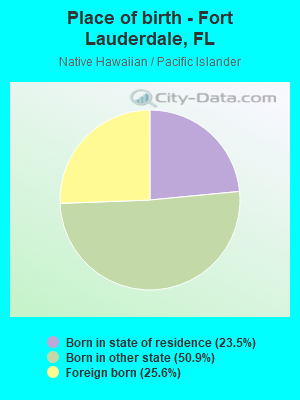
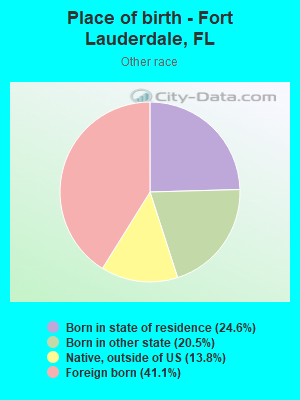
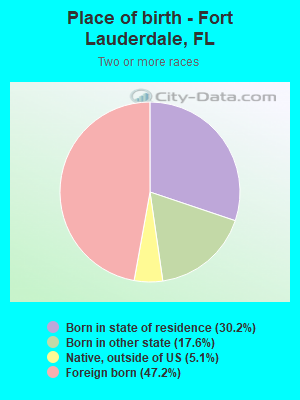
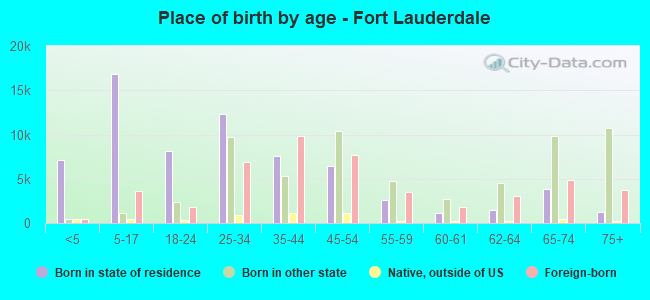
Place of birth - Born in state of residence (%)
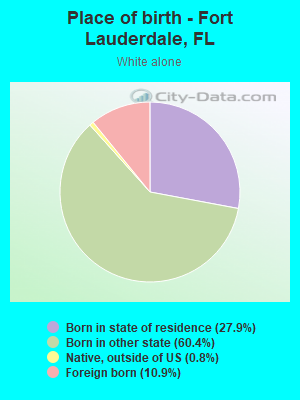
Place of birth - Born in state of residence (%) - White
Place of birth - Born in state of residence (%) - Black or African American
Place of birth - Born in state of residence (%) - Asian
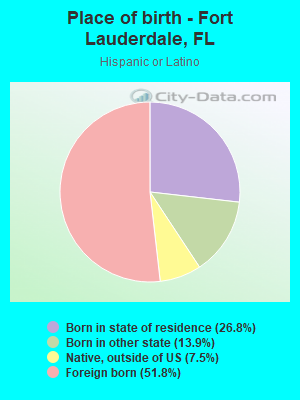
Place of birth - Born in state of residence (%) - Hispanic or Latino
Place of birth - Born in state of residence (%) - American Indian and Alaska Native
Place of birth - Born in state of residence (%) - Multirace
Place of birth - Born in state of residence (%) - Other Race
Place of birth - Born in other state (%)
Place of birth - Born in other state (%) - White
Place of birth - Born in other state (%) - Black or African American
Place of birth - Born in other state (%) - Asian
Place of birth - Born in other state (%) - Hispanic or Latino
Place of birth - Born in other state (%) - American Indian and Alaska Native
Place of birth - Born in other state (%) - Multirace
Place of birth - Born in other state (%) - Other Race
Place of birth - Native, outside of US (%)
Place of birth - Native, outside of US (%) - White
Place of birth - Native, outside of US (%) - Black or African American
Place of birth - Native, outside of US (%) - Asian
Place of birth - Native, outside of US (%) - Hispanic or Latino
Place of birth - Native, outside of US (%) - American Indian and Alaska Native
Place of birth - Native, outside of US (%) - Multirace
Place of birth - Native, outside of US (%) - Other Race
Place of birth - Foreign born (%)
Place of birth - Foreign born (%) - White
Place of birth - Foreign born (%) - Black or African American
Place of birth - Foreign born (%) - Asian
Place of birth - Foreign born (%) - Hispanic or Latino
Place of birth - Foreign born (%) - American Indian and Alaska Native
Place of birth - Foreign born (%) - Multirace
Place of birth - Foreign born (%) - Other Race
Residents speaking English at home (%)
Residents speaking English at home - Born in the United States (%)
Residents speaking English at home - Native, born elsewhere (%)
Residents speaking English at home - Foreign born (%)
Residents speaking Spanish at home (%)
Residents speaking Spanish at home - Born in the United States (%)
Residents speaking Spanish at home - Native, born elsewhere (%)
Residents speaking Spanish at home - Foreign born (%)
Residents speaking other language at home (%)
Residents speaking other language at home - Born in the United States (%)
Residents speaking other language at home - Native, born elsewhere (%)
Residents speaking other language at home - Foreign born (%)
Marital status - Never married (%)
Marital status - Now married (%)
Marital status - Separated (%)
Marital status - Widowed (%)
Marital status - Divorced (%)
Ancestries Reported - Arab (%)
Ancestries Reported - Czech (%)
Ancestries Reported - Danish (%)
Ancestries Reported - Dutch (%)
Ancestries Reported - English (%)
Ancestries Reported - French (%)
Ancestries Reported - French Canadian (%)
Ancestries Reported - German (%)
Ancestries Reported - Greek (%)
Ancestries Reported - Hungarian (%)
Ancestries Reported - Irish (%)
Ancestries Reported - Italian (%)
Ancestries Reported - Lithuanian (%)
Ancestries Reported - Norwegian (%)
Ancestries Reported - Polish (%)
Ancestries Reported - Portuguese (%)
Ancestries Reported - Russian (%)
Ancestries Reported - Scotch-Irish (%)
Ancestries Reported - Scottish (%)
Ancestries Reported - Slovak (%)
Ancestries Reported - Subsaharan African (%)
Ancestries Reported - Swedish (%)
Ancestries Reported - Swiss (%)
Ancestries Reported - Ukrainian (%)
Ancestries Reported - United States (%)
Ancestries Reported - Welsh (%)
Ancestries Reported - West Indian (%)
Ancestries Reported - Other (%)
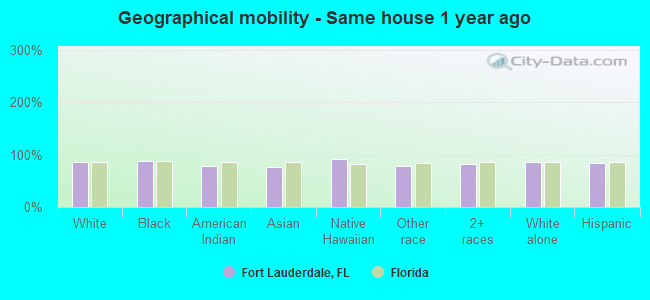
Geographical mobility - Same house 1 year ago (%)
Geographical mobility - Same house 1 year ago (%) - White
Geographical mobility - Same house 1 year ago (%) - Black or African American
Geographical mobility - Same house 1 year ago (%) - Asian
Geographical mobility - Same house 1 year ago (%) - Hispanic or Latino
Geographical mobility - Same house 1 year ago (%) - American Indian and Alaska Native
Geographical mobility - Same house 1 year ago (%) - Multirace
Geographical mobility - Same house 1 year ago (%) - Other Race
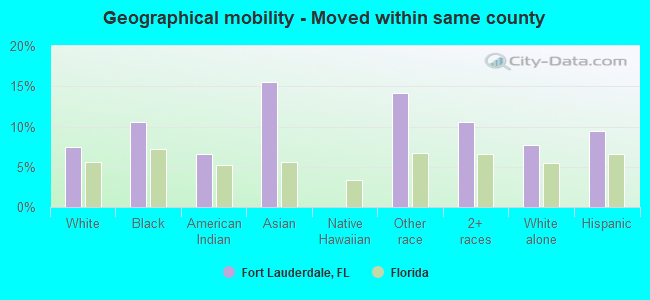
Geographical mobility - Moved within same county (%)
Geographical mobility - Moved within same county (%) - White
Geographical mobility - Moved within same county (%) - Black or African American
Geographical mobility - Moved within same county (%) - Asian
Geographical mobility - Moved within same county (%) - Hispanic or Latino
Geographical mobility - Moved within same county (%) - American Indian and Alaska Native
Geographical mobility - Moved within same county (%) - Multirace
Geographical mobility - Moved within same county (%) - Other Race
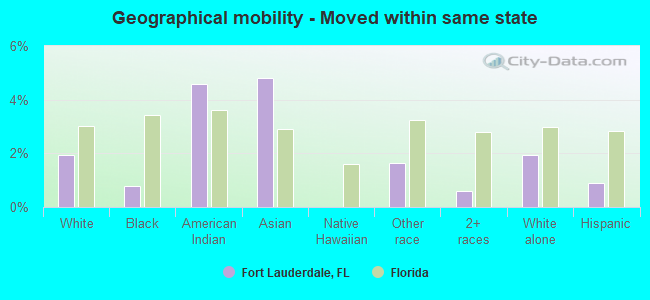
Geographical mobility - Moved from different county within same state (%)
Geographical mobility - Moved from different county within same state (%) - White
Geographical mobility - Moved from different county within same state (%) - Black or African American
Geographical mobility - Moved from different county within same state (%) - Asian
Geographical mobility - Moved from different county within same state (%) - Hispanic or Latino
Geographical mobility - Moved from different county within same state (%) - American Indian and Alaska Native
Geographical mobility - Moved from different county within same state (%) - Multirace
Geographical mobility - Moved from different county within same state (%) - Other Race
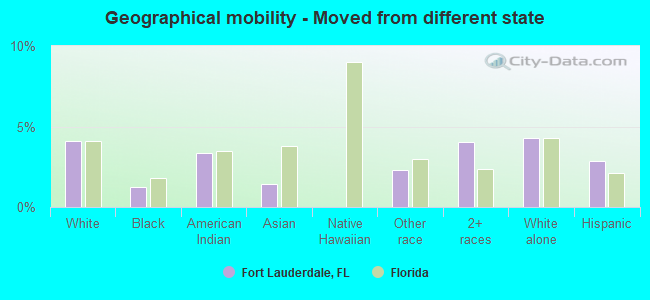
Geographical mobility - Moved from different state (%)
Geographical mobility - Moved from different state (%) - White
Geographical mobility - Moved from different state (%) - Black or African American
Geographical mobility - Moved from different state (%) - Asian
Geographical mobility - Moved from different state (%) - Hispanic or Latino
Geographical mobility - Moved from different state (%) - American Indian and Alaska Native
Geographical mobility - Moved from different state (%) - Multirace
Geographical mobility - Moved from different state (%) - Other Race
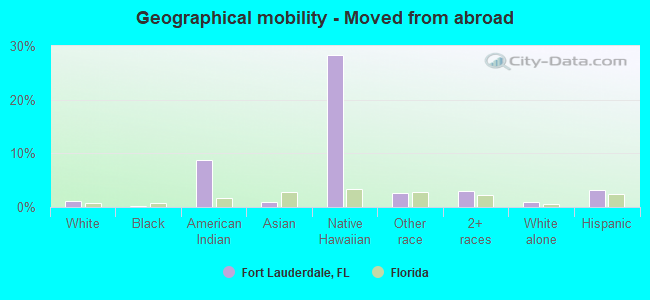
Geographical mobility - Moved from abroad (%)
Geographical mobility - Moved from abroad (%) - White
Geographical mobility - Moved from abroad (%) - Black or African American
Geographical mobility - Moved from abroad (%) - Asian
Geographical mobility - Moved from abroad (%) - Hispanic or Latino
Geographical mobility - Moved from abroad (%) - American Indian and Alaska Native
Geographical mobility - Moved from abroad (%) - Multirace
Geographical mobility - Moved from abroad (%) - Other Race
Place of birth for the foreign-born population - Ireland (%)
Place of birth for the foreign-born population - Denmark (%)
Place of birth for the foreign-born population - Norway (%)
Place of birth for the foreign-born population - Sweden (%)
Place of birth for the foreign-born population - United Kingdom (%)
Place of birth for the foreign-born population - England (%)
Place of birth for the foreign-born population - Scotland (%)
Place of birth for the foreign-born population - Other Northern Europe (%)
Place of birth for the foreign-born population - Austria (%)
Place of birth for the foreign-born population - Belgium (%)
Place of birth for the foreign-born population - France (%)
Place of birth for the foreign-born population - Germany (%)
Place of birth for the foreign-born population - Netherlands (%)
Place of birth for the foreign-born population - Switzerland (%)
Place of birth for the foreign-born population - Other Western Europe (%)
Place of birth for the foreign-born population - Greece (%)
Place of birth for the foreign-born population - Italy (%)
Place of birth for the foreign-born population - Portugal (%)
Place of birth for the foreign-born population - Spain (%)
Place of birth for the foreign-born population - Other Southern Europe (%)
Place of birth for the foreign-born population - Albania (%)
Place of birth for the foreign-born population - Belarus (%)
Place of birth for the foreign-born population - Bosnia and Herzegovina (%)
Place of birth for the foreign-born population - Bulgaria (%)
Place of birth for the foreign-born population - Croatia (%)
Place of birth for the foreign-born population - Czechoslovakia (%)
Place of birth for the foreign-born population - Hungary (%)
Place of birth for the foreign-born population - Latvia (%)
Place of birth for the foreign-born population - Lithuania (%)
Place of birth for the foreign-born population - North Macedonia (Macedonia) (%)
Place of birth for the foreign-born population - Moldova (%)
Place of birth for the foreign-born population - Poland (%)
Place of birth for the foreign-born population - Romania (%)
Place of birth for the foreign-born population - Russia (%)
Place of birth for the foreign-born population - Serbia (%)
Place of birth for the foreign-born population - Ukraine (%)
Place of birth for the foreign-born population - Other Eastern Europe (%)
Place of birth for the foreign-born population - China (%)
Place of birth for the foreign-born population - Hong Kong (%)
Place of birth for the foreign-born population - Taiwan (%)
Place of birth for the foreign-born population - Japan (%)
Place of birth for the foreign-born population - Korea (%)
Place of birth for the foreign-born population - Other Eastern Asia (%)
Place of birth for the foreign-born population - Afghanistan (%)
Place of birth for the foreign-born population - Bangladesh (%)
Place of birth for the foreign-born population - India (%)
Place of birth for the foreign-born population - Iran (%)
Place of birth for the foreign-born population - Kazakhstan (%)
Place of birth for the foreign-born population - Nepal (%)
Place of birth for the foreign-born population - Pakistan (%)
Place of birth for the foreign-born population - Sri Lanka (%)
Place of birth for the foreign-born population - Uzbekistan (%)
Place of birth for the foreign-born population - Other South Central Asia (%)
Place of birth for the foreign-born population - Burma (%)
Place of birth for the foreign-born population - Cambodia (%)
Place of birth for the foreign-born population - Indonesia (%)
Place of birth for the foreign-born population - Laos (%)
Place of birth for the foreign-born population - Malaysia (%)
Place of birth for the foreign-born population - Philippines (%)
Place of birth for the foreign-born population - Singapore (%)
Place of birth for the foreign-born population - Thailand (%)
Place of birth for the foreign-born population - Vietnam (%)
Place of birth for the foreign-born population - Other South Eastern Asia (%)
Place of birth for the foreign-born population - Armenia (%)
Place of birth for the foreign-born population - Iraq (%)
Place of birth for the foreign-born population - Israel (%)
Place of birth for the foreign-born population - Jordan (%)
Place of birth for the foreign-born population - Kuwait (%)
Place of birth for the foreign-born population - Lebanon (%)
Place of birth for the foreign-born population - Saudi Arabia (%)
Place of birth for the foreign-born population - Syria (%)
Place of birth for the foreign-born population - Turkey (%)
Place of birth for the foreign-born population - Yemen (%)
Place of birth for the foreign-born population - Other Western Asia (%)
Place of birth for the foreign-born population - Eritrea (%)
Place of birth for the foreign-born population - Ethiopia (%)
Place of birth for the foreign-born population - Kenya (%)
Place of birth for the foreign-born population - Somalia (%)
Place of birth for the foreign-born population - Uganda (%)
Place of birth for the foreign-born population - Zimbabwe (%)
Place of birth for the foreign-born population - Other Eastern Africa (%)
Place of birth for the foreign-born population - Cameroon (%)
Place of birth for the foreign-born population - Congo (%)
Place of birth for the foreign-born population - Democratic Republic of Congo (Zaire) (%)
Place of birth for the foreign-born population - Other Middle Africa (%)
Place of birth for the foreign-born population - Egypt (%)
Place of birth for the foreign-born population - Morocco (%)
Place of birth for the foreign-born population - Sudan (%)
Place of birth for the foreign-born population - Other Northern Africa (%)
Place of birth for the foreign-born population - South Africa (%)
Place of birth for the foreign-born population - Other Southern Africa (%)
Place of birth for the foreign-born population - Cabo Verde (%)
Place of birth for the foreign-born population - Ghana (%)
Place of birth for the foreign-born population - Liberia (%)
Place of birth for the foreign-born population - Nigeria (%)
Place of birth for the foreign-born population - Senegal (%)
Place of birth for the foreign-born population - Sierra Leone (%)
Place of birth for the foreign-born population - Other Western Africa (%)
Place of birth for the foreign-born population - Australia (%)
Place of birth for the foreign-born population - New Zealand (%)
Place of birth for the foreign-born population - Fiji (%)
Place of birth for the foreign-born population - Micronesia (%)
Place of birth for the foreign-born population - Bahamas (%)
Place of birth for the foreign-born population - Barbados (%)
Place of birth for the foreign-born population - Cuba (%)
Place of birth for the foreign-born population - Dominica (%)
Place of birth for the foreign-born population - Dominican Republic (%)
Place of birth for the foreign-born population - Grenada (%)
Place of birth for the foreign-born population - Haiti (%)
Place of birth for the foreign-born population - Jamaica (%)
Place of birth for the foreign-born population - St. Vincent and the Grenadines (%)
Place of birth for the foreign-born population - Trinidad and Tobago (%)
Place of birth for the foreign-born population - West Indies (%)
Place of birth for the foreign-born population - Other Caribbean (%)
Place of birth for the foreign-born population - Belize (%)
Place of birth for the foreign-born population - Costa Rica (%)
Place of birth for the foreign-born population - El Salvador (%)
Place of birth for the foreign-born population - Guatemala (%)
Place of birth for the foreign-born population - Honduras (%)
Place of birth for the foreign-born population - Mexico (%)
Place of birth for the foreign-born population - Nicaragua (%)
Place of birth for the foreign-born population - Panama (%)
Place of birth for the foreign-born population - Other Central America (%)
Place of birth for the foreign-born population - Argentina (%)
Place of birth for the foreign-born population - Bolivia (%)
Place of birth for the foreign-born population - Brazil (%)
Place of birth for the foreign-born population - Chile (%)
Place of birth for the foreign-born population - Colombia (%)
Place of birth for the foreign-born population - Ecuador (%)
Place of birth for the foreign-born population - Guyana (%)
Place of birth for the foreign-born population - Peru (%)
Place of birth for the foreign-born population - Uruguay (%)
Place of birth for the foreign-born population - Venezuela (%)
Place of birth for the foreign-born population - Other South America (%)
Place of birth for the foreign-born population - Canada (%)
Place of birth for the foreign-born population - Other Northern America (%)
Place of birth for the foreign-born population - Other (%)
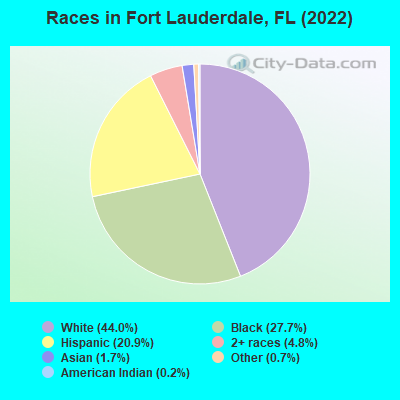
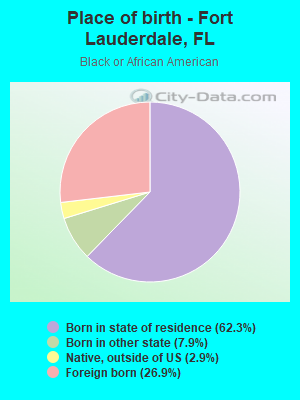
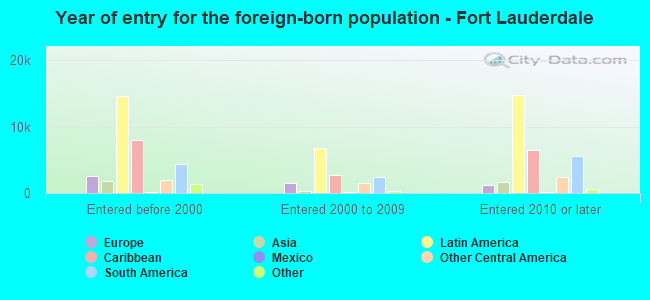
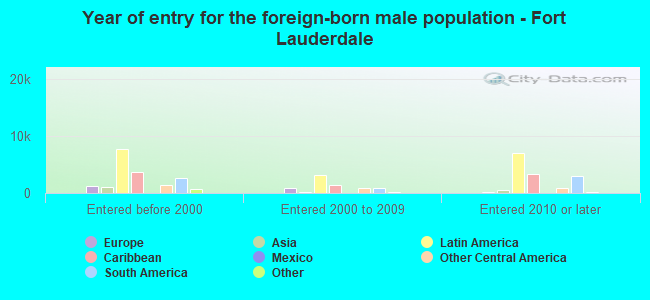
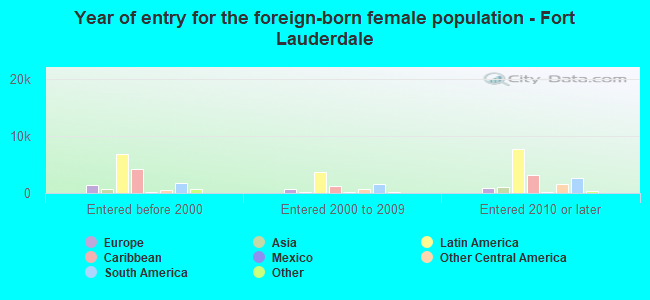
According to 2022 data, the most numerous races in Fort Lauderdale, FL are White alone (80,531 residents), Hispanic (38,345 residents), and Black alone (50,718 residents). 71.4% of Fort Lauderdale residents speak English at home. 27.9% of Fort Lauderdale, FL residents are foreign-born (19.0% born in Latin America, 3.6% born in Europe), which is 24.6% greater than the foreign-born rate of 21.0% across the entire state of Florida.
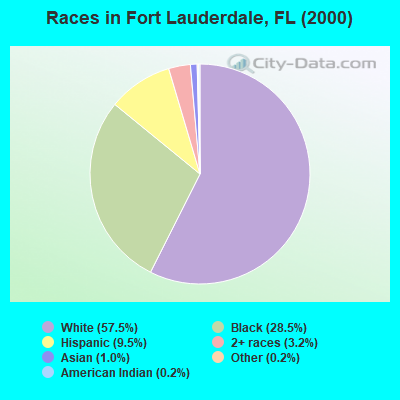
Race distribution in Fort Lauderdale
2000 2022
87,577 57.5% White alone 43,441 28.5% Black alone 14,406 9.5% Hispanic 4,836 3.2% Two or more races 1,538 1.0% Asian alone 305 0.2% Other race alone 234 0.2% American Indian alone 60 0.04% Native Hawaiian and Other
80,531 44.0% White alone 50,718 27.7% Black alone 38,345 20.9% Hispanic 8,829 4.8% Two or more races 3,110 1.7% Asian alone 1,319 0.7% Other race alone 304 0.2% American Indian alone
2000 2022
10,458,509 65.4% White alone 2,682,715 16.8% Hispanic 2,264,268 14.2% Black alone 261,693 1.6% Asian alone 236,954 1.5% Two or more races 42,358 0.3% American Indian alone 28,994 0.2% Other race alone 6,887 0.04% Native Hawaiian and Other
11,309,403 50.8% White alone 6,025,039 27.1% Hispanic 3,241,015 14.6% Black alone 861,630 3.9% Two or more races 623,692 2.8% Asian alone 152,054 0.7% Other race alone 22,504 0.1% American Indian alone 9,486 0.04% Native Hawaiian and Other
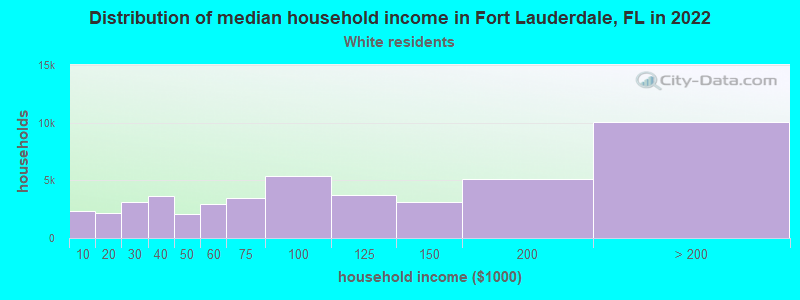
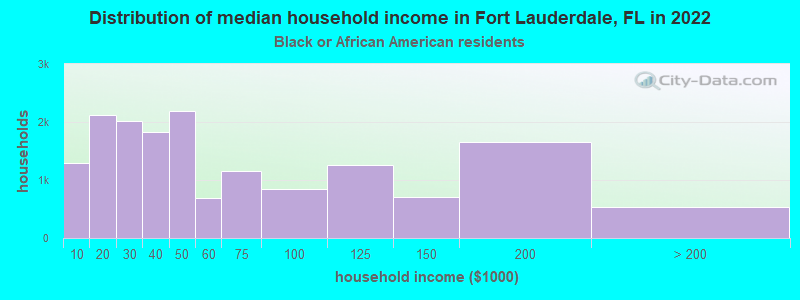
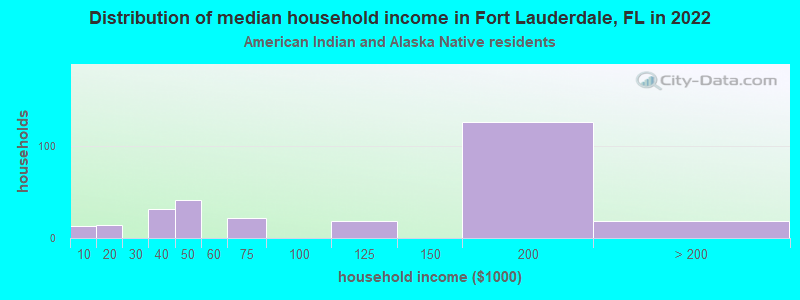
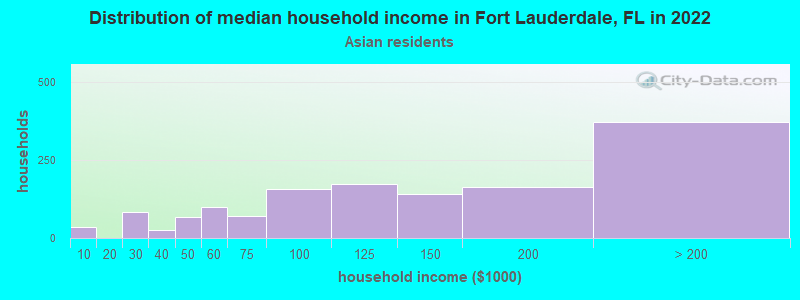
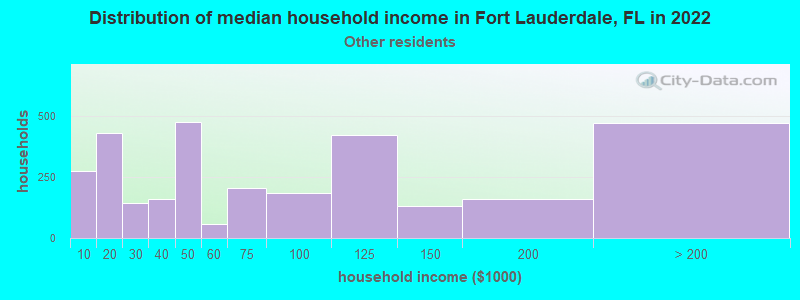
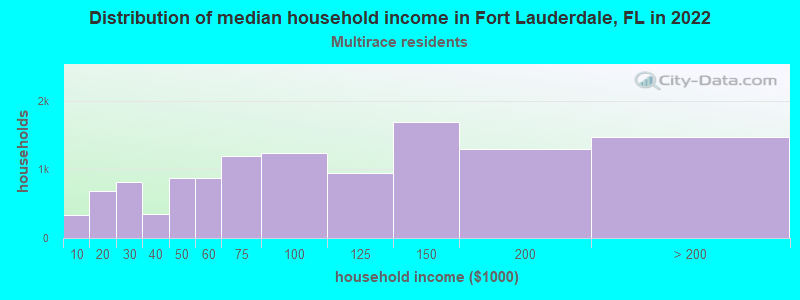
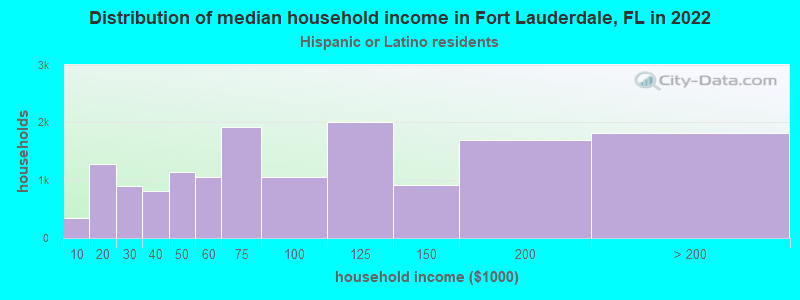
Income and house value in Fort Lauderdale Median household income in 2022 $94,651 White non-Hispanic householders$45,449 Black householders$183,917 Asian householders$74,992 Some other race householders$92,393 Two or more races householders$75,082 Hispanic or Latino race householdersMedian 2022 house value $710,381 White Non-Hispanic householders$283,566 Black or African American householders$401,902 American Indian or Alaska Native householders $430,478 Asian householders$311,410 Some other race householders$322,401 Two or more races householders$407,764 Hispanic or Latino householders
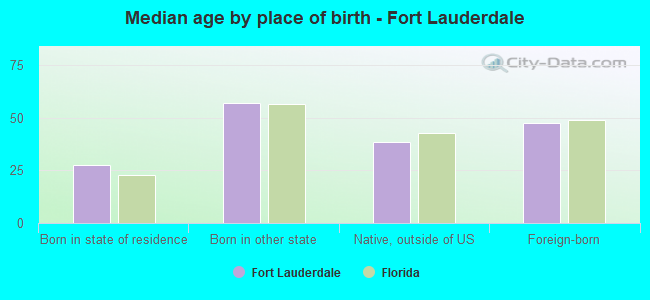
Median age by race in Fort Lauderdale
52.2 Median age for White residents52.9 50.0 34.0 Median age for Black or African American residents33.9 34.8 28.0 Median age for American Indian / Alaska Native residents18.9 40.8 48.7 Median age for Asian residents57.6 36.9 -666,666,666.0 Median age for Native Hawaiian / Pacific Islander residents-666,666,666.0 -666,666,666.0 37.2 Median age for Other race residents35.3 38.3 38.7 Median age for Two or more races residents38.4 39.2 53.6 Median age for White alone residents54.1 53.0 38.7 Median age for Hispanic or Latino residents39.7 37.6
Owner/renter occupied households by race in Fort Lauderdale
House owners and renters - White residents 26,825 57.0% Owner occupied20,270 43.0% Renter occupiedHouse owners and renters - Black or African American residents 6,822 41.9% Owner occupied9,477 58.1% Renter occupiedHouse owners and renters - American Indian / Alaska Native residents 54 21.5% Owner occupied197 78.5% Renter occupiedHouse owners and renters - Asian residents 725 57.4% Owner occupied538 42.6% Renter occupiedHouse owners and renters - Native Hawaiian / Pacific Islander residents 8 37.3% Owner occupied14 62.7% Renter occupiedHouse owners and renters - Other race residents 1,285 37.5% Owner occupied2,140 62.5% Renter occupiedHouse owners and renters - Two or more races residents 5,506 46.7% Owner occupied6,288 53.3% Renter occupiedHouse owners and renters - White alone residents 26,039 59.2% Owner occupied17,943 40.8% Renter occupiedHouse owners and renters - Hispanic or Latino residents 6,151 41.1% Owner occupied8,815 58.9% Renter occupied
Language usage in Fort Lauderdale
English speakers - Total 71.4% of residents of Fort Lauderdale speak English at home.
18.5% of residents speak Spanish at home 20,836 64.3% Speak English very well11,553 35.7% Speak English less than very well10.1% of residents speak other language at home 11,591 65.8% Speak English very well6,032 34.2% Speak English less than very well
English speakers - Born in the United States 88.9% of residents of Fort Lauderdale speak English at home.
8.1% of residents speak Spanish at home 4,645 93.7% Speak English very well310 6.3% Speak English less than very well3.0% of residents speak other language at home 1,795 97.5% Speak English very well46 2.5% Speak English less than very well
English speakers - Native, born elsewhere 33.5% of residents of Fort Lauderdale speak English at home.
57.1% of residents speak Spanish at home 2,604 94.7% Speak English very well145 5.3% Speak English less than very well9.4% of residents speak other language at home 454 100.0% Speak English very well
English speakers - Foreign-born 31.1% of residents of Fort Lauderdale speak English at home.
40.0% of residents speak Spanish at home 8,019 42.8% Speak English very well10,735 57.2% Speak English less than very well28.9% of residents speak other language at home 7,789 57.4% Speak English very well5,769 42.6% Speak English less than very well
White (Caucasian) - Speak only English Native:
92.6% (66,874)Foreign-born:
35.2% (4,296)
White (Caucasian) - Speak another language Native:
7.4% (5,382)Foreign-born:
64.8% (7,904)
Black or African American - Speak only English Native:
95.4% (32,556)Foreign-born:
53.7% (7,389)
Black or African American - Speak another language Native:
4.6% (1,586)Foreign-born:
46.3% (6,363)
American Indian / Alaska Native - Speak only English Native:
73.3% (199)Foreign-born:
5.8% (17)
American Indian / Alaska Native - Speak another language Native:
26.1% (71)Foreign-born:
92.0% (270)
Asian - Speak only English Native:
42.4% (240)Foreign-born:
39.2% (951)
Asian - Speak another language Native:
57.6% (326)Foreign-born:
60.8% (1,478)
Native Hawaiian / Pacific Islander - Speak only English Native:
50.2% (33)Foreign-born:
61.1% (16)
Native Hawaiian / Pacific Islander - Speak another language Native:
60.0% (39)Foreign-born:
83.2% (22)
Other race - Speak only English Native:
41.0% (1,795)Foreign-born:
8.5% (263)
Other race - Speak another language Native:
59.0% (2,585)Foreign-born:
91.5% (2,835)
Two or more races - Speak only English Native:
52.1% (8,377)Foreign-born:
10.8% (1,659)
Two or more races - Speak another language Native:
47.9% (7,705)Foreign-born:
89.2% (13,653)
White alone - Speak only English Native:
94.8% (65,611)Foreign-born:
49.6% (4,296)
White alone - Speak another language Native:
5.2% (3,588)Foreign-born:
50.4% (4,361)
Hispanic or Latino - Speak only English Native:
31.7% (5,517)Foreign-born:
3.4% (666)
Hispanic or Latino - Speak another language Native:
68.3% (11,874)Foreign-born:
96.6% (19,045)
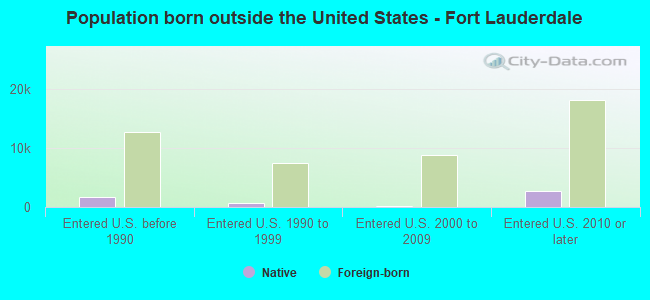
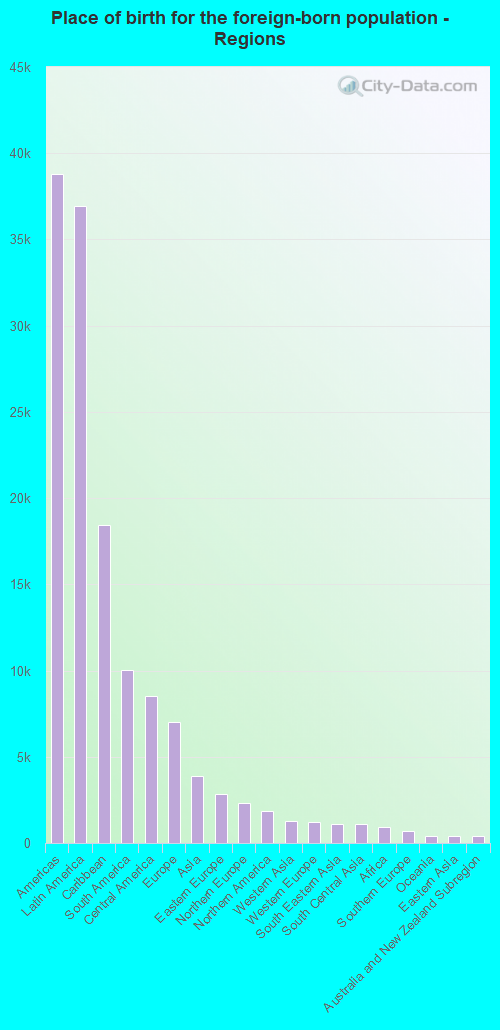
Foreign-born residents in Fort Lauderdale 51,067 residents are foreign born (19.0% Latin America , 3.6% Europe ).
This city:
27.9%Florida:
21.1%
Marital status for residents in Fort Lauderdale Marital status - White (Caucasian) population 15 years and over
Males 36.2% Never married45.3% Now married0.8% Separated1.5% Widowed16.2% DivorcedFemales 30.2% Never married43.6% Now married1.0% Separated9.7% Widowed15.5% DivorcedWomen who gave birth in the past 12 months Now married:
100.0% (674)Unmarried:
0.0% (0)
Women who did not give birth in the past 12 months Now married:
38.0% (6,200)Unmarried:
62.0% (10,120)
Marital status - Black or African American population 15 years and over
Males 55.5% Never married32.2% Now married3.3% Separated2.0% Widowed6.9% DivorcedFemales 43.2% Never married30.8% Now married3.0% Separated9.2% Widowed13.8% DivorcedWomen who gave birth in the past 12 months Now married:
30.7% (185)Unmarried:
69.3% (417)
Women who did not give birth in the past 12 months Now married:
31.1% (3,225)Unmarried:
68.9% (7,131)
Marital status - American Indian / Alaska Native population 15 years and over
Males 58.4% Never married25.2% Now married0.0% Separated0.0% Widowed16.4% DivorcedFemales 4.4% Never married54.6% Now married8.7% Separated14.0% Widowed18.3% DivorcedWomen who did not give birth in the past 12 months Now married:
56.2% (141)Unmarried:
43.8% (110)
Marital status - Asian population 15 years and over
Males 49.9% Never married40.6% Now married0.0% Separated0.0% Widowed9.5% DivorcedFemales 29.2% Never married58.4% Now married0.0% Separated2.6% Widowed9.8% DivorcedWomen who gave birth in the past 12 months Now married:
100.0% (12)Unmarried:
0.0% (0)
Women who did not give birth in the past 12 months Now married:
42.2% (272)Unmarried:
57.8% (373)
Marital status - Native Hawaiian / Pacific Islander population 15 years and over
Males 58.6% Never married0.0% Now married0.0% Separated0.0% Widowed41.4% DivorcedFemales 19.4% Never married0.0% Now married0.0% Separated0.0% Widowed80.6% DivorcedWomen who did not give birth in the past 12 months Now married:
0.0% (0)Unmarried:
100.0% (17)
Marital status - Other race population 15 years and over
Males 44.3% Never married35.5% Now married2.4% Separated5.1% Widowed12.8% DivorcedFemales 28.4% Never married39.2% Now married6.6% Separated16.8% Widowed9.1% DivorcedWomen who gave birth in the past 12 months Now married:
70.0% (62)Unmarried:
30.0% (27)
Women who did not give birth in the past 12 months Now married:
40.2% (725)Unmarried:
59.8% (1,076)
Marital status - Two or more races population 15 years and over
Males 47.2% Never married30.6% Now married4.2% Separated0.6% Widowed17.5% DivorcedFemales 42.8% Never married40.6% Now married2.9% Separated3.6% Widowed10.1% DivorcedWomen who gave birth in the past 12 months Now married:
55.3% (222)Unmarried:
44.7% (180)
Women who did not give birth in the past 12 months Now married:
43.3% (3,419)Unmarried:
56.7% (4,470)
Marital status - White alone, not Hispanic / Latino population 15 years and over
Males 36.9% Never married43.5% Now married0.8% Separated1.6% Widowed17.2% DivorcedFemales 28.2% Never married44.0% Now married1.1% Separated10.4% Widowed16.3% DivorcedWomen who gave birth in the past 12 months Now married:
100.0% (578)Unmarried:
0.0% (0)
Women who did not give birth in the past 12 months Now married:
37.7% (5,048)Unmarried:
62.3% (8,325)
Marital status - Hispanic or Latino population 15 years and over
Males 41.9% Never married39.3% Now married3.1% Separated0.6% Widowed15.2% DivorcedFemales 41.3% Never married41.9% Now married3.1% Separated5.5% Widowed8.2% DivorcedWomen who gave birth in the past 12 months Now married:
100.0% (299)Unmarried:
0.0% (0)
Women who did not give birth in the past 12 months Now married:
39.7% (4,637)Unmarried:
60.3% (7,051)
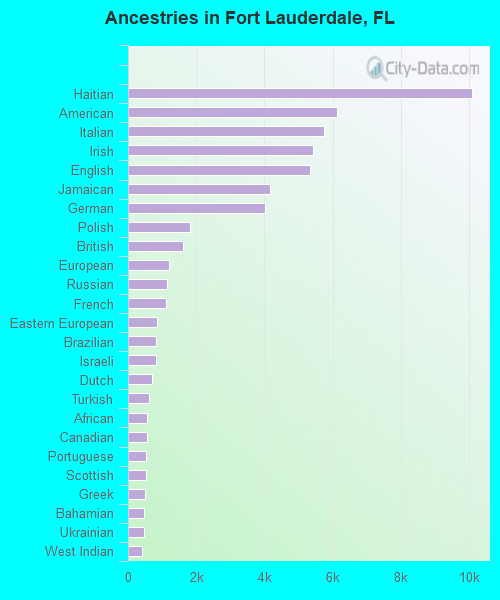
Ancestries in Fort Lauderdale
10,082 8.8% Haitian6,134 5.3% American5,756 5.0% Italian5,435 4.7% Irish5,341 4.6% English4,175 3.6% Jamaican4,004 3.5% German1,807 1.6% Polish1,627 1.4% British1,196 1.0% European1,133 1.0% Russian1,104 1.0% French842 0.7% Eastern European827 0.7% Brazilian810 0.7% Israeli708 0.6% Dutch606 0.5% Turkish564 0.5% African551 0.5% Canadian525 0.5% Portuguese521 0.5% Scottish484 0.4% Greek466 0.4% Bahamian458 0.4% Ukrainian424 0.4% West Indian404 0.4% French Canadian388 0.3% Lebanese342 0.3% Romanian321 0.3% Czech321 0.3% Slovak290 0.3% Hungarian273 0.2% Swedish270 0.2% Norwegian261 0.2% Serbian212 0.2% Trinidadian and Tobagonian198 0.2% Scotch-Irish181 0.2% Australian171 0.1% Nigerian162 0.1% Welsh152 0.1% Iranian146 0.1% Albanian137 0.1% Austrian134 0.1% Northern European129 0.1% Guyanese127 0.1% Egyptian121 0.1% Lithuanian113 0.10% Moroccan107 0.09% British West Indian98 0.09% Dutch West Indian93 0.08% Armenian91 0.08% Macedonian88 0.08% Slavic83 0.07% Danish80 0.07% South African67 0.06% Scandinavian61 0.05% Syrian54 0.05% Arab38 0.03% Zimbabwean25 0.02% Belizean22 0.02% Cypriot20 0.02% Bulgarian19 0.02% Iraqi16 0.01% Barbadian16 0.01% Finnish16 0.01% Czechoslovakian14 0.01% Luxembourger14 0.01% Slovene13 0.01% Belgian12 0.01% Pennsylvania German10 0.01% Jordanian9 0.01% Palestinian8 0.01% Latvian8 0.01% Swiss8 0.01% Maltese8 0.01% U.S. Virgin Islander6 0.01% Croatian
Geographical mobility in Fort Lauderdale Same house 1 year ago 74,140 85.4% White (Caucasian)44,337 87.2% Black or African American560 77.6% American Indian / Alaska Native2,120 76.9% Asian90 91.3% Native Hawaiian / Pacific Islander5,702 77.8% Other race26,554 81.7% Two or more races68,189 85.2% White alone, not Hispanic / Latino31,793 83.6% Hispanic or LatinoMoved within same county 6,458 7.4% White / Caucasian5,376 10.6% Black or African American47 6.6% American Indian / Alaska Native429 15.6% Asian1,039 14.2% Other race3,451 10.6% Two or more races6,152 7.7% White alone, not Hispanic / Latino3,565 9.4% Hispanic or LatinoMoved within same state 1,669 1.9% White / Caucasian400 0.8% Black or African American33 4.6% American Indian / Alaska Native132 4.8% Asian121 1.6% Other race191 0.6% Two or more races1,536 1.9% White alone, not Hispanic / Latino335 0.9% Hispanic or LatinoMoved from different state 3,554 4.1% White / Caucasian632 1.2% Black or African American24 3.3% American Indian / Alaska Native39 1.4% Asian170 2.3% Other race1,304 4.0% Two or more races3,433 4.3% White alone, not Hispanic / Latino1,079 2.8% Hispanic or LatinoMoved from abroad 1,025 1.2% White126 0.2% Black or African American63 8.7% American Indian / Alaska Native27 1.0% Asian28 28.3% Native Hawaiian / Pacific Islander195 2.7% Other race991 3.1% Two or more races701 0.9% White alone, not Hispanic / Latino1,237 3.3% Hispanic or Latino
Children Nativity (place of birth) in Fort Lauderdale
Children under 6 years - Living with two parents Both parents native 3,920 100.0% NativeBoth parents foreign-born 614 67.2% Native300 32.8% Foreign-bornOne native, one foreign-born parent 1,628 100.0% NativeChildren under 6 years - Living with one parent Native parent 2,649 93.4% Native186 6.6% Foreign-bornForeign-born parent 834 81.0% Native196 19.0% Foreign-bornChildren 6 to 17 years - Living with two parents Both parents native 5,701 100.0% NativeBoth parents foreign-born 2,001 66.6% Native1,004 33.4% Foreign-bornOne native, one foreign-born parent 1,140 100.0% NativeChildren 6 to 17 years - Living with one parent Native parent 3,621 84.2% Native678 15.8% Foreign-bornForeign-born parent 3,105 69.1% Native1,387 30.9% Foreign-born
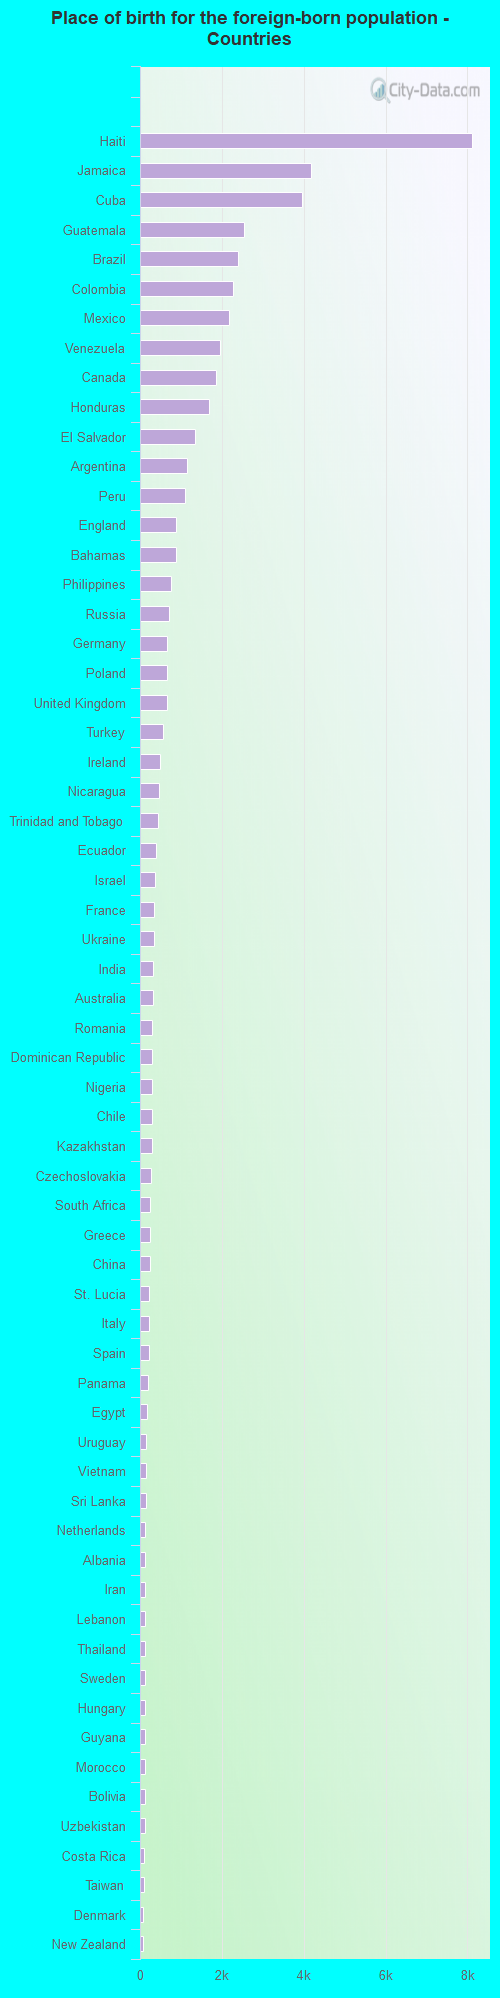
Place of birth for residents in Fort Lauderdale 38,789 Americas36,942 Latin America18,427 Caribbean10,006 South America8,508 Central America7,038 Europe3,894 Asia2,825 Eastern Europe2,293 Northern Europe1,846 Northern America1,262 Western Asia1,212 Western Europe1,129 South Eastern Asia1,104 South Central Asia939 Africa707 Southern Europe405 Oceania390 Eastern Asia388 Australia and New Zealand Subregion349 Northern Africa343 China287 Western Africa251 Southern Africa40 Eastern Africa10 Middle Africa8,123 Haiti4,177 Jamaica3,967 Cuba2,537 Guatemala2,385 Brazil2,280 Colombia2,179 Mexico1,955 Venezuela1,846 Canada1,677 Honduras1,343 El Salvador1,156 Argentina1,103 Peru885 England881 Bahamas746 Philippines712 Russia663 Germany662 Poland651 United Kingdom558 Turkey479 Ireland468 Nicaragua439 Trinidad and Tobago387 Ecuador367 Israel347 France343 Ukraine316 India310 Australia299 Romania298 Dominican Republic287 Nigeria287 Chile282 Kazakhstan258 Czechoslovakia251 South Africa251 Greece240 China228 St. Lucia223 Italy212 Spain192 Panama182 Egypt156 Uruguay153 Vietnam149 Sri Lanka133 Netherlands129 Albania128 Iran128 Lebanon124 Thailand122 Sweden116 Hungary116 Guyana116 Morocco112 Bolivia111 Uzbekistan96 Costa Rica86 Taiwan80 Denmark77 New Zealand73 Iraq66 Cambodia64 Belarus64 Pakistan62 Serbia59 Barbados54 Scotland47 Moldova46 Bulgaria40 North Macedonia (Macedonia)38 West Indies38 Malaysia34 Switzerland32 Syria30 Korea28 Armenia23 Belgium22 Jordan21 Kuwait20 Zimbabwe19 Portugal17 Fiji17 Hong Kong17 Dominica15 Japan13 Algeria11 Belize10 Georgia9 Austria9 Croatia8 Grenada7 Bosnia and Herzegovina
Grandparents responsible for own grandchildren in Fort Lauderdale
Grandparents (30 to 59 years) White / Caucasian 65 100.0% Not responsible for grandchildrenBlack or African American 198 24.3% Responsible for grandchildren616 75.7% Not responsible for grandchildrenOther race 40 90.8% Responsible for grandchildren4 9.2% Not responsible for grandchildrenTwo or more races 32 8.7% Responsible for grandchildren340 91.3% Not responsible for grandchildrenWhite alone, not Hispanic / Latino 17 100.0% Not responsible for grandchildrenHispanic or Latino 27 8.6% Responsible for grandchildren285 91.4% Not responsible for grandchildrenGrandparents (60 years and over) White / Caucasian 88 21.4% Responsible for grandchildren323 78.6% Not responsible for grandchildrenBlack or African American 433 37.5% Responsible for grandchildren723 62.5% Not responsible for grandchildrenOther race 115 100.0% Not responsible for grandchildrenTwo or more races 239 100.0% Not responsible for grandchildrenWhite alone, not Hispanic / Latino 100 20.8% Responsible for grandchildren381 79.2% Not responsible for grandchildrenHispanic or Latino 324 100.0% Not responsible for grandchildren