Fall River, MA (Massachusetts) Houses and Residents
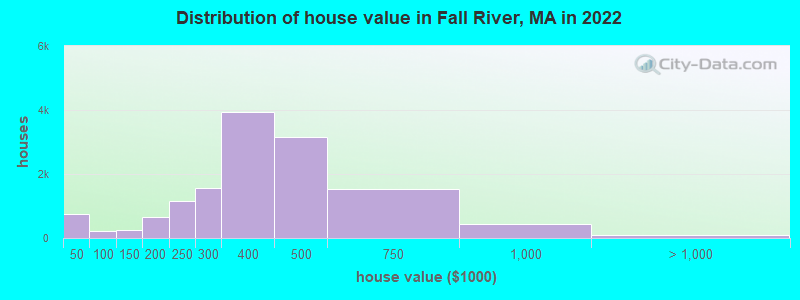
Estimated median house or condo value in 2022: $360,900 (it was $133,900 in 2000 )
Fall River:
$360,900Massachusetts:
$534,700
Lower value quartile - upper value quartile: $283,900 - $437,300Mean price in 2022: Detached houses: $372,273 Here:
$372,273State:
$651,570
Townhouses or other attached units: $353,745 Here:
$353,745State:
$617,749
In 2-unit structures: $320,065 Here:
$320,065State:
$594,808
In 3-to-4-unit structures: $427,675 Here:
$427,675State:
$601,912
In 5-or-more-unit structures: $280,761 Here:
$280,761State:
$555,768
Mobile homes: $435,017 Here:
$435,017State:
$170,209
Total population: 88,712 (All urban)
Houses: 44,303 (41,612 occupied: 15,560 owner occupied, 26,052 renter occupied )
% of renters here:
63%State:
38%
Housing density: 1,428 houses/condos per square mile
Median price asked for vacant for-sale houses and condos in 2022: $551,658.
Median contract rent in 2022: $815 (lower quartile is $562, upper quartile is $1,081)
Median rent asked for vacant for-rent units in 2022: $902
Median gross rent in Fall River, MA in 2022: $982
Housing units in Fall River with a mortgage: 9,853 (1,003 second mortgage, 70 home equity loan, 933 both second mortgage and home equity loan )Houses without a mortgage: 645
Median household income for houses/condos with a mortgage: $106,636
Median household income for apartments without a mortgage: $62,344
Median monthly housing costs: $1,068
Data:
Median house or condo value ($)
Median house or condo value ($ change since 2000)
Median house or condo value ($) - White
Median house or condo value ($) - Black or African American
Median house or condo value ($) - Asian
Median house or condo value ($) - Hispanic or Latino
Median house or condo value ($) - American Indian and Alaska Native
Median house or condo value ($) - Multirace
Median house or condo value ($) - Other Race
Median price asked for mobile homes ($)
Household density (households per square mile)
Mean house or condo value by units in structure - 1, detached ($)
Mean house or condo value by units in structure - 1, attached ($)
Mean house or condo value by units in structure - 2 ($)
Mean house or condo value by units in structure by units in structure - 3 or 4 ($)
Mean house or condo value by units in structure - 5 or more ($)
Mean house or condo value by units in structure - Boat, RV, van, etc. ($)
Mean house or condo value by units in structure - Mobile home ($)
Median contract rent ($)
Median contract rent - Lower quartile ($)
Median contract rent - Upper quartile ($)
Median gross rent ($)
Urban houses (%)
Rural houses (%)
Houses occupied (%)
Houses occupied (% change since 2000)
Houses owner occupied (%)
Houses owner occupied (% change since 2000)
Houses renter occupied (%)
Houses renter occupied (% change since 2000)
Vacant housing units - For rent (%)
Vacant housing units - For rent (% change since 2000)
Vacant housing units - For sale only (%)
Vacant housing units - For sale only (% change since 2000)
Vacant housing units - Rented or sold, not occupied (%)
Vacant housing units - Rented or sold, not occupied (% change since 2000)
Vacant housing units - For seasonal, recreational, or occasional use (%)
Vacant housing units - For seasonal, recreational, or occasional use (% change since 2000)
Vacant housing units - For migrant workers (%)
Vacant housing units - For migrant workers (% change since 2000)
Vacant housing units - Other vacant (%)
Vacant housing units - Other vacant (% change since 2000)
Median monthly housing costs ($)
Median household income for houses/condos with a mortgage ($)
Median household income for houses/condos without a mortgage ($)
Median household income ($)
Median household income ($) - White
Median household income ($) - Black or African American
Median household income ($) - Asian
Median household income ($) - Hispanic or Latino
Median household income ($) - American Indian and Alaska Native
Median household income ($) - Multirace
Median household income ($) - Other Race
Mortgage status - with mortgage (%)
Mortgage status - with second mortgage (%)
Mortgage status - with home equity loan (%)
Mortgage status - with both second mortgage and home equity loan (%)
Mortgage status - without a mortgage (%)
Median year house/condo built
Median year apartment built
Household type by relationship - Male householder living alone (%)
Household type by relationship - Male householder not living alone (%)
Household type by relationship - Female householder living alone (%)
Household type by relationship - Female householder not living alone (%)
Household type by relationship - Opposite-Sex spouse (%)
Household type by relationship - Same-Sex spouse (%)
Household type by relationship - Opposite-Sex unmarried partner (%)
Household type by relationship - Same-Sex unmarried partner (%)
Household type by relationship - In group quarters (%)
Size of family households - 2-person household (%)
Size of family households - 3-person household (%)
Size of family households - 4-person household (%)
Size of family households - 5-person household (%)
Size of family households - 6-person household (%)
Size of family households - 7-or-more-person household (%)
Size of nonfamily households - 1-person household (%)
Size of nonfamily households - 2-person household (%)
Size of nonfamily households - 3-person household (%)
Size of nonfamily households - 4-person household (%)
Size of nonfamily households - 5-person household (%)
Size of nonfamily households - 6-person household (%)
Size of nonfamily households - 7-or-moreperson household (%)
Year house built - Built 2010 or later (%)
Year house built - Built 2000 to 2009 (%)
Year house built - Built 1990 to 1999 (%)
Year house built - Built 1980 to 1989 (%)
Year house built - Built 1970 to 1979 (%)
Year house built - Built 1960 to 1969 (%)
Year house built - Built 1950 to 1959 (%)
Year house built - Built 1940 to 1949 (%)
Year house built - Built 1939 or earlier (%)
Median number of rooms in houses and condos
Median number of rooms in apartments
Median number of bedrooms in owner occupied houses
Mean number of bedrooms in owner occupied houses
Median number of bedrooms in renter occupied houses
Mean number of bedrooms in renter occupied houses
Median number of vehichles in owner occupied houses
Mean number of vehichles in owner occupied houses
Median number of vehichles in renter occupied houses
Mean number of vehichles in renter occupied houses
Rooms in owner-occupied houses - 1 room (%)
Rooms in owner-occupied houses - 2 rooms (%)
Rooms in owner-occupied houses - 3 rooms (%)
Rooms in owner-occupied houses - 4 rooms (%)
Rooms in owner-occupied houses - 5 rooms (%)
Rooms in owner-occupied houses - 6 rooms (%)
Rooms in owner-occupied houses - 7 rooms (%)
Rooms in owner-occupied houses - 8 rooms (%)
Rooms in owner-occupied houses - 9+ rooms (%)
Rooms in renter-occupied houses - 1 room (%)
Rooms in renter-occupied houses - 2 rooms (%)
Rooms in renter-occupied houses - 3 rooms (%)
Rooms in renter-occupied houses - 4 rooms (%)
Rooms in renter-occupied houses - 5 rooms (%)
Rooms in renter-occupied houses - 6 rooms (%)
Rooms in renter-occupied houses - 7 rooms (%)
Rooms in renter-occupied houses - 8 rooms (%)
Rooms in renter-occupied houses - 9+ rooms (%)
Bedrooms in owner-occupied houses - no bedrooms (%)
Bedrooms in owner-occupied houses - 1 bedroom (%)
Bedrooms in owner-occupied houses - 2 bedrooms (%)
Bedrooms in owner-occupied houses - 3 bedrooms (%)
Bedrooms in owner-occupied houses - 4 bedrooms (%)
Bedrooms in owner-occupied houses - 5+ bedrooms (%)
Bedrooms in renter-occupied houses - no bedrooms (%)
Bedrooms in renter-occupied houses - 1 bedroom (%)
Bedrooms in renter-occupied houses - 2 bedrooms (%)
Bedrooms in renter-occupied houses - 3 bedrooms (%)
Bedrooms in renter-occupied houses - 4 bedrooms (%)
Bedrooms in renter-occupied houses - 5+ bedrooms (%)
Vehicles available in owner-occupied houses - no vehicle available (%)
Vehicles available in owner-occupied houses - 1 vehicle available(%)
Vehicles available in owner-occupied houses - 2 Vehicles available (%)
Vehicles available in owner-occupied houses - 3 Vehicles available (%)
Vehicles available in owner-occupied houses - 4 Vehicles available (%)
Vehicles available in owner-occupied houses - 5+ Vehicles available (%)
Vehicles available in renter-occupied houses - no vehicle available (%)
Vehicles available in renter-occupied houses - 1 vehicle available (%)
Vehicles available in renter-occupied houses - 2 Vehicles available (%)
Vehicles available in renter-occupied houses - 3 Vehicles available (%)
Vehicles available in renter-occupied houses - 4 Vehicles available (%)
Vehicles available in renter-occupied houses - 5+ Vehicles available (%)
Housing units in structures - 1, detached (%)
Housing units in structures - 1, attached (%)
Housing units in structures - 2 (%)
Housing units in structures - 3 or 4 (%)
Housing units in structures - 5 to 9 (%)
Housing units in structures - 10 to 19 (%)
Housing units in structures - 20 to 49 (%)
Housing units in structures - 50 or more (%)
Housing units in structures - Mobile home (%)
Housing units in structures - Boat, RV, van, etc. (%)
Housing units in structures - Owners - 1, detached (%)
Housing units in structures - Owners - 1, attached (%)
Housing units in structures - Owners - 2 (%)
Housing units in structures - Owners - 3 or 4 (%)
Housing units in structures - Owners - 5 to 9 (%)
Housing units in structures - Owners - 10 to 19 (%)
Housing units in structures - Owners - 20 to 49 (%)
Housing units in structures - Owners - 50 or more (%)
Housing units in structures - Owners - Mobile home (%)
Housing units in structures - Owners - Boat, RV, van, etc. (%)
Housing units in structures - Renters - 1, detached (%)
Housing units in structures - Renters - 1, attached (%)
Housing units in structures - Renters - 2 (%)
Housing units in structures - Renters - 3 or 4 (%)
Housing units in structures - Renters - 5 to 9 (%)
Housing units in structures - Renters - 10 to 19 (%)
Housing units in structures - Renters - 20 to 49 (%)
Housing units in structures - Renters - 50 or more (%)
Housing units in structures - Renters - Mobile home (%)
Housing units in structures - Renters - Boat, RV, van, etc. (%)
House/condo owner moved in on average (years ago)
Renter moved in on average (years ago)
Year householder moved into unit - Moved in 1999 to March 2000 (%)
Year householder moved into unit - Moved in 1999 to March 2000 (%) - White
Year householder moved into unit - Moved in 1999 to March 2000 (%) - Black or African American
Year householder moved into unit - Moved in 1999 to March 2000 (%) - Asian
Year householder moved into unit - Moved in 1999 to March 2000 (%) - Hispanic or Latino
Year householder moved into unit - Moved in 1999 to March 2000 (%) - American Indian and Alaska Native
Year householder moved into unit - Moved in 1999 to March 2000 (%) - Multirace
Year householder moved into unit - Moved in 1999 to March 2000 (%) - Other Race
Year householder moved into unit - Moved in 1995 to 1998 (%)
Year householder moved into unit - Moved in 1995 to 1998 (%) - White
Year householder moved into unit - Moved in 1995 to 1998 (%) - Black or African American
Year householder moved into unit - Moved in 1995 to 1998 (%) - Asian
Year householder moved into unit - Moved in 1995 to 1998 (%) - Hispanic or Latino
Year householder moved into unit - Moved in 1995 to 1998 (%) - American Indian and Alaska Native
Year householder moved into unit - Moved in 1995 to 1998 (%) - Multirace
Year householder moved into unit - Moved in 1995 to 1998 (%) - Other Race
Year householder moved into unit - Moved in 1990 to 1994 (%)
Year householder moved into unit - Moved in 1990 to 1994 (%) - White
Year householder moved into unit - Moved in 1990 to 1994 (%) - Black or African American
Year householder moved into unit - Moved in 1990 to 1994 (%) - Asian
Year householder moved into unit - Moved in 1990 to 1994 (%) - Hispanic or Latino
Year householder moved into unit - Moved in 1990 to 1994 (%) - American Indian and Alaska Native
Year householder moved into unit - Moved in 1990 to 1994 (%) - Multirace
Year householder moved into unit - Moved in 1990 to 1994 (%) - Other Race
Year householder moved into unit - Moved in 1980 to 1989 (%)
Year householder moved into unit - Moved in 1980 to 1989 (%) - White
Year householder moved into unit - Moved in 1980 to 1989 (%) - Black or African American
Year householder moved into unit - Moved in 1980 to 1989 (%) - Asian
Year householder moved into unit - Moved in 1980 to 1989 (%) - Hispanic or Latino
Year householder moved into unit - Moved in 1980 to 1989 (%) - American Indian and Alaska Native
Year householder moved into unit - Moved in 1980 to 1989 (%) - Multirace
Year householder moved into unit - Moved in 1980 to 1989 (%) - Other Race
Year householder moved into unit - Moved in 1970 to 1979 (%)
Year householder moved into unit - Moved in 1970 to 1979 (%) - White
Year householder moved into unit - Moved in 1970 to 1979 (%) - Black or African American
Year householder moved into unit - Moved in 1970 to 1979 (%) - Asian
Year householder moved into unit - Moved in 1970 to 1979 (%) - Hispanic or Latino
Year householder moved into unit - Moved in 1970 to 1979 (%) - American Indian and Alaska Native
Year householder moved into unit - Moved in 1970 to 1979 (%) - Multirace
Year householder moved into unit - Moved in 1970 to 1979 (%) - Other Race
Year householder moved into unit - Moved in 1969 or earlier (%)
Year householder moved into unit - Moved in 1969 or earlier (%) - White
Year householder moved into unit - Moved in 1969 or earlier (%) - Black or African American
Year householder moved into unit - Moved in 1969 or earlier (%) - Asian
Year householder moved into unit - Moved in 1969 or earlier (%) - Hispanic or Latino
Year householder moved into unit - Moved in 1969 or earlier (%) - American Indian and Alaska Native
Year householder moved into unit - Moved in 1969 or earlier (%) - Multirace
Year householder moved into unit - Moved in 1969 or earlier (%) - Other Race
Housing units lacking complete plumbing facilities (%)
Housing units lacking complete kitchen facilities (%)
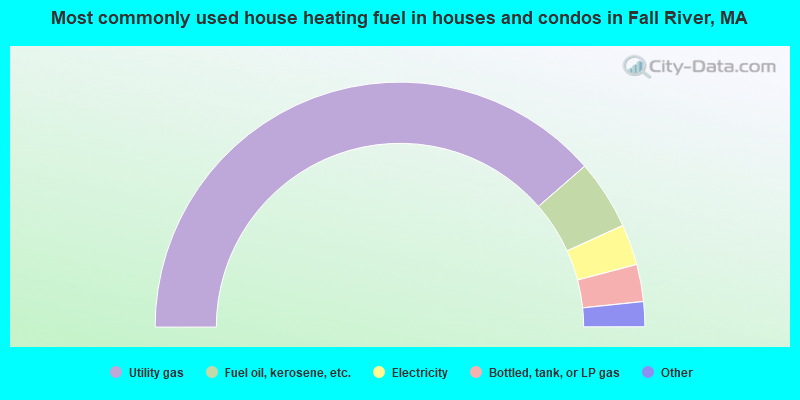
House heating fuel used in houses and condos - Utility gas (%)
House heating fuel used in houses and condos - Bottled, tank, or LP gas (%)
House heating fuel used in houses and condos - Electricity (%)
House heating fuel used in houses and condos - Fuel oil, kerosene, etc. (%)
House heating fuel used in houses and condos - Coal or coke (%)
House heating fuel used in houses and condos - Wood (%)
House heating fuel used in houses and condos - Solar energy (%)
House heating fuel used in houses and condos - Other fuel (%)
House heating fuel used in houses and condos - No fuel used (%)
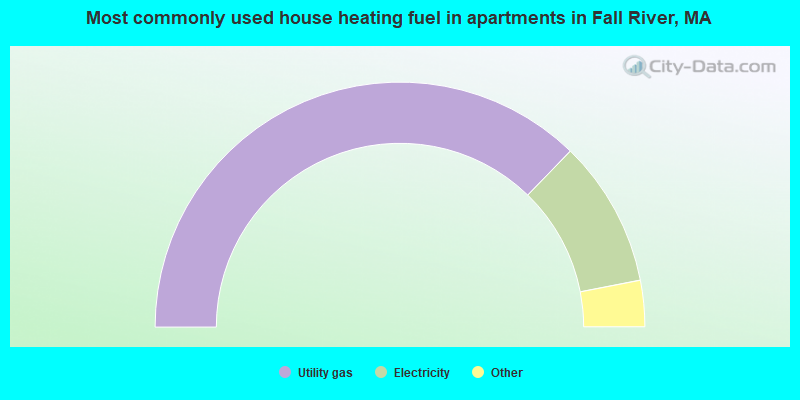
House heating fuel used in apartments - Utility gas (%)
House heating fuel used in apartments - Bottled, tank, or LP gas (%)
House heating fuel used in apartments - Electricity (%)
House heating fuel used in apartments - Fuel oil, kerosene, etc. (%)
House heating fuel used in apartments - Coal or coke (%)
House heating fuel used in apartments - Wood (%)
House heating fuel used in apartments - Solar energy (%)
House heating fuel used in apartments - Other fuel (%)
House heating fuel used in apartments - No fuel used (%)
Median year house/condo built: 1960Median year apartment built: 1949Household type by relationship:
Households: 93,689
Male householders: 17,362 (6,256 living alone ), Female householders: 24,250 (9,454 living alone )10,594 spouses (10,320 opposite-sex spouses ), 4,087 unmarried partners , (3,910 opposite-sex unmarried partners ), 24,357 children (23,412 natural , 492 adopted , 453 stepchildren ), 2,597 grandchildren , 754 brothers or sisters , 1,303 parents , 92 foster children , 3,406 other relatives , 3,266 non-relatives In group quarters: 1,621
Size of family households: 9,532 2-persons , 5,548 3-persons , 3,600 4-persons , 1,630 5-persons , 367 6-persons , 937 7-or-more-persons .
Size of nonfamily households: 15,710 1-person , 3,866 2-persons , 299 3-persons , 123 4-persons .
5,890 married couples with children. single-parent households (715 men , 9,587 women ).
62.7% of residents of Fall River speak English at home. of residents speak Spanish at home (58% speak English very well , 9% speak English well , 9% speak English not well , 23% don't speak English at all ).of residents speak other Indo-European language at home (57% speak English very well , 19% speak English well , 14% speak English not well , 10% don't speak English at all ).of residents speak Asian or Pacific Island language at home (54% speak English very well , 6% speak English well , 33% speak English not well , 7% don't speak English at all ).of residents speak other language at home (72% speak English very well , 22% speak English well , 6% don't speak English at all ).
Foreign born population: 19,013 (20.3%)of them are naturalized citizens )
Median number of rooms in houses and condos:
Median number of rooms in apartments
Owner-occupied Renter-occupied
Rooms in owner-occupied houses in Fall River, Massachusetts
44 1 room 58 2 rooms 233 3 rooms 1,668 4 rooms 3,748 5 rooms 4,036 6 rooms 2,239 7 rooms 1,704 8 rooms 1,830 9+ rooms
Rooms in renter-occupied apartments in Fall River, Massachusetts
815 1 room 1,978 2 rooms 4,061 3 rooms 7,243 4 rooms 6,161 5 rooms 3,701 6 rooms 1,003 7 rooms 772 8 rooms 318 9+ rooms
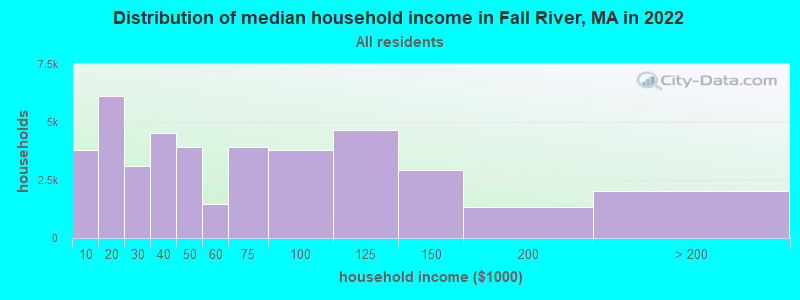
Fall River, MA household income distribution 3,786 Less than $10,0006,132 $10,000 to $19,9993,089 $20,000 to $29,9994,536 $30,000 to $39,9993,914 $40,000 to $49,9991,483 $50,000 to $59,9993,940 $60,000 to $74,9993,795 $75,000 to $99,9994,644 $100,000 to $124,9992,915 $125,000 to $149,9991,357 $150,000 to $199,9992,021 $200,000 or more
Home value of owner - occupied houses in 2022 in Fall River, MA 527 Less than $10,00058 $10,000 to $14,99910 $15,000 to $19,99938 $20,000 to $24,99922 $25,000 to $29,99940 $30,000 to $34,99952 $35,000 to $39,99911 $40,000 to $49,99911 $50,000 to $59,99918 $60,000 to $69,9994 $70,000 to $79,9999 $80,000 to $89,999166 $90,000 to $99,999118 $100,000 to $124,999132 $125,000 to $149,999436 $150,000 to $174,999225 $175,000 to $199,9991,154 $200,000 to $249,9991,572 $250,000 to $299,9993,949 $300,000 to $399,9993,147 $400,000 to $499,9991,516 $500,000 to $749,999425 $750,000 to $999,9999 $1,000,000 to $1,499,99920 $1,500,000 to $1,999,99953 $2,000,000 or moreRent paid by renters in 2022 in Fall River, MA 209 Less than $100424 $100 to $149366 $150 to $199703 $200 to $2492,090 $250 to $299292 $300 to $349661 $350 to $399413 $400 to $449317 $450 to $499633 $500 to $549991 $550 to $599793 $600 to $649891 $650 to $6992,000 $700 to $7491,368 $750 to $7993,497 $800 to $8992,277 $900 to $9993,385 $1,000 to $1,2491,567 $1,250 to $1,4991,971 $1,500 to $1,999510 $2,000 to $2,499694 No cash rent
Percentage of workers working in this county: 74.3%Number of people working at home: 3,394 (7.8% of all workers )
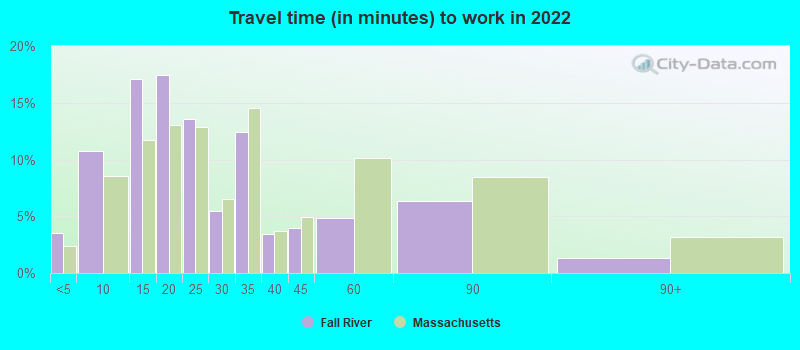
Travel time to work (commute)
Less than 5 minutes: 1,3295 to 9 minutes: 4,07410 to 14 minutes: 5,74215 to 19 minutes: 6,51720 to 24 minutes: 4,51725 to 29 minutes: 1,34630 to 34 minutes: 5,79635 to 39 minutes: 1,72840 to 44 minutes: 1,34245 to 59 minutes: 3,04260 to 89 minutes: 3,09390 or more minutes: 675
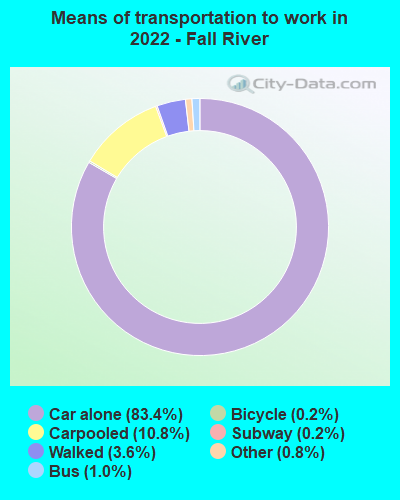
Means of transportation to work:
Drove a car alone: 31,994 (75.2%)Carpooled: 4,590 (10.8%)Bus : 333 (0.8%)Long-distance train or commuter rail : 172 (0.4%)Taxi: 339 (0.8%)Bicycle: 55 (0.1%)Walked: 983 (2.3%)Worked at home: 3,394 (8.0%)
Unemployment by race in 2022
Unemployment rate for White non-Hispanic residents 9.8% Males6.5% FemalesUnemployment rate for Black residents 4.2% Males6.8% FemalesUnemployment rate for Asian residents 3.4% Males4.4% FemalesUnemployment rate for other race residents 5.0% Males4.9% FemalesUnemployment rate for two or more race residents 12.8% Males8.4% FemalesUnemployment rate for Hispanic or Latino residents 4.3% Males10.2% Females
Year of entry for the foreign-born population in Fall River, Massachusetts
6,548 2010 or later 2,870 2000 to 2009 2,632 1990 to 1999 4,119 1980 to 1989 5,793 1970 to 1979 5,824 Before 1970
First ancestries reported:
Portuguese: 23,141 (44.8%)
Brazilian: 2,236 (4.3%)
Irish: 2,205 (4.3%)
English: 2,097 (4.1%)
Cape Verdean: 1,733 (3.4%)
American: 1,557 (3.0%)
French Canadian: 1,353 (2.6%)
Italian: 1,322 (2.6%)
French: 1,170 (2.3%)
Haitian: 571 (1.1%)
German: 306 (0.6%)
Polish: 300 (0.6%)
Nigerian: 295 (0.6%)
African: 194 (0.4%)
Jamaican: 173 (0.3%)
European: 171 (0.3%)
Trinidadian and Tobagonian: 99 (0.2%)
Lebanese: 97 (0.2%)
Russian: 86 (0.2%)
Belgian: 83 (0.2%)
Canadian: 81 (0.2%)
Senegalese: 79 (0.2%)
Ukrainian: 78 (0.2%)
Ghanaian: 73 (0.1%)
Greek: 64 (0.1%)
West Indian: 61 (0.1%)
Moroccan: 56 (0.1%)
Norwegian: 54 (0.1%)
Lithuanian: 53 (0.1%)
Eastern European: 49 (0.09%)
Danish: 48 (0.09%)
Iranian: 41 (0.08%)
Swedish: 37 (0.07%)
Scottish: 31 (0.06%)
Northern European: 29 (0.06%)
Dutch: 25 (0.05%)
Egyptian: 24 (0.05%)
Albanian: 24 (0.05%)
British: 20 (0.04%)
Ugandan: 19 (0.04%)
Belizean: 19 (0.04%)
Scotch-Irish: 18 (0.03%)
Romanian: 11 (0.02%)
Barbadian: 11 (0.02%)
Austrian: 7 (0.01%)
Swiss: 5 (0.01%)
Czechoslovakian: 5 (0.01%)
Guyanese: 4 (0.01%)
Most common places of birth for foreign-born residents (%): Portugal Fall River:
45.8% (9,719)Massachusetts:
4.1% (50,360)
Brazil Fall River:
18.1% (3,834)Massachusetts:
7.6% (92,959)
Azores Islands Fall River:
14.9% (3,169)Massachusetts:
0.9% (10,768)
Cabo Verde Fall River:
6.2% (1,322)Massachusetts:
2.6% (32,354)
Ecuador Fall River:
3.6% (774)Massachusetts:
1.0% (11,727)
Cambodia Fall River:
3.2% (680)Massachusetts:
1.2% (14,305)
Dominican Republic Fall River:
2.6% (543)Massachusetts:
8.3% (101,767)
Haiti Fall River:
2.5% (536)Massachusetts:
4.9% (60,432)
Place of birth for U.S.-born residents:
This state: 58,927Other state: 12,948Northeast: 7,247Midwest: 480South: 4,181West: 1,040 88.0% of Fall River residents lived in the same house 1 years ago.
Out of people who lived in different houses, 40.9% lived in this county.
Out of people who lived in different counties, 58.8% lived in Massachusetts.
Fall River:
88.0%State average:
87.7%
Education attainment for males 25 years and older:
No schooling: 1,541Nursery to 4th grade: 8425th and 6th grade: 7767th and 8th grade: 9029th grade: 63510th grade: 91711th grade: 79712th grade, no diploma: 1,228High school graduate (or equivalency): 11,417Less than 1 year of college: 2,055Some college more than 1 year, no degree: 2,387Associate degree: 1,478Bachelor's degree: 3,381Master's degree: 952Professional school degree: 69Doctorate degree: 568
Education attainment for females 25 years and older:
No schooling: 1,138Nursery to 4th grade: 9795th and 6th grade: 6357th and 8th grade: 1,8869th grade: 51210th grade: 49711th grade: 83212th grade, no diploma: 824High school graduate (or equivalency): 11,893Less than 1 year of college: 2,399Some college more than 1 year, no degree: 4,779Associate degree: 3,668Bachelor's degree: 5,480Master's degree: 1,490Professional school degree: 300Doctorate degree: 529
Housing units in structures:
One, detached: 11,166One, attached: 630Two: 4,4413 or 4: 13,8975 to 9: 6,49910 to 19: 2,65020 to 49: 1,51650 or more: 3,449Mobile homes: 55Housing units lacking complete plumbing facilities in 2022: 1.7%Housing units lacking complete kitchen facilities in 2022: 3.4%House/condo owner moved in on average 15 years ago
Renter moved in on average 5 years ago
Private vs. public school enrollment:
Students in private schools in grades 1 to 8 (elementary and middle school): 925 Here:
9.0%Massachusetts:
10.3%
Students in private schools in grades 9 to 12 (high school): 127 Here:
2.9%Massachusetts:
12.3%
Students in private undergraduate colleges: 559 Here:
33.0%Massachusetts:
51.2%