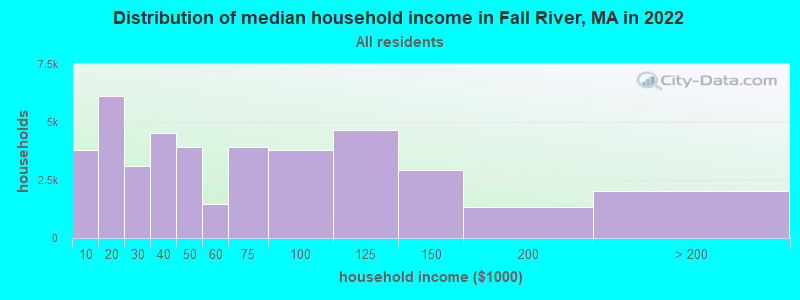
The median household income in Fall River, MA in 2022 was $46,789, which was 101.9% less than the median annual income of $94,488 across the entire state of Massachusetts. Compared to the median income of $29,014 in 2000 this represents an increase of 38.0%. The per capita income in 2022 was $29,944, which means an increase of 46.2% compared to 2000 when it was $16,118.
Whole page based on the data from 2000 / 2022 when the population of Fall River, Massachusetts was 91,938 / 93,689
Income statistics for all residents
Median household income in Fall River, MA in 2022:
Fall River:
$46,789
State:
$94,488
Change in median household income between 2000 and 2022:
Fall River, Massachusetts:
+61.3%
State:
+87.1%
Number of households with income < $10k:
Fall River:
9.1% (3,786)
Massachusetts:
5.2% (146,170)
Number of households with income $10k - 20k:
Fall River:
14.7% (6,132)
State:
6.4% (180,001)
Number of households with income $20k - 30k:
Fall River:
7.4% (3,089)
State:
5.6% (156,667)
Number of households with income $30k - 40k:
Fall River:
10.9% (4,536)
State:
5.6% (157,168)
Number of households with income $40k - 50k:
Fall River:
9.4% (3,914)
State:
5.4% (151,455)
Number of households with income $50k - 60k:
Fall River:
3.6% (1,483)
State:
5.1% (142,726)
Number of households with income $60k - 75k:
Fall River:
9.5% (3,940)
State:
7.6% (212,203)
Number of households with income $75k - 100k:
Fall River:
9.1% (3,795)
State:
11.3% (317,064)
Number of households with income $100k - 125k:
Fall River:
11.2% (4,644)
Massachusetts:
9.7% (270,603)
Number of households with income $125k - 150k:
Fall River:
7.0% (2,915)
State:
8.0% (223,140)
Number of households with income $150k - 200k:
Fall River:
3.3% (1,357)
State:
11.0% (308,695)
Number of households with income > $200k:
Fall River:
4.9% (2,021)
State:
19.0% (531,884)
Aggregate household income in Fall River in 2022: $2,811,102,500
Median family income in Fall River in 2022:
Fall River:
$61,560
State:
$120,263
Number of families with income < $10k:
Fall River:
7.6% (1,637)
State:
2.9% (49,671)
Number of families with income $10k - 20k:
Fall River:
7.3% (1,570)
State:
2.9% (50,542)
Number of families with income $20k - 30k:
Fall River:
8.6% (1,860)
Massachusetts:
3.9% (66,398)
Number of families with income $30k - 40k:
Fall River:
14.4% (3,109)
State:
4.5% (78,234)
Number of families with income $40k - 50k:
Fall River:
6.6% (1,426)
State:
4.5% (77,656)
Number of families with income $50k - 60k:
Fall River:
4.9% (1,064)
State:
4.5% (77,928)
Number of families with income $60k - 75k:
Fall River:
7.5% (1,627)
State:
7.0% (120,295)
Number of families with income $75k - 100k:
Fall River:
9.6% (2,074)
State:
11.1% (192,172)
Number of families with income $100k - 125k:
Fall River:
13.5% (2,926)
Massachusetts:
10.6% (182,105)
Number of families with income $125k - 150k:
Fall River:
8.7% (1,880)
State:
9.3% (159,566)
Number of families with income $150k - 200k:
Fall River:
6.7% (1,447)
Massachusetts:
13.4% (231,410)
Number of families with income > $200k:
Fall River:
4.6% (994)
Massachusetts:
25.4% (438,378)
Median non-family income in Fall River in 2022:
Fall River:
$36,227
State:
$55,979
Change in median non-family income between 2000 and 2022:
Fall River, Massachusetts:
+122.6%
Massachusetts:
+88.0%
Median per capita income in Fall River in 2022:
Fall River:
$29,944
State:
$54,025
Change in median per capita income between 2000 and 2022:
Fall River, Massachusetts:
+85.8%
State:
+108.2%
Income statistics for White residents
Median household income in Fall River, MA in 2022:
Fall River:
$49,561
State:
$101,391
Change in median household income between 2000 and 2022:
Fall River, Massachusetts:
+65.6%
State:
+93.3%
Number of households with income < $10k:
Fall River:
10.1% (3,325)
State:
4.4% (91,120)
Number of households with income $10k - 20k:
Fall River:
13.3% (4,356)
State:
5.9% (122,055)
Number of households with income $20k - 30k:
Fall River:
7.5% (2,453)
State:
5.1% (105,311)
Number of households with income $30k - 40k:
Fall River:
9.7% (3,176)
State:
5.3% (110,239)
Number of households with income $40k - 50k:
Fall River:
9.6% (3,145)
State:
5.0% (104,636)
Number of households with income $50k - 60k:
Fall River:
3.3% (1,071)
State:
4.8% (99,486)
Number of households with income $60k - 75k:
Fall River:
9.4% (3,072)
State:
7.5% (155,124)
Number of households with income $75k - 100k:
Fall River:
8.6% (2,819)
State:
11.4% (236,252)
Number of households with income $100k - 125k:
Fall River:
12.6% (4,128)
State:
9.9% (204,731)
Number of households with income $125k - 150k:
Fall River:
6.7% (2,211)
State:
8.5% (175,324)
Number of households with income $150k - 200k:
Fall River:
3.7% (1,226)
Massachusetts:
11.7% (242,980)
Number of households with income > $200k:
Fall River:
5.6% (1,829)
State:
20.5% (425,966)
Aggregate household income in Fall River in 2022: $2,299,817,200
Median family income in Fall River in 2022:
Fall River:
$71,763
State:
$133,153
Number of families with income < $10k:
Fall River:
8.1% (1,308)
State:
2.0% (25,038)
Number of families with income $10k - 20k:
Fall River:
6.3% (1,018)
State:
2.1% (26,403)
Number of families with income $20k - 30k:
Fall River:
6.1% (990)
State:
2.6% (32,525)
Number of families with income $30k - 40k:
Fall River:
12.1% (1,963)
State:
3.9% (48,079)
Number of families with income $40k - 50k:
Fall River:
6.7% (1,090)
State:
3.8% (46,908)
Number of families with income $50k - 60k:
Fall River:
4.6% (751)
State:
3.8% (46,476)
Number of families with income $60k - 75k:
Fall River:
9.3% (1,510)
State:
6.4% (79,040)
Number of families with income $75k - 100k:
Fall River:
8.9% (1,438)
Massachusetts:
11.1% (137,395)
Number of families with income $100k - 125k:
Fall River:
15.3% (2,472)
State:
11.1% (136,771)
Number of families with income $125k - 150k:
Fall River:
8.3% (1,343)
State:
10.0% (123,709)
Number of families with income $150k - 200k:
Fall River:
8.4% (1,360)
State:
14.7% (181,602)
Number of families with income > $200k:
Fall River:
5.9% (948)
Massachusetts:
28.5% (351,887)
Median non-family income in Fall River in 2022:
Fall River:
$36,159
State:
$59,323
Change in median non-family income between 2000 and 2022:
Fall River, Massachusetts:
+120.8%
State:
+94.3%
Median per capita income in Fall River in 2022:
Fall River:
$33,449
State:
$60,804
Change in median per capita income between 2000 and 2022:
Fall River, Massachusetts:
+100.5%
Massachusetts:
+118.7%
Income statistics for Black or African American residents
Median household income in Fall River, MA in 2022:
Fall River:
$50,479
State:
$63,189
Number of households with income < $10k:
Fall River:
9.4% (263)
Massachusetts:
9.1% (15,797)
Number of households with income $10k - 20k:
Fall River:
6.4% (179)
State:
9.4% (16,267)
Number of households with income $20k - 30k:
Fall River:
5.4% (151)
State:
7.8% (13,520)
Number of households with income $30k - 40k:
Fall River:
10.4% (291)
State:
8.3% (14,412)
Number of households with income $40k - 50k:
Fall River:
12.9% (361)
State:
7.9% (13,790)
Number of households with income $50k - 60k:
Fall River:
4.5% (125)
Massachusetts:
5.8% (10,041)
Number of households with income $60k - 75k:
Fall River:
15.6% (436)
State:
8.5% (14,822)
Number of households with income $75k - 100k:
Fall River:
16.3% (456)
State:
11.0% (19,122)
Number of households with income $100k - 125k:
Fall River:
11.5% (323)
Massachusetts:
8.4% (14,575)
Number of households with income $125k - 150k:
Fall River:
5.2% (145)
Massachusetts:
6.0% (10,429)
Number of households with income $150k - 200k:
Fall River:
2.3% (65)
Massachusetts:
7.2% (12,539)
Number of households with income > $200k:
Fall River:
0.3% (8)
State:
10.5% (18,185)
Aggregate household income in Fall River in 2022: $160,205,100
Median family income in Fall River in 2022:
Fall River:
$65,042
State:
$79,815
Number of families with income < $10k:
Fall River:
11.5% (211)
Massachusetts:
6.3% (6,915)
Number of families with income $10k - 20k:
Fall River:
7.4% (136)
State:
6.8% (7,412)
Number of families with income $20k - 30k:
Fall River:
5.8% (106)
Massachusetts:
6.6% (7,274)
Number of families with income $30k - 40k:
Fall River:
10.2% (186)
State:
6.4% (7,002)
Number of families with income $40k - 50k:
Fall River:
4.5% (82)
Massachusetts:
7.9% (8,656)
Number of families with income $50k - 60k:
Fall River:
12.0% (219)
State:
6.4% (6,986)
Number of families with income $60k - 75k:
Fall River:
13.4% (246)
State:
7.9% (8,699)
Number of families with income $75k - 100k:
Fall River:
17.9% (328)
State:
11.5% (12,654)
Number of families with income $100k - 125k:
Fall River:
7.2% (132)
State:
10.4% (11,452)
Number of families with income $125k - 150k:
Fall River:
5.8% (106)
State:
7.5% (8,277)
Number of families with income $150k - 200k:
Fall River:
4.1% (75)
State:
9.3% (10,230)
Number of families with income > $200k:
Fall River:
0.3% (6)
State:
12.9% (14,108)
Median non-family income in Fall River in 2022:
Fall River:
$45,278
Massachusetts:
$38,934
Change in median non-family income between 2000 and 2022:
Fall River, Massachusetts:
+110.0%
State:
+69.2%
Median per capita income in Fall River in 2022:
Fall River:
$23,770
State:
$33,524
Income statistics for Asian residents
Median household income in Fall River, MA in 2022:
Fall River:
$90,748
State:
$117,855
Number of households with income < $10k:
Fall River:
8.4% (71)
State:
6.8% (11,982)
Number of households with income $10k - 20k:
Fall River:
13.0% (110)
State:
4.8% (8,376)
Number of households with income $20k - 30k:
Fall River:
10.3% (87)
State:
3.7% (6,558)
Number of households with income $30k - 40k:
Fall River:
6.4% (54)
State:
3.3% (5,748)
Number of households with income $40k - 50k:
Fall River:
1.1% (9)
State:
4.1% (7,192)
Number of households with income $50k - 60k:
Fall River:
25.9% (219)
State:
5.0% (8,734)
Number of households with income $60k - 75k:
Fall River:
0.0% (0)
State:
5.8% (10,203)
Number of households with income $75k - 100k:
Fall River:
22.3% (188)
State:
8.6% (15,154)
Number of households with income $100k - 125k:
Fall River:
6.8% (57)
State:
10.8% (18,942)
Number of households with income $125k - 150k:
Fall River:
0.0% (0)
Massachusetts:
8.0% (14,037)
Number of households with income $150k - 200k:
Fall River:
3.7% (31)
Massachusetts:
12.5% (21,856)
Number of households with income > $200k:
Fall River:
2.1% (18)
State:
26.6% (46,694)
Aggregate household income in Fall River in 2022: $34,796,300
Median family income in Fall River in 2022:
Fall River:
$91,654
Massachusetts:
$140,113
Number of families with income < $10k:
Fall River:
10.2% (68)
State:
3.2% (3,752)
Number of families with income $10k - 20k:
Fall River:
22.3% (149)
Massachusetts:
3.5% (4,118)
Number of families with income $20k - 30k:
Fall River:
9.0% (60)
State:
2.3% (2,708)
Number of families with income $30k - 40k:
Fall River:
4.0% (27)
State:
2.8% (3,234)
Number of families with income $40k - 50k:
Fall River:
13.6% (91)
State:
3.9% (4,621)
Number of families with income $50k - 60k:
Fall River:
4.7% (31)
State:
3.9% (4,606)
Number of families with income $75k - 100k:
Fall River:
22.1% (147)
State:
8.5% (10,022)
Number of families with income $100k - 125k:
Fall River:
7.7% (51)
State:
10.0% (11,697)
Number of families with income $150k - 200k:
Fall River:
4.4% (30)
State:
13.2% (15,478)
Number of families with income > $200k:
Fall River:
2.0% (13)
Massachusetts:
34.0% (39,856)
Median per capita income in Fall River in 2022:
Fall River:
$25,003
State:
$58,900
Income statistics for Hispanic or Latino residents
Median household income in Fall River, MA in 2022:
Fall River:
$33,105
State:
$61,523
Change in median household income between 2000 and 2022:
Fall River, Massachusetts:
+102.6%
State:
+125.4%
Number of households with income < $10k:
Fall River:
8.5% (327)
State:
8.8% (25,307)
Number of households with income $10k - 20k:
Fall River:
14.3% (550)
State:
10.0% (28,653)
Number of households with income $20k - 30k:
Fall River:
8.7% (335)
State:
8.8% (25,189)
Number of households with income $30k - 40k:
Fall River:
15.0% (579)
Massachusetts:
7.2% (20,822)
Number of households with income $40k - 50k:
Fall River:
6.4% (247)
Massachusetts:
7.2% (20,817)
Number of households with income $50k - 60k:
Fall River:
6.6% (254)
State:
6.5% (18,748)
Number of households with income $60k - 75k:
Fall River:
12.8% (494)
State:
8.8% (25,390)
Number of households with income $75k - 100k:
Fall River:
9.9% (381)
State:
12.0% (34,488)
Number of households with income $100k - 125k:
Fall River:
7.6% (294)
State:
8.6% (24,599)
Number of households with income $125k - 150k:
Fall River:
4.4% (170)
State:
6.2% (17,743)
Number of households with income $150k - 200k:
Fall River:
3.4% (132)
Massachusetts:
7.3% (21,017)
Number of households with income > $200k:
Fall River:
2.3% (87)
State:
8.6% (24,606)
Aggregate household income in Fall River in 2022: $182,551,100
Median family income in Fall River in 2022:
Fall River:
$33,850
State:
$66,072
Number of families with income < $10k:
Fall River:
15.3% (447)
State:
6.2% (12,456)
Number of families with income $10k - 20k:
Fall River:
8.4% (246)
State:
6.0% (12,071)
Number of families with income $20k - 30k:
Fall River:
15.3% (447)
State:
10.1% (20,376)
Number of families with income $30k - 40k:
Fall River:
11.6% (339)
Massachusetts:
8.2% (16,470)
Number of families with income $40k - 50k:
Fall River:
8.0% (235)
Massachusetts:
7.4% (14,829)
Number of families with income $50k - 60k:
Fall River:
4.1% (120)
Massachusetts:
7.3% (14,643)
Number of families with income $60k - 75k:
Fall River:
11.7% (343)
Massachusetts:
10.6% (21,252)
Number of families with income $75k - 100k:
Fall River:
9.8% (287)
State:
12.0% (24,088)
Number of families with income $100k - 125k:
Fall River:
4.6% (134)
Massachusetts:
8.9% (17,954)
Number of families with income $125k - 150k:
Fall River:
7.8% (227)
State:
6.9% (13,837)
Number of families with income $150k - 200k:
Fall River:
3.2% (93)
Massachusetts:
7.3% (14,683)
Number of families with income > $200k:
Fall River:
0.3% (8)
State:
9.3% (18,741)
Median non-family income in Fall River in 2022:
Fall River:
$16,834
State:
$37,563
Change in median non-family income between 2000 and 2022:: -6.8%
Fall River, Massachusetts:
-6.8%
Massachusetts:
+115.0%
Median per capita income in Fall River in 2022:
Fall River:
$18,828
State:
$28,993
Income statistics for American Indian and Alaska Native residents
Number of households with income < $10k:
Fall River:
27.4% (48)
State:
6.6% (451)
Number of households with income $10k - 20k:
Fall River:
5.7% (10)
State:
7.0% (476)
Number of households with income $20k - 30k:
Fall River:
3.4% (6)
Massachusetts:
2.8% (192)
Number of households with income $30k - 40k:
Fall River:
6.9% (12)
State:
3.2% (218)
Number of households with income $40k - 50k:
Fall River:
0.0% (0)
Massachusetts:
2.9% (199)
Number of households with income $50k - 60k:
Fall River:
56.6% (99)
Massachusetts:
9.9% (677)
Number of households with income $60k - 75k:
Fall River:
0.0% (0)
Massachusetts:
11.5% (781)
Number of households with income $75k - 100k:
Fall River:
0.0% (0)
State:
9.2% (629)
Number of households with income $100k - 125k:
Fall River:
0.0% (0)
Massachusetts:
6.0% (406)
Number of households with income $125k - 150k:
Fall River:
0.0% (0)
Massachusetts:
13.5% (921)
Number of households with income $150k - 200k:
Fall River:
0.0% (0)
State:
12.6% (859)
Number of households with income > $200k:
Fall River:
0.0% (0)
Massachusetts:
14.7% (1,003)
Aggregate household income in Fall River in 2022: $3,235,051
Median per capita income in Fall River in 2022:
Fall River:
$11,688
State:
$39,434
Change in median per capita income between 2000 and 2022:: -2.9%
Fall River, Massachusetts:
-2.9%
State:
+148.2%
Income statistics for Multirace residents
Median household income in Fall River, MA in 2022:
Fall River:
$39,681
State:
$71,552
Change in median household income between 2000 and 2022:
Fall River, Massachusetts:
+58.1%
State:
+109.0%
Number of households with income < $10k:
Fall River:
7.2% (260)
Massachusetts:
6.6% (15,127)
Number of households with income $10k - 20k:
Fall River:
11.2% (408)
Massachusetts:
9.2% (21,158)
Number of households with income $20k - 30k:
Fall River:
15.1% (547)
State:
7.8% (18,016)
Number of households with income $30k - 40k:
Fall River:
11.9% (432)
State:
7.9% (18,260)
Number of households with income $40k - 50k:
Fall River:
7.5% (271)
Massachusetts:
5.6% (13,027)
Number of households with income $50k - 60k:
Fall River:
4.5% (164)
Massachusetts:
5.6% (12,909)
Number of households with income $60k - 75k:
Fall River:
12.5% (454)
State:
9.0% (20,800)
Number of households with income $75k - 100k:
Fall River:
10.8% (391)
State:
12.1% (27,875)
Number of households with income $100k - 125k:
Fall River:
2.1% (75)
State:
8.1% (18,754)
Number of households with income $125k - 150k:
Fall River:
6.7% (245)
State:
6.8% (15,621)
Number of households with income $150k - 200k:
Fall River:
6.4% (231)
Massachusetts:
9.4% (21,618)
Number of households with income > $200k:
Fall River:
4.2% (154)
State:
12.0% (27,592)
Aggregate household income in Fall River in 2022: $164,391,100
Median family income in Fall River in 2022:
Fall River:
$38,490
State:
$78,380
Number of families with income < $10k:
Fall River:
12.4% (306)
Massachusetts:
4.5% (7,017)
Number of families with income $10k - 20k:
Fall River:
8.6% (213)
State:
4.9% (7,678)
Number of families with income $20k - 30k:
Fall River:
15.0% (370)
State:
8.5% (13,245)
Number of families with income $30k - 40k:
Fall River:
11.1% (275)
Massachusetts:
8.2% (12,705)
Number of families with income $40k - 50k:
Fall River:
4.7% (116)
State:
5.3% (8,255)
Number of families with income $50k - 60k:
Fall River:
5.6% (138)
State:
6.7% (10,445)
Number of families with income $60k - 75k:
Fall River:
6.9% (170)
State:
10.3% (16,064)
Number of families with income $75k - 100k:
Fall River:
11.7% (290)
State:
12.1% (18,758)
Number of families with income $100k - 125k:
Fall River:
3.4% (84)
State:
7.9% (12,321)
Number of families with income $125k - 150k:
Fall River:
8.1% (200)
Massachusetts:
7.2% (11,128)
Number of families with income $150k - 200k:
Fall River:
6.0% (148)
State:
10.3% (15,978)
Number of families with income > $200k:
Fall River:
6.4% (159)
State:
14.0% (21,838)
Median non-family income in Fall River in 2022:
Fall River:
$41,163
State:
$42,253
Median per capita income in Fall River in 2022:
Fall River:
$17,484
State:
$34,029
Change in median per capita income between 2000 and 2022:
Fall River, Massachusetts:
+17.5%
Massachusetts:
+132.1%
Income statistics for other residents
Median household income in Fall River, MA in 2022:
Fall River:
$33,345
State:
$61,039
Number of households with income < $10k:
Fall River:
7.2% (163)
State:
8.4% (11,559)
Number of households with income $10k - 20k:
Fall River:
13.3% (302)
Massachusetts:
8.4% (11,499)
Number of households with income $20k - 30k:
Fall River:
11.3% (255)
State:
9.5% (13,070)
Number of households with income $30k - 40k:
Fall River:
15.1% (341)
Massachusetts:
6.0% (8,291)
Number of households with income $40k - 50k:
Fall River:
5.3% (120)
State:
9.2% (12,611)
Number of households with income $50k - 60k:
Fall River:
8.7% (197)
State:
7.9% (10,879)
Number of households with income $60k - 75k:
Fall River:
6.8% (153)
Massachusetts:
7.5% (10,239)
Number of households with income $75k - 100k:
Fall River:
10.5% (237)
Massachusetts:
13.1% (18,032)
Number of households with income $100k - 125k:
Fall River:
8.7% (198)
State:
9.6% (13,141)
Number of households with income $125k - 150k:
Fall River:
4.6% (104)
State:
5.0% (6,808)
Number of households with income $150k - 200k:
Fall River:
7.0% (158)
State:
6.4% (8,843)
Number of households with income > $200k:
Fall River:
1.6% (37)
Massachusetts:
9.0% (12,396)
Aggregate household income in Fall River in 2022: $151,892,800
Median family income in Fall River in 2022:
Fall River:
$33,942
State:
$66,840
Number of families with income < $10k:
Fall River:
13.5% (246)
State:
6.7% (6,769)
Number of families with income $10k - 20k:
Fall River:
8.9% (163)
State:
4.7% (4,798)
Number of families with income $20k - 30k:
Fall River:
14.6% (268)
Massachusetts:
10.4% (10,595)
Number of families with income $30k - 40k:
Fall River:
11.7% (214)
State:
7.0% (7,154)
Number of families with income $40k - 50k:
Fall River:
7.1% (129)
State:
8.9% (9,052)
Number of families with income $50k - 60k:
Fall River:
3.8% (70)
Massachusetts:
8.7% (8,850)
Number of families with income $60k - 75k:
Fall River:
8.1% (148)
State:
8.5% (8,683)
Number of families with income $75k - 100k:
Fall River:
10.0% (184)
State:
12.8% (12,997)
Number of families with income $100k - 125k:
Fall River:
8.3% (151)
State:
9.3% (9,480)
Number of families with income $125k - 150k:
Fall River:
11.5% (209)
State:
5.3% (5,373)
Number of families with income $150k - 200k:
Fall River:
1.4% (25)
Massachusetts:
7.5% (7,659)
Number of families with income > $200k:
Fall River:
1.2% (21)
State:
10.0% (10,188)
Median non-family income in Fall River in 2022:
Fall River:
$19,090
Massachusetts:
$36,127
Change in median non-family income between 2000 and 2022:
Fall River, Massachusetts:
+6.5%
State:
+123.4%
Median per capita income in Fall River in 2022:
Fall River:
$19,678
State:
$30,797
Discuss Fall River, Massachusetts (MA) on our hugely popular Massachusetts forum.