East Hartford, CT (Connecticut) Houses and Residents
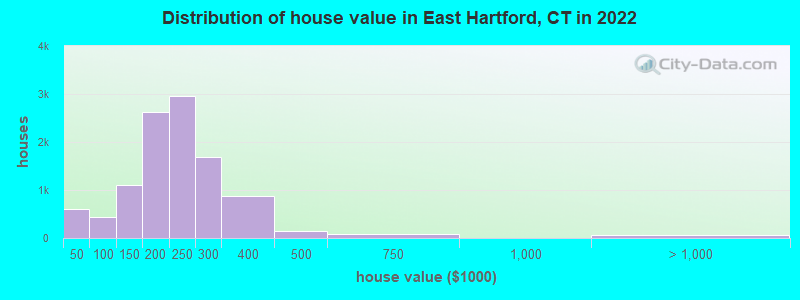
Estimated median house or condo value in 2022: $216,129 (it was $110,700 in 2000 )
East Hartford:
$216,129Connecticut:
$347,200
Lower value quartile - upper value quartile: $171,437 - $262,127Mean price in 2022: Detached houses: $232,416 Here:
$232,416State:
$503,946
Townhouses or other attached units: $184,880 Here:
$184,880State:
$304,959
In 2-unit structures: $187,098 Here:
$187,098State:
$304,133
In 3-to-4-unit structures: $144,272 Here:
$144,272State:
$272,970
In 5-or-more-unit structures: $150,026 Here:
$150,026State:
$249,308
Mobile homes: $127,161 Here:
$127,161State:
$151,361
Total population: 51,252 (Urban population: 49,575, Rural population: 0)
Houses: 21,600 (20,203 occupied: 12,149 owner occupied, 8,275 renter occupied )
% of renters here:
41%State:
34%
Housing density: 1,198 houses/condos per square mile
Median price asked for vacant for-sale houses and condos in 2022: $237,749.
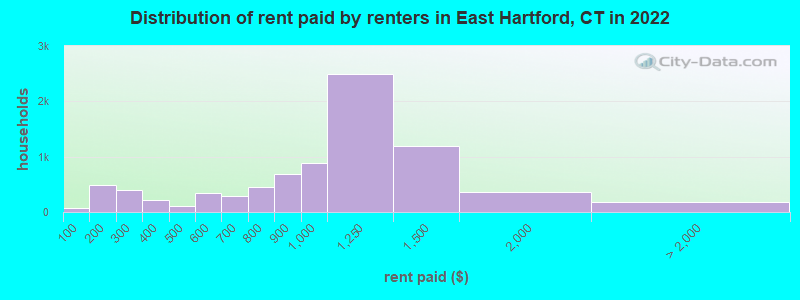
Median contract rent in 2022: $1,010 (lower quartile is $715, upper quartile is $1,226)
Median rent asked for vacant for-rent units in 2022: $790
Median gross rent in East Hartford, CT in 2022: $1,151
Housing units in East Hartford with a mortgage: 8,285 (665 second mortgage, 15 home equity loan, 332 both second mortgage and home equity loan )Houses without a mortgage: 312
Median household income for houses/condos with a mortgage: $90,056
Median household income for apartments without a mortgage: $75,720
Median monthly housing costs: $1,289
Data:
Median house or condo value ($)
Median house or condo value ($ change since 2000)
Median house or condo value ($) - White
Median house or condo value ($) - Black or African American
Median house or condo value ($) - Asian
Median house or condo value ($) - Hispanic or Latino
Median house or condo value ($) - American Indian and Alaska Native
Median house or condo value ($) - Multirace
Median house or condo value ($) - Other Race
Median price asked for mobile homes ($)
Household density (households per square mile)
Mean house or condo value by units in structure - 1, detached ($)
Mean house or condo value by units in structure - 1, attached ($)
Mean house or condo value by units in structure - 2 ($)
Mean house or condo value by units in structure by units in structure - 3 or 4 ($)
Mean house or condo value by units in structure - 5 or more ($)
Mean house or condo value by units in structure - Boat, RV, van, etc. ($)
Mean house or condo value by units in structure - Mobile home ($)
Median contract rent ($)
Median contract rent - Lower quartile ($)
Median contract rent - Upper quartile ($)
Median gross rent ($)
Urban houses (%)
Rural houses (%)
Houses occupied (%)
Houses occupied (% change since 2000)
Houses owner occupied (%)
Houses owner occupied (% change since 2000)
Houses renter occupied (%)
Houses renter occupied (% change since 2000)
Vacant housing units - For rent (%)
Vacant housing units - For rent (% change since 2000)
Vacant housing units - For sale only (%)
Vacant housing units - For sale only (% change since 2000)
Vacant housing units - Rented or sold, not occupied (%)
Vacant housing units - Rented or sold, not occupied (% change since 2000)
Vacant housing units - For seasonal, recreational, or occasional use (%)
Vacant housing units - For seasonal, recreational, or occasional use (% change since 2000)
Vacant housing units - For migrant workers (%)
Vacant housing units - For migrant workers (% change since 2000)
Vacant housing units - Other vacant (%)
Vacant housing units - Other vacant (% change since 2000)
Median monthly housing costs ($)
Median household income for houses/condos with a mortgage ($)
Median household income for houses/condos without a mortgage ($)
Median household income ($)
Median household income ($) - White
Median household income ($) - Black or African American
Median household income ($) - Asian
Median household income ($) - Hispanic or Latino
Median household income ($) - American Indian and Alaska Native
Median household income ($) - Multirace
Median household income ($) - Other Race
Mortgage status - with mortgage (%)
Mortgage status - with second mortgage (%)
Mortgage status - with home equity loan (%)
Mortgage status - with both second mortgage and home equity loan (%)
Mortgage status - without a mortgage (%)
Median year house/condo built
Median year apartment built
Household type by relationship - Male householder living alone (%)
Household type by relationship - Male householder not living alone (%)
Household type by relationship - Female householder living alone (%)
Household type by relationship - Female householder not living alone (%)
Household type by relationship - Opposite-Sex spouse (%)
Household type by relationship - Same-Sex spouse (%)
Household type by relationship - Opposite-Sex unmarried partner (%)
Household type by relationship - Same-Sex unmarried partner (%)
Household type by relationship - In group quarters (%)
Size of family households - 2-person household (%)
Size of family households - 3-person household (%)
Size of family households - 4-person household (%)
Size of family households - 5-person household (%)
Size of family households - 6-person household (%)
Size of family households - 7-or-more-person household (%)
Size of nonfamily households - 1-person household (%)
Size of nonfamily households - 2-person household (%)
Size of nonfamily households - 3-person household (%)
Size of nonfamily households - 4-person household (%)
Size of nonfamily households - 5-person household (%)
Size of nonfamily households - 6-person household (%)
Size of nonfamily households - 7-or-moreperson household (%)
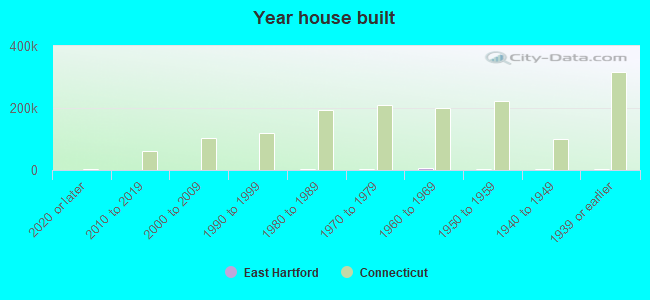
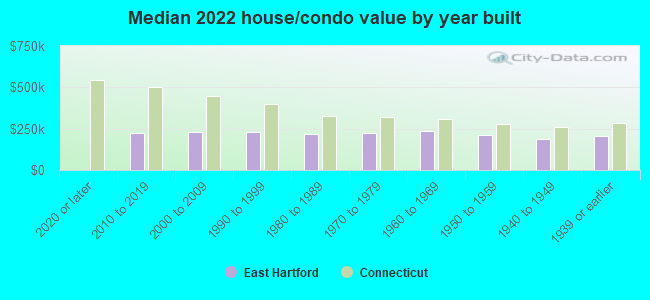
Year house built - Built 2010 or later (%)
Year house built - Built 2000 to 2009 (%)
Year house built - Built 1990 to 1999 (%)
Year house built - Built 1980 to 1989 (%)
Year house built - Built 1970 to 1979 (%)
Year house built - Built 1960 to 1969 (%)
Year house built - Built 1950 to 1959 (%)
Year house built - Built 1940 to 1949 (%)
Year house built - Built 1939 or earlier (%)
Median number of rooms in houses and condos
Median number of rooms in apartments
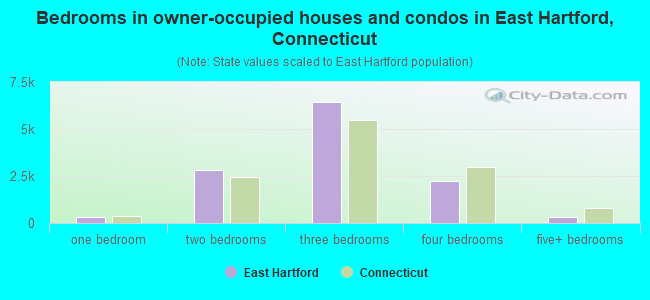
Median number of bedrooms in owner occupied houses
Mean number of bedrooms in owner occupied houses
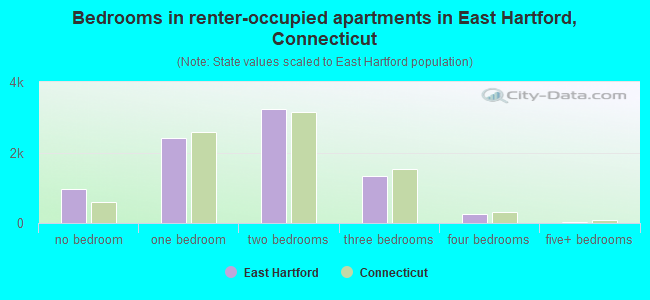
Median number of bedrooms in renter occupied houses
Mean number of bedrooms in renter occupied houses
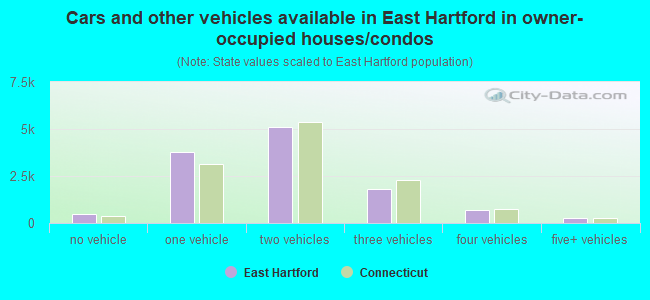
Median number of vehichles in owner occupied houses
Mean number of vehichles in owner occupied houses
Median number of vehichles in renter occupied houses
Mean number of vehichles in renter occupied houses
Rooms in owner-occupied houses - 1 room (%)
Rooms in owner-occupied houses - 2 rooms (%)
Rooms in owner-occupied houses - 3 rooms (%)
Rooms in owner-occupied houses - 4 rooms (%)
Rooms in owner-occupied houses - 5 rooms (%)
Rooms in owner-occupied houses - 6 rooms (%)
Rooms in owner-occupied houses - 7 rooms (%)
Rooms in owner-occupied houses - 8 rooms (%)
Rooms in owner-occupied houses - 9+ rooms (%)
Rooms in renter-occupied houses - 1 room (%)
Rooms in renter-occupied houses - 2 rooms (%)
Rooms in renter-occupied houses - 3 rooms (%)
Rooms in renter-occupied houses - 4 rooms (%)
Rooms in renter-occupied houses - 5 rooms (%)
Rooms in renter-occupied houses - 6 rooms (%)
Rooms in renter-occupied houses - 7 rooms (%)
Rooms in renter-occupied houses - 8 rooms (%)
Rooms in renter-occupied houses - 9+ rooms (%)
Bedrooms in owner-occupied houses - no bedrooms (%)
Bedrooms in owner-occupied houses - 1 bedroom (%)
Bedrooms in owner-occupied houses - 2 bedrooms (%)
Bedrooms in owner-occupied houses - 3 bedrooms (%)
Bedrooms in owner-occupied houses - 4 bedrooms (%)
Bedrooms in owner-occupied houses - 5+ bedrooms (%)
Bedrooms in renter-occupied houses - no bedrooms (%)
Bedrooms in renter-occupied houses - 1 bedroom (%)
Bedrooms in renter-occupied houses - 2 bedrooms (%)
Bedrooms in renter-occupied houses - 3 bedrooms (%)
Bedrooms in renter-occupied houses - 4 bedrooms (%)
Bedrooms in renter-occupied houses - 5+ bedrooms (%)
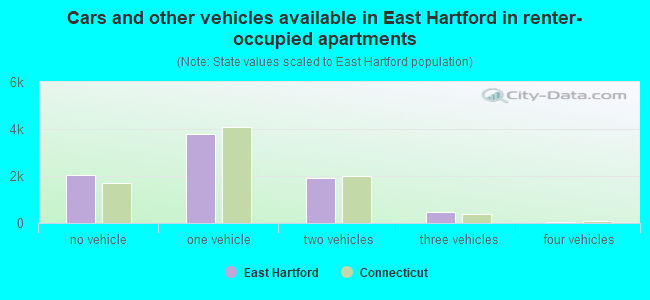
Vehicles available in owner-occupied houses - no vehicle available (%)
Vehicles available in owner-occupied houses - 1 vehicle available(%)
Vehicles available in owner-occupied houses - 2 Vehicles available (%)
Vehicles available in owner-occupied houses - 3 Vehicles available (%)
Vehicles available in owner-occupied houses - 4 Vehicles available (%)
Vehicles available in owner-occupied houses - 5+ Vehicles available (%)
Vehicles available in renter-occupied houses - no vehicle available (%)
Vehicles available in renter-occupied houses - 1 vehicle available (%)
Vehicles available in renter-occupied houses - 2 Vehicles available (%)
Vehicles available in renter-occupied houses - 3 Vehicles available (%)
Vehicles available in renter-occupied houses - 4 Vehicles available (%)
Vehicles available in renter-occupied houses - 5+ Vehicles available (%)
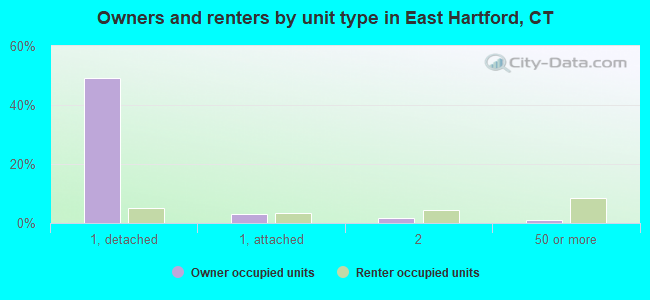
Housing units in structures - 1, detached (%)
Housing units in structures - 1, attached (%)
Housing units in structures - 2 (%)
Housing units in structures - 3 or 4 (%)
Housing units in structures - 5 to 9 (%)
Housing units in structures - 10 to 19 (%)
Housing units in structures - 20 to 49 (%)
Housing units in structures - 50 or more (%)
Housing units in structures - Mobile home (%)
Housing units in structures - Boat, RV, van, etc. (%)
Housing units in structures - Owners - 1, detached (%)
Housing units in structures - Owners - 1, attached (%)
Housing units in structures - Owners - 2 (%)
Housing units in structures - Owners - 3 or 4 (%)
Housing units in structures - Owners - 5 to 9 (%)
Housing units in structures - Owners - 10 to 19 (%)
Housing units in structures - Owners - 20 to 49 (%)
Housing units in structures - Owners - 50 or more (%)
Housing units in structures - Owners - Mobile home (%)
Housing units in structures - Owners - Boat, RV, van, etc. (%)
Housing units in structures - Renters - 1, detached (%)
Housing units in structures - Renters - 1, attached (%)
Housing units in structures - Renters - 2 (%)
Housing units in structures - Renters - 3 or 4 (%)
Housing units in structures - Renters - 5 to 9 (%)
Housing units in structures - Renters - 10 to 19 (%)
Housing units in structures - Renters - 20 to 49 (%)
Housing units in structures - Renters - 50 or more (%)
Housing units in structures - Renters - Mobile home (%)
Housing units in structures - Renters - Boat, RV, van, etc. (%)
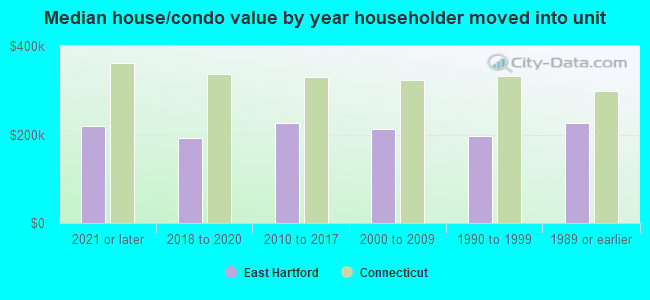
House/condo owner moved in on average (years ago)
Renter moved in on average (years ago)
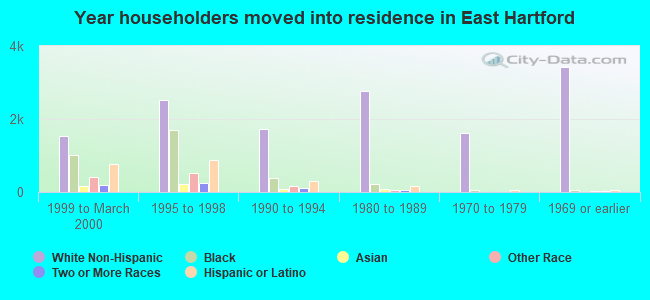
Year householder moved into unit - Moved in 1999 to March 2000 (%)
Year householder moved into unit - Moved in 1999 to March 2000 (%) - White
Year householder moved into unit - Moved in 1999 to March 2000 (%) - Black or African American
Year householder moved into unit - Moved in 1999 to March 2000 (%) - Asian
Year householder moved into unit - Moved in 1999 to March 2000 (%) - Hispanic or Latino
Year householder moved into unit - Moved in 1999 to March 2000 (%) - American Indian and Alaska Native
Year householder moved into unit - Moved in 1999 to March 2000 (%) - Multirace
Year householder moved into unit - Moved in 1999 to March 2000 (%) - Other Race
Year householder moved into unit - Moved in 1995 to 1998 (%)
Year householder moved into unit - Moved in 1995 to 1998 (%) - White
Year householder moved into unit - Moved in 1995 to 1998 (%) - Black or African American
Year householder moved into unit - Moved in 1995 to 1998 (%) - Asian
Year householder moved into unit - Moved in 1995 to 1998 (%) - Hispanic or Latino
Year householder moved into unit - Moved in 1995 to 1998 (%) - American Indian and Alaska Native
Year householder moved into unit - Moved in 1995 to 1998 (%) - Multirace
Year householder moved into unit - Moved in 1995 to 1998 (%) - Other Race
Year householder moved into unit - Moved in 1990 to 1994 (%)
Year householder moved into unit - Moved in 1990 to 1994 (%) - White
Year householder moved into unit - Moved in 1990 to 1994 (%) - Black or African American
Year householder moved into unit - Moved in 1990 to 1994 (%) - Asian
Year householder moved into unit - Moved in 1990 to 1994 (%) - Hispanic or Latino
Year householder moved into unit - Moved in 1990 to 1994 (%) - American Indian and Alaska Native
Year householder moved into unit - Moved in 1990 to 1994 (%) - Multirace
Year householder moved into unit - Moved in 1990 to 1994 (%) - Other Race
Year householder moved into unit - Moved in 1980 to 1989 (%)
Year householder moved into unit - Moved in 1980 to 1989 (%) - White
Year householder moved into unit - Moved in 1980 to 1989 (%) - Black or African American
Year householder moved into unit - Moved in 1980 to 1989 (%) - Asian
Year householder moved into unit - Moved in 1980 to 1989 (%) - Hispanic or Latino
Year householder moved into unit - Moved in 1980 to 1989 (%) - American Indian and Alaska Native
Year householder moved into unit - Moved in 1980 to 1989 (%) - Multirace
Year householder moved into unit - Moved in 1980 to 1989 (%) - Other Race
Year householder moved into unit - Moved in 1970 to 1979 (%)
Year householder moved into unit - Moved in 1970 to 1979 (%) - White
Year householder moved into unit - Moved in 1970 to 1979 (%) - Black or African American
Year householder moved into unit - Moved in 1970 to 1979 (%) - Asian
Year householder moved into unit - Moved in 1970 to 1979 (%) - Hispanic or Latino
Year householder moved into unit - Moved in 1970 to 1979 (%) - American Indian and Alaska Native
Year householder moved into unit - Moved in 1970 to 1979 (%) - Multirace
Year householder moved into unit - Moved in 1970 to 1979 (%) - Other Race
Year householder moved into unit - Moved in 1969 or earlier (%)
Year householder moved into unit - Moved in 1969 or earlier (%) - White
Year householder moved into unit - Moved in 1969 or earlier (%) - Black or African American
Year householder moved into unit - Moved in 1969 or earlier (%) - Asian
Year householder moved into unit - Moved in 1969 or earlier (%) - Hispanic or Latino
Year householder moved into unit - Moved in 1969 or earlier (%) - American Indian and Alaska Native
Year householder moved into unit - Moved in 1969 or earlier (%) - Multirace
Year householder moved into unit - Moved in 1969 or earlier (%) - Other Race
Housing units lacking complete plumbing facilities (%)
Housing units lacking complete kitchen facilities (%)
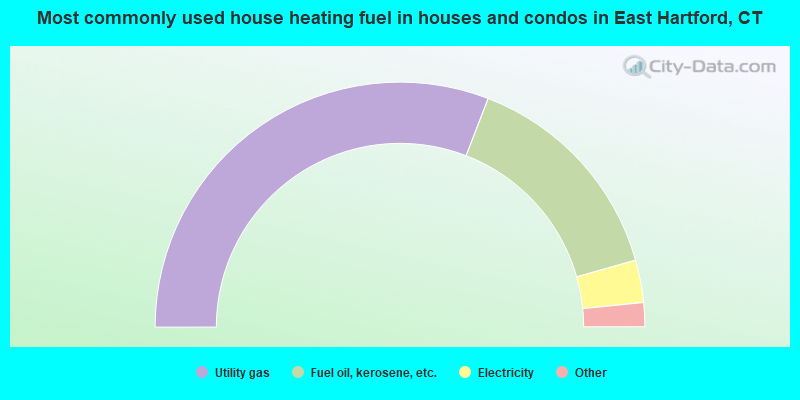
House heating fuel used in houses and condos - Utility gas (%)
House heating fuel used in houses and condos - Bottled, tank, or LP gas (%)
House heating fuel used in houses and condos - Electricity (%)
House heating fuel used in houses and condos - Fuel oil, kerosene, etc. (%)
House heating fuel used in houses and condos - Coal or coke (%)
House heating fuel used in houses and condos - Wood (%)
House heating fuel used in houses and condos - Solar energy (%)
House heating fuel used in houses and condos - Other fuel (%)
House heating fuel used in houses and condos - No fuel used (%)
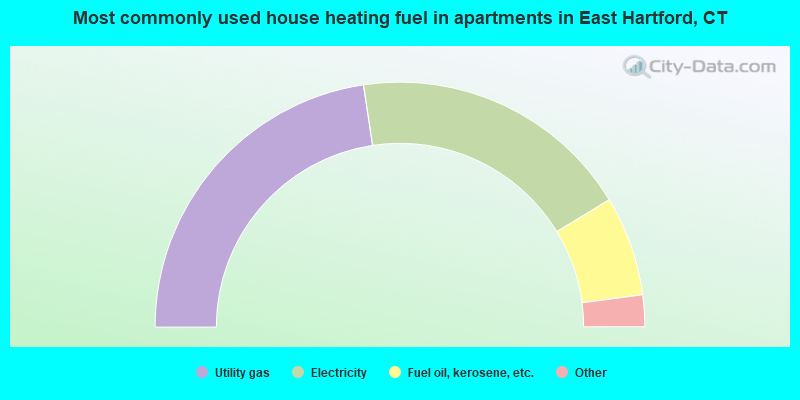
House heating fuel used in apartments - Utility gas (%)
House heating fuel used in apartments - Bottled, tank, or LP gas (%)
House heating fuel used in apartments - Electricity (%)
House heating fuel used in apartments - Fuel oil, kerosene, etc. (%)
House heating fuel used in apartments - Coal or coke (%)
House heating fuel used in apartments - Wood (%)
House heating fuel used in apartments - Solar energy (%)
House heating fuel used in apartments - Other fuel (%)
House heating fuel used in apartments - No fuel used (%)
Median year house/condo built: 1960Median year apartment built: 1966Household type by relationship:
Households: 51,152
Male householders: 8,900 (2,645 living alone ), Female householders: 11,268 (3,378 living alone )7,271 spouses (7,141 opposite-sex spouses ), 1,423 unmarried partners , (1,334 opposite-sex unmarried partners ), 15,764 children (14,838 natural , 223 adopted , 701 stepchildren ), 1,164 grandchildren , 918 brothers or sisters , 1,126 parents , 134 foster children , 1,249 other relatives , 1,330 non-relatives In group quarters: 598
Size of family households: 4,909 2-persons , 3,586 3-persons , 2,407 4-persons , 1,209 5-persons , 425 6-persons , 286 7-or-more-persons .
Size of nonfamily households: 6,360 1-person , 1,213 2-persons , 33 3-persons , 6 4-persons .
4,989 married couples with children. single-parent households (887 men , 3,515 women ).
60.3% of residents of East Hartford speak English at home. of residents speak Spanish at home (73% speak English very well , 12% speak English well , 9% speak English not well , 6% don't speak English at all ).of residents speak other Indo-European language at home (64% speak English very well , 23% speak English well , 8% speak English not well , 4% don't speak English at all ).of residents speak Asian or Pacific Island language at home (43% speak English very well , 22% speak English well , 23% speak English not well , 12% don't speak English at all ).of residents speak other language at home (82% speak English very well , 14% speak English well , 4% speak English not well ).
Foreign born population: 10,380 (20.3%)of them are naturalized citizens )
Median number of rooms in houses and condos:
Median number of rooms in apartments
Owner-occupied Renter-occupied
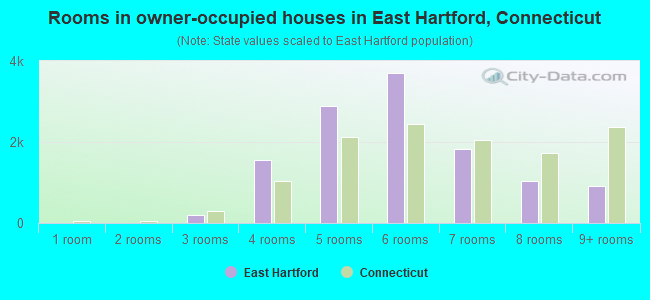
Rooms in owner-occupied houses in East Hartford, Connecticut
2 1 room 0 2 rooms 199 3 rooms 1,567 4 rooms 2,895 5 rooms 3,696 6 rooms 1,826 7 rooms 1,049 8 rooms 914 9+ rooms
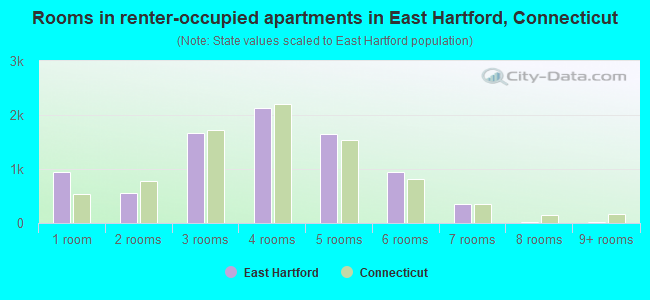
Rooms in renter-occupied apartments in East Hartford, Connecticut
949 1 room 558 2 rooms 1,670 3 rooms 2,125 4 rooms 1,643 5 rooms 939 6 rooms 346 7 rooms 19 8 rooms 26 9+ rooms
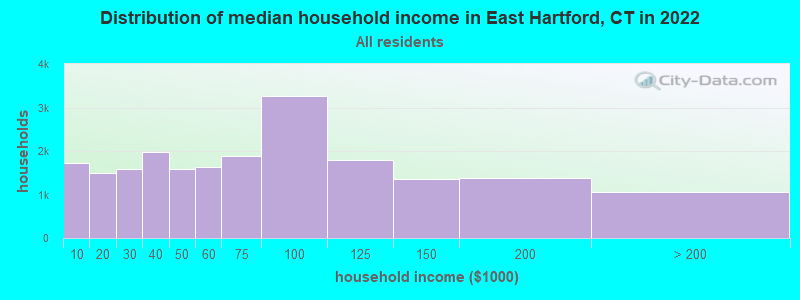
East Hartford, CT household income distribution 1,716 Less than $10,0001,484 $10,000 to $19,9991,597 $20,000 to $29,9991,972 $30,000 to $39,9991,592 $40,000 to $49,9991,642 $50,000 to $59,9991,894 $60,000 to $74,9993,263 $75,000 to $99,9991,788 $100,000 to $124,9991,352 $125,000 to $149,9991,368 $150,000 to $199,9991,053 $200,000 or more
Home value of owner - occupied houses in 2022 in East Hartford, CT 162 Less than $10,00057 $10,000 to $14,99992 $15,000 to $19,99945 $20,000 to $24,99951 $25,000 to $29,99955 $30,000 to $34,99984 $35,000 to $39,99960 $40,000 to $49,99955 $50,000 to $59,999146 $60,000 to $69,99946 $70,000 to $79,99980 $80,000 to $89,99941 $90,000 to $99,999484 $100,000 to $124,999627 $125,000 to $149,9991,352 $150,000 to $174,9991,266 $175,000 to $199,9992,962 $200,000 to $249,9991,692 $250,000 to $299,999885 $300,000 to $399,999149 $400,000 to $499,99984 $500,000 to $749,9997 $750,000 to $999,9997 $1,000,000 to $1,499,9995 $1,500,000 to $1,999,99944 $2,000,000 or moreRent paid by renters in 2022 in East Hartford, CT 72 Less than $100171 $100 to $149308 $150 to $199304 $200 to $24990 $250 to $299154 $300 to $34953 $350 to $39964 $400 to $44952 $450 to $499113 $500 to $549221 $550 to $599106 $600 to $649185 $650 to $699304 $700 to $749151 $750 to $799679 $800 to $899878 $900 to $9992,501 $1,000 to $1,2491,198 $1,250 to $1,499362 $1,500 to $1,99938 $2,000 to $2,4992 $3,500 or more133 No cash rent
Percentage of workers working in this county: 94.2%Number of people working at home: 2,733 (10.6% of all workers )
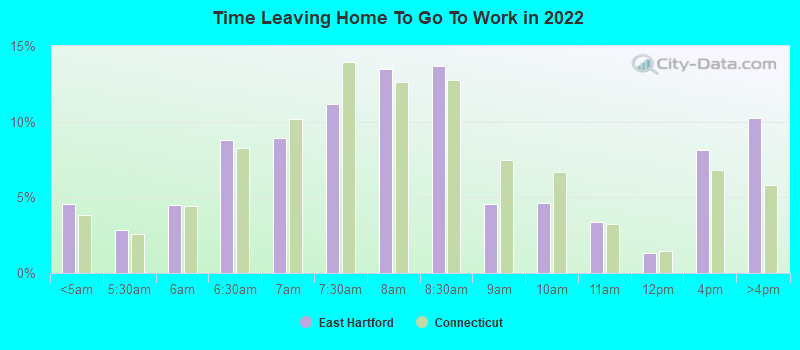
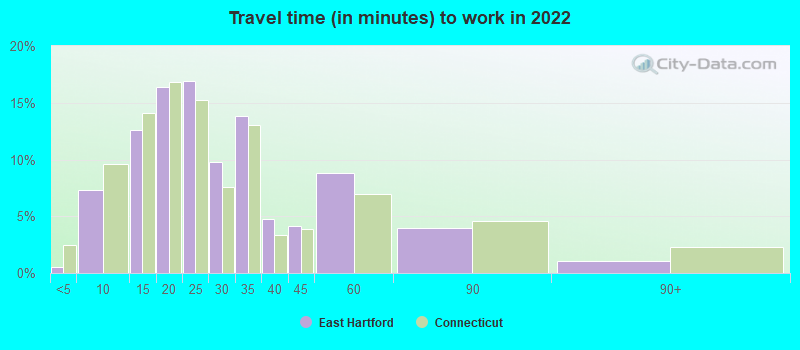
Travel time to work (commute)
Less than 5 minutes: 1325 to 9 minutes: 1,33010 to 14 minutes: 4,01415 to 19 minutes: 5,46620 to 24 minutes: 4,58425 to 29 minutes: 1,69230 to 34 minutes: 3,10235 to 39 minutes: 19340 to 44 minutes: 38245 to 59 minutes: 76060 to 89 minutes: 57490 or more minutes: 299
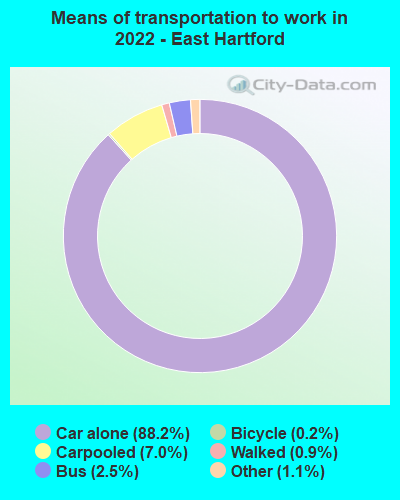
Means of transportation to work:
Drove a car alone: 21,542 (77.4%)Carpooled: 1,807 (6.5%)Bus : 607 (2.2%)Long-distance train or commuter rail : 11 (0.0%)Taxi: 335 (1.2%)Bicycle: 38 (0.1%)Walked: 237 (0.9%)Worked at home: 2,733 (9.8%)
Unemployment by race in 2022
Unemployment rate for White non-Hispanic residents 2.7% Males6.3% FemalesUnemployment rate for Black residents 8.7% Males1.9% FemalesUnemployment rate for Asian residents 5.9% Males4.7% FemalesUnemployment rate for other race residents 1.0% Males9.1% FemalesUnemployment rate for two or more race residents 5.1% Males7.1% FemalesUnemployment rate for Hispanic or Latino residents 6.2% Males7.6% Females
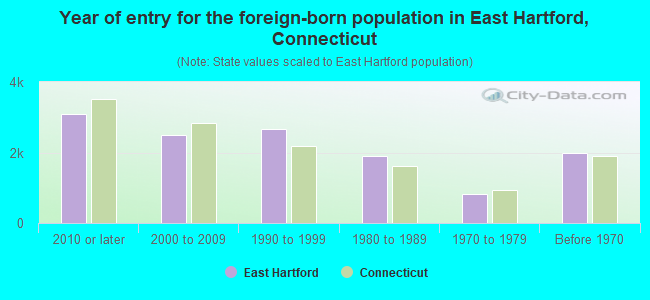
Year of entry for the foreign-born population in East Hartford, Connecticut
3,099 2010 or later 2,500 2000 to 2009 2,658 1990 to 1999 1,909 1980 to 1989 821 1970 to 1979 1,989 Before 1970
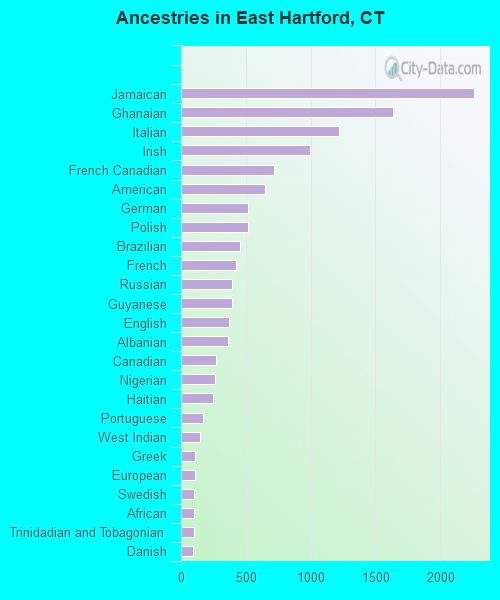
First ancestries reported:
Jamaican: 2,263 (7.2%)
Ghanaian: 1,636 (5.2%)
Italian: 1,221 (3.9%)
Irish: 994 (3.1%)
French Canadian: 717 (2.3%)
American: 651 (2.1%)
German: 516 (1.6%)
Polish: 515 (1.6%)
Brazilian: 456 (1.4%)
French: 425 (1.3%)
Russian: 395 (1.3%)
Guyanese: 394 (1.2%)
English: 371 (1.2%)
Albanian: 360 (1.1%)
Canadian: 268 (0.8%)
Nigerian: 263 (0.8%)
Haitian: 248 (0.8%)
Portuguese: 173 (0.5%)
West Indian: 148 (0.5%)
Greek: 105 (0.3%)
European: 105 (0.3%)
Swedish: 101 (0.3%)
African: 101 (0.3%)
Trinidadian and Tobagonian: 98 (0.3%)
Danish: 91 (0.3%)
British West Indian: 71 (0.2%)
Ukrainian: 61 (0.2%)
Scottish: 53 (0.2%)
Dutch: 52 (0.2%)
Lithuanian: 40 (0.1%)
Ethiopian: 40 (0.1%)
British: 25 (0.08%)
Armenian: 18 (0.06%)
Serbian: 17 (0.05%)
Norwegian: 15 (0.05%)
Barbadian: 13 (0.04%)
Syrian: 11 (0.03%)
Eastern European: 11 (0.03%)
Iraqi: 8 (0.03%)
Czech: 7 (0.02%)
Belizean: 6 (0.02%)
Latvian: 5 (0.02%)
Welsh: 3 (0.01%) Most common places of birth for foreign-born residents (%): Jamaica East Hartford:
18.4% (1,905)Connecticut:
7.5% (40,568)
Peru East Hartford:
12.3% (1,277)Connecticut:
2.5% (13,591)
Ghana East Hartford:
11.3% (1,174)Connecticut:
1.0% (5,651)
El Salvador East Hartford:
5.9% (617)Connecticut:
1.1% (6,024)
Dominican Republic East Hartford:
4.8% (503)Connecticut:
5.0% (27,361)
Vietnam East Hartford:
4.1% (425)Connecticut:
1.2% (6,448)
Russia East Hartford:
3.7% (381)Connecticut:
1.2% (6,448)
Brazil East Hartford:
3.4% (353)Connecticut:
4.7% (25,461)
Albania East Hartford:
3.0% (311)Connecticut:
1.0% (5,447)
India East Hartford:
2.8% (287)Connecticut:
7.3% (39,879)
Canada East Hartford:
2.6% (275)Connecticut:
2.3% (12,380)
Honduras East Hartford:
2.2% (232)Connecticut:
1.3% (7,220)
St. Lucia East Hartford:
2.2% (228)Connecticut:
0.2% (1,050)
Mexico East Hartford:
2.0% (203)Connecticut:
4.8% (25,802)
Colombia East Hartford:
1.8% (192)Connecticut:
3.3% (18,124)
Portugal East Hartford:
1.8% (189)Connecticut:
1.7% (9,214)
Place of birth for U.S.-born residents:
This state: 27,655Other state: 7,970Northeast: 4,870Midwest: 705South: 1,847West: 473 89.6% of East Hartford residents lived in the same house 1 years ago.
Out of people who lived in different houses, 38.7% lived in this county.
Out of people who lived in different counties, 19.1% lived in Connecticut.
East Hartford:
89.6%State average:
88.4%
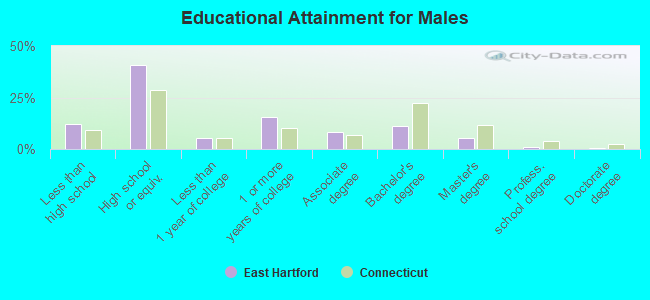
Education attainment for males 25 years and older:
No schooling: 572Nursery to 4th grade: 445th and 6th grade: 467th and 8th grade: 3409th grade: 20910th grade: 12011th grade: 36912th grade, no diploma: 339High school graduate (or equivalency): 6,958Less than 1 year of college: 927Some college more than 1 year, no degree: 2,616Associate degree: 1,435Bachelor's degree: 1,863Master's degree: 948Professional school degree: 132Doctorate degree: 69
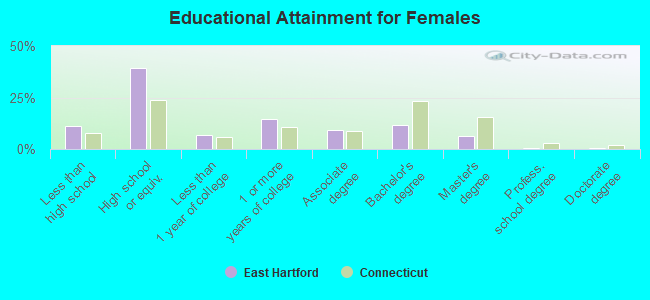
Education attainment for females 25 years and older:
No schooling: 453Nursery to 4th grade: 1595th and 6th grade: 1917th and 8th grade: 2189th grade: 19210th grade: 9511th grade: 31412th grade, no diploma: 361High school graduate (or equivalency): 6,970Less than 1 year of college: 1,168Some college more than 1 year, no degree: 2,627Associate degree: 1,659Bachelor's degree: 2,118Master's degree: 1,141Professional school degree: 97Doctorate degree: 45
Housing units in structures:
One, detached: 11,478One, attached: 1,348Two: 1,6413 or 4: 1,6885 to 9: 96110 to 19: 79220 to 49: 1,22450 or more: 1,819Mobile homes: 644Median worth of mobile homes: $55,456
Housing units lacking complete plumbing facilities in 2022: 1.0%Housing units lacking complete kitchen facilities in 2022: 1.0%House/condo owner moved in on average 11 years ago
Renter moved in on average 5 years ago
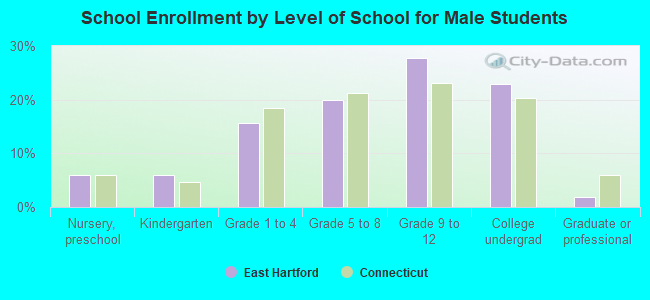
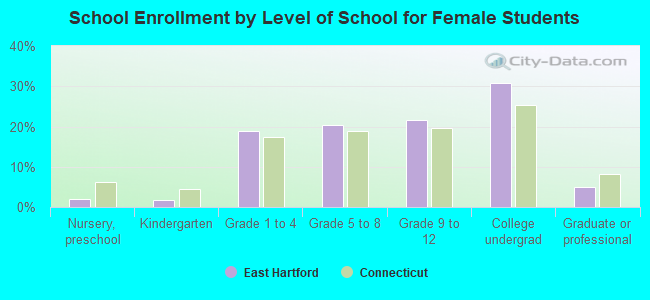
Private vs. public school enrollment:
Students in private schools in grades 1 to 8 (elementary and middle school): 653 Here:
13.7%Connecticut:
9.5%
Students in private schools in grades 9 to 12 (high school): 15 Here:
0.5%Connecticut:
12.9%
Students in private undergraduate colleges: 497 Here:
15.0%Connecticut:
35.5%