Races in East Hartford, Connecticut (CT) Detailed Stats
Data:
Races - White alone (%)
Races - White alone (% change since 2000)
Races - Black alone (%)
Races - Black alone (% change since 2000)
Races - American Indian alone (%)
Races - American Indian alone (% change since 2000)
Races - Asian alone (%)
Races - Asian alone (% change since 2000)
Races - Hispanic (%)
Races - Hispanic (% change since 2000)
Races - Native Hawaiian and Other Pacific Islander alone (%)
Races - Native Hawaiian and Other Pacific Islander alone (% change since 2000)
Races - Two or more races(%)
Races - Two or more races(% change since 2000)
Races - Other race alone (%)
Races - Other race alone (% change since 2000)
Racial diversity
Place of birth - Born in state of residence (%)
Place of birth - Born in state of residence (%) - White
Place of birth - Born in state of residence (%) - Black or African American
Place of birth - Born in state of residence (%) - Asian
Place of birth - Born in state of residence (%) - Hispanic or Latino
Place of birth - Born in state of residence (%) - American Indian and Alaska Native
Place of birth - Born in state of residence (%) - Multirace
Place of birth - Born in state of residence (%) - Other Race
Place of birth - Born in other state (%)
Place of birth - Born in other state (%) - White
Place of birth - Born in other state (%) - Black or African American
Place of birth - Born in other state (%) - Asian
Place of birth - Born in other state (%) - Hispanic or Latino
Place of birth - Born in other state (%) - American Indian and Alaska Native
Place of birth - Born in other state (%) - Multirace
Place of birth - Born in other state (%) - Other Race
Place of birth - Native, outside of US (%)
Place of birth - Native, outside of US (%) - White
Place of birth - Native, outside of US (%) - Black or African American
Place of birth - Native, outside of US (%) - Asian
Place of birth - Native, outside of US (%) - Hispanic or Latino
Place of birth - Native, outside of US (%) - American Indian and Alaska Native
Place of birth - Native, outside of US (%) - Multirace
Place of birth - Native, outside of US (%) - Other Race
Place of birth - Foreign born (%)
Place of birth - Foreign born (%) - White
Place of birth - Foreign born (%) - Black or African American
Place of birth - Foreign born (%) - Asian
Place of birth - Foreign born (%) - Hispanic or Latino
Place of birth - Foreign born (%) - American Indian and Alaska Native
Place of birth - Foreign born (%) - Multirace
Place of birth - Foreign born (%) - Other Race
Residents speaking English at home (%)
Residents speaking English at home - Born in the United States (%)
Residents speaking English at home - Native, born elsewhere (%)
Residents speaking English at home - Foreign born (%)
Residents speaking Spanish at home (%)
Residents speaking Spanish at home - Born in the United States (%)
Residents speaking Spanish at home - Native, born elsewhere (%)
Residents speaking Spanish at home - Foreign born (%)
Residents speaking other language at home (%)
Residents speaking other language at home - Born in the United States (%)
Residents speaking other language at home - Native, born elsewhere (%)
Residents speaking other language at home - Foreign born (%)
Marital status - Never married (%)
Marital status - Now married (%)
Marital status - Separated (%)
Marital status - Widowed (%)
Marital status - Divorced (%)
Ancestries Reported - Arab (%)
Ancestries Reported - Czech (%)
Ancestries Reported - Danish (%)
Ancestries Reported - Dutch (%)
Ancestries Reported - English (%)
Ancestries Reported - French (%)
Ancestries Reported - French Canadian (%)
Ancestries Reported - German (%)
Ancestries Reported - Greek (%)
Ancestries Reported - Hungarian (%)
Ancestries Reported - Irish (%)
Ancestries Reported - Italian (%)
Ancestries Reported - Lithuanian (%)
Ancestries Reported - Norwegian (%)
Ancestries Reported - Polish (%)
Ancestries Reported - Portuguese (%)
Ancestries Reported - Russian (%)
Ancestries Reported - Scotch-Irish (%)
Ancestries Reported - Scottish (%)
Ancestries Reported - Slovak (%)
Ancestries Reported - Subsaharan African (%)
Ancestries Reported - Swedish (%)
Ancestries Reported - Swiss (%)
Ancestries Reported - Ukrainian (%)
Ancestries Reported - United States (%)
Ancestries Reported - Welsh (%)
Ancestries Reported - West Indian (%)
Ancestries Reported - Other (%)
Geographical mobility - Same house 1 year ago (%)
Geographical mobility - Same house 1 year ago (%) - White
Geographical mobility - Same house 1 year ago (%) - Black or African American
Geographical mobility - Same house 1 year ago (%) - Asian
Geographical mobility - Same house 1 year ago (%) - Hispanic or Latino
Geographical mobility - Same house 1 year ago (%) - American Indian and Alaska Native
Geographical mobility - Same house 1 year ago (%) - Multirace
Geographical mobility - Same house 1 year ago (%) - Other Race
Geographical mobility - Moved within same county (%)
Geographical mobility - Moved within same county (%) - White
Geographical mobility - Moved within same county (%) - Black or African American
Geographical mobility - Moved within same county (%) - Asian
Geographical mobility - Moved within same county (%) - Hispanic or Latino
Geographical mobility - Moved within same county (%) - American Indian and Alaska Native
Geographical mobility - Moved within same county (%) - Multirace
Geographical mobility - Moved within same county (%) - Other Race
Geographical mobility - Moved from different county within same state (%)
Geographical mobility - Moved from different county within same state (%) - White
Geographical mobility - Moved from different county within same state (%) - Black or African American
Geographical mobility - Moved from different county within same state (%) - Asian
Geographical mobility - Moved from different county within same state (%) - Hispanic or Latino
Geographical mobility - Moved from different county within same state (%) - American Indian and Alaska Native
Geographical mobility - Moved from different county within same state (%) - Multirace
Geographical mobility - Moved from different county within same state (%) - Other Race
Geographical mobility - Moved from different state (%)
Geographical mobility - Moved from different state (%) - White
Geographical mobility - Moved from different state (%) - Black or African American
Geographical mobility - Moved from different state (%) - Asian
Geographical mobility - Moved from different state (%) - Hispanic or Latino
Geographical mobility - Moved from different state (%) - American Indian and Alaska Native
Geographical mobility - Moved from different state (%) - Multirace
Geographical mobility - Moved from different state (%) - Other Race
Geographical mobility - Moved from abroad (%)
Geographical mobility - Moved from abroad (%) - White
Geographical mobility - Moved from abroad (%) - Black or African American
Geographical mobility - Moved from abroad (%) - Asian
Geographical mobility - Moved from abroad (%) - Hispanic or Latino
Geographical mobility - Moved from abroad (%) - American Indian and Alaska Native
Geographical mobility - Moved from abroad (%) - Multirace
Geographical mobility - Moved from abroad (%) - Other Race
Place of birth for the foreign-born population - Ireland (%)
Place of birth for the foreign-born population - Denmark (%)
Place of birth for the foreign-born population - Norway (%)
Place of birth for the foreign-born population - Sweden (%)
Place of birth for the foreign-born population - United Kingdom (%)
Place of birth for the foreign-born population - England (%)
Place of birth for the foreign-born population - Scotland (%)
Place of birth for the foreign-born population - Other Northern Europe (%)
Place of birth for the foreign-born population - Austria (%)
Place of birth for the foreign-born population - Belgium (%)
Place of birth for the foreign-born population - France (%)
Place of birth for the foreign-born population - Germany (%)
Place of birth for the foreign-born population - Netherlands (%)
Place of birth for the foreign-born population - Switzerland (%)
Place of birth for the foreign-born population - Other Western Europe (%)
Place of birth for the foreign-born population - Greece (%)
Place of birth for the foreign-born population - Italy (%)
Place of birth for the foreign-born population - Portugal (%)
Place of birth for the foreign-born population - Spain (%)
Place of birth for the foreign-born population - Other Southern Europe (%)
Place of birth for the foreign-born population - Albania (%)
Place of birth for the foreign-born population - Belarus (%)
Place of birth for the foreign-born population - Bosnia and Herzegovina (%)
Place of birth for the foreign-born population - Bulgaria (%)
Place of birth for the foreign-born population - Croatia (%)
Place of birth for the foreign-born population - Czechoslovakia (%)
Place of birth for the foreign-born population - Hungary (%)
Place of birth for the foreign-born population - Latvia (%)
Place of birth for the foreign-born population - Lithuania (%)
Place of birth for the foreign-born population - North Macedonia (Macedonia) (%)
Place of birth for the foreign-born population - Moldova (%)
Place of birth for the foreign-born population - Poland (%)
Place of birth for the foreign-born population - Romania (%)
Place of birth for the foreign-born population - Russia (%)
Place of birth for the foreign-born population - Serbia (%)
Place of birth for the foreign-born population - Ukraine (%)
Place of birth for the foreign-born population - Other Eastern Europe (%)
Place of birth for the foreign-born population - China (%)
Place of birth for the foreign-born population - Hong Kong (%)
Place of birth for the foreign-born population - Taiwan (%)
Place of birth for the foreign-born population - Japan (%)
Place of birth for the foreign-born population - Korea (%)
Place of birth for the foreign-born population - Other Eastern Asia (%)
Place of birth for the foreign-born population - Afghanistan (%)
Place of birth for the foreign-born population - Bangladesh (%)
Place of birth for the foreign-born population - India (%)
Place of birth for the foreign-born population - Iran (%)
Place of birth for the foreign-born population - Kazakhstan (%)
Place of birth for the foreign-born population - Nepal (%)
Place of birth for the foreign-born population - Pakistan (%)
Place of birth for the foreign-born population - Sri Lanka (%)
Place of birth for the foreign-born population - Uzbekistan (%)
Place of birth for the foreign-born population - Other South Central Asia (%)
Place of birth for the foreign-born population - Burma (%)
Place of birth for the foreign-born population - Cambodia (%)
Place of birth for the foreign-born population - Indonesia (%)
Place of birth for the foreign-born population - Laos (%)
Place of birth for the foreign-born population - Malaysia (%)
Place of birth for the foreign-born population - Philippines (%)
Place of birth for the foreign-born population - Singapore (%)
Place of birth for the foreign-born population - Thailand (%)
Place of birth for the foreign-born population - Vietnam (%)
Place of birth for the foreign-born population - Other South Eastern Asia (%)
Place of birth for the foreign-born population - Armenia (%)
Place of birth for the foreign-born population - Iraq (%)
Place of birth for the foreign-born population - Israel (%)
Place of birth for the foreign-born population - Jordan (%)
Place of birth for the foreign-born population - Kuwait (%)
Place of birth for the foreign-born population - Lebanon (%)
Place of birth for the foreign-born population - Saudi Arabia (%)
Place of birth for the foreign-born population - Syria (%)
Place of birth for the foreign-born population - Turkey (%)
Place of birth for the foreign-born population - Yemen (%)
Place of birth for the foreign-born population - Other Western Asia (%)
Place of birth for the foreign-born population - Eritrea (%)
Place of birth for the foreign-born population - Ethiopia (%)
Place of birth for the foreign-born population - Kenya (%)
Place of birth for the foreign-born population - Somalia (%)
Place of birth for the foreign-born population - Uganda (%)
Place of birth for the foreign-born population - Zimbabwe (%)
Place of birth for the foreign-born population - Other Eastern Africa (%)
Place of birth for the foreign-born population - Cameroon (%)
Place of birth for the foreign-born population - Congo (%)
Place of birth for the foreign-born population - Democratic Republic of Congo (Zaire) (%)
Place of birth for the foreign-born population - Other Middle Africa (%)
Place of birth for the foreign-born population - Egypt (%)
Place of birth for the foreign-born population - Morocco (%)
Place of birth for the foreign-born population - Sudan (%)
Place of birth for the foreign-born population - Other Northern Africa (%)
Place of birth for the foreign-born population - South Africa (%)
Place of birth for the foreign-born population - Other Southern Africa (%)
Place of birth for the foreign-born population - Cabo Verde (%)
Place of birth for the foreign-born population - Ghana (%)
Place of birth for the foreign-born population - Liberia (%)
Place of birth for the foreign-born population - Nigeria (%)
Place of birth for the foreign-born population - Senegal (%)
Place of birth for the foreign-born population - Sierra Leone (%)
Place of birth for the foreign-born population - Other Western Africa (%)
Place of birth for the foreign-born population - Australia (%)
Place of birth for the foreign-born population - New Zealand (%)
Place of birth for the foreign-born population - Fiji (%)
Place of birth for the foreign-born population - Micronesia (%)
Place of birth for the foreign-born population - Bahamas (%)
Place of birth for the foreign-born population - Barbados (%)
Place of birth for the foreign-born population - Cuba (%)
Place of birth for the foreign-born population - Dominica (%)
Place of birth for the foreign-born population - Dominican Republic (%)
Place of birth for the foreign-born population - Grenada (%)
Place of birth for the foreign-born population - Haiti (%)
Place of birth for the foreign-born population - Jamaica (%)
Place of birth for the foreign-born population - St. Vincent and the Grenadines (%)
Place of birth for the foreign-born population - Trinidad and Tobago (%)
Place of birth for the foreign-born population - West Indies (%)
Place of birth for the foreign-born population - Other Caribbean (%)
Place of birth for the foreign-born population - Belize (%)
Place of birth for the foreign-born population - Costa Rica (%)
Place of birth for the foreign-born population - El Salvador (%)
Place of birth for the foreign-born population - Guatemala (%)
Place of birth for the foreign-born population - Honduras (%)
Place of birth for the foreign-born population - Mexico (%)
Place of birth for the foreign-born population - Nicaragua (%)
Place of birth for the foreign-born population - Panama (%)
Place of birth for the foreign-born population - Other Central America (%)
Place of birth for the foreign-born population - Argentina (%)
Place of birth for the foreign-born population - Bolivia (%)
Place of birth for the foreign-born population - Brazil (%)
Place of birth for the foreign-born population - Chile (%)
Place of birth for the foreign-born population - Colombia (%)
Place of birth for the foreign-born population - Ecuador (%)
Place of birth for the foreign-born population - Guyana (%)
Place of birth for the foreign-born population - Peru (%)
Place of birth for the foreign-born population - Uruguay (%)
Place of birth for the foreign-born population - Venezuela (%)
Place of birth for the foreign-born population - Other South America (%)
Place of birth for the foreign-born population - Canada (%)
Place of birth for the foreign-born population - Other Northern America (%)
Place of birth for the foreign-born population - Other (%)
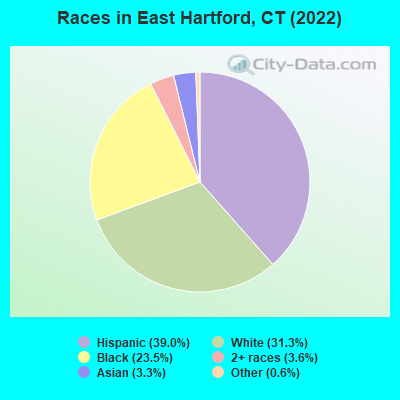
According to 2022 data, the most numerous races in East Hartford, CT are White alone (15,999 residents), Hispanic (19,970 residents), and Black alone (12,040 residents). 60.4% of East Hartford residents speak English at home. 20.3% of East Hartford, CT residents are foreign-born (11.9% born in Latin America, 2.8% born in Europe, 2.1% born in Asia), which is 26.1% greater than the foreign-born rate of 15.0% across the entire state of Connecticut.
Race distribution in East Hartford
2000 2022
29,557 59.6% White alone 9,051 18.3% Black alone 7,552 15.2% Hispanic 1,972 4.0% Asian alone 1,176 2.4% Two or more races 148 0.3% Other race alone 110 0.2% American Indian alone 9 0.02% Native Hawaiian and Other
19,970 39.0% Hispanic 15,999 31.3% White alone 12,040 23.5% Black alone 1,820 3.6% Two or more races 1,670 3.3% Asian alone 297 0.6% Other race alone 51 0.10% American Indian alone 51 0.10% Native Hawaiian and Other
2000 2022
2,638,845 77.5% White alone 320,323 9.4% Hispanic 295,571 8.7% Black alone 81,564 2.4% Asian alone 52,896 1.6% Two or more races 8,141 0.2% Other race alone 7,267 0.2% American Indian alone 958 0.03% Native Hawaiian and Other
2,246,913 62.0% White alone 658,978 18.2% Hispanic 353,973 9.8% Black alone 172,929 4.8% Asian alone 159,631 4.4% Two or more races 29,761 0.8% Other race alone 3,428 0.09% American Indian alone 592 0.02% Native Hawaiian and Other
Income and house value in East Hartford Median household income in 2022 $71,177 White non-Hispanic householders$52,337 Black householders$131,066 American Indian and Alaska Native householders$73,775 Asian householders$72,483 Some other race householders$67,957 Two or more races householders$66,601 Hispanic or Latino race householdersMedian 2022 house value $223,157 White Non-Hispanic householders$198,557 Black or African American householders$169,857 American Indian or Alaska Native householders $221,985 Asian householders$198,947 Some other race householders$213,395 Two or more races householders$211,442 Hispanic or Latino householders
Median age by race in East Hartford
44.5 Median age for White residents42.6 46.4 33.5 Median age for Black or African American residents31.8 36.6 29.5 Median age for American Indian / Alaska Native residents36.7 27.5 34.7 Median age for Asian residents39.9 32.0 6.6 Median age for Native Hawaiian / Pacific Islander residents-414,239,481.8 6.6 39.2 Median age for Other race residents34.6 46.3 31.5 Median age for Two or more races residents29.5 35.2 52.3 Median age for White alone residents49.8 55.2 32.1 Median age for Hispanic or Latino residents30.8 34.0
Owner/renter occupied households by race in East Hartford
House owners and renters - White residents 7,008 71.1% Owner occupied2,853 28.9% Renter occupiedHouse owners and renters - Black or African American residents 2,155 43.9% Owner occupied2,752 56.1% Renter occupiedHouse owners and renters - American Indian / Alaska Native residents 73 100.0% Owner occupiedHouse owners and renters - Asian residents 307 53.2% Owner occupied270 46.8% Renter occupiedHouse owners and renters - Native Hawaiian / Pacific Islander residents 16 100.0% Owner occupiedHouse owners and renters - Other race residents 1,243 52.8% Owner occupied1,111 47.2% Renter occupiedHouse owners and renters - Two or more races residents 2,338 62.9% Owner occupied1,382 37.1% Renter occupiedHouse owners and renters - White alone residents 6,168 79.0% Owner occupied1,644 21.0% Renter occupiedHouse owners and renters - Hispanic or Latino residents 3,681 51.8% Owner occupied3,428 48.2% Renter occupied
Language usage in East Hartford
English speakers - Total 60.4% of residents of East Hartford speak English at home.
29.5% of residents speak Spanish at home 10,245 72.4% Speak English very well3,910 27.6% Speak English less than very well10.9% of residents speak other language at home 3,324 63.6% Speak English very well1,905 36.4% Speak English less than very well
English speakers - Born in the United States 69.4% of residents of East Hartford speak English at home.
29.7% of residents speak Spanish at home 2,164 92.3% Speak English very well181 7.7% Speak English less than very well3.8% of residents speak other language at home 287 95.3% Speak English very well14 4.7% Speak English less than very well
English speakers - Native, born elsewhere 16.4% of residents of East Hartford speak English at home.
80.6% of residents speak Spanish at home 3,102 73.5% Speak English very well1,121 26.5% Speak English less than very well1.5% of residents speak other language at home 76 100.0% Speak English very well
English speakers - Foreign-born 28.3% of residents of East Hartford speak English at home.
34.1% of residents speak Spanish at home 1,273 36.3% Speak English very well2,237 63.7% Speak English less than very well37.9% of residents speak other language at home 2,211 56.8% Speak English very well1,685 43.2% Speak English less than very well
White (Caucasian) - Speak only English Native:
78.8% (14,621)Foreign-born:
13.9% (336)
White (Caucasian) - Speak another language Native:
17.2% (3,193)Foreign-born:
83.1% (2,007)
Black or African American - Speak only English Native:
85.2% (7,653)Foreign-born:
71.3% (2,647)
Black or African American - Speak another language Native:
15.6% (1,398)Foreign-born:
30.0% (1,114)
American Indian / Alaska Native - Speak only English Native:
30.3% (69)Foreign-born:
29.9% (4)
American Indian / Alaska Native - Speak another language Native:
85.9% (196)Foreign-born:
72.0% (9)
Asian - Speak only English Native:
36.7% (173)Foreign-born:
9.9% (104)
Asian - Speak another language Native:
62.4% (294)Foreign-born:
90.5% (956)
Native Hawaiian / Pacific Islander - Speak only English Native:
99.5% (17)Foreign-born:
96.3% (29)
Other race - Speak only English Native:
21.6% (963)Foreign-born:
3.2% (39)
Other race - Speak another language Native:
76.6% (3,420)Foreign-born:
97.4% (1,191)
Two or more races - Speak only English Native:
44.0% (2,912)Foreign-born:
2.8% (62)
Two or more races - Speak another language Native:
59.3% (3,923)Foreign-born:
100.0% (2,215)
White alone - Speak only English Native:
96.1% (13,253)Foreign-born:
10.9% (185)
White alone - Speak another language Native:
3.9% (545)Foreign-born:
88.4% (1,499)
Hispanic or Latino - Speak only English Native:
29.4% (4,317)Foreign-born:
5.1% (186)
Hispanic or Latino - Speak another language Native:
69.7% (10,213)Foreign-born:
95.1% (3,461)
Foreign-born residents in East Hartford 10,381 residents are foreign born (11.9% Latin America , 2.8% Europe , 2.1% Asia ).
This city:
20.3%Connecticut:
15.0%
Marital status for residents in East Hartford Marital status - White (Caucasian) population 15 years and over
Males 40.3% Never married45.5% Now married0.1% Separated2.7% Widowed11.4% DivorcedFemales 31.1% Never married41.2% Now married1.6% Separated12.0% Widowed14.1% DivorcedWomen who gave birth in the past 12 months Now married:
38.0% (80)Unmarried:
62.0% (130)
Women who did not give birth in the past 12 months Now married:
39.7% (1,673)Unmarried:
60.3% (2,546)
Marital status - Black or African American population 15 years and over
Males 58.2% Never married31.3% Now married1.0% Separated0.7% Widowed8.9% DivorcedFemales 57.8% Never married24.5% Now married1.3% Separated2.9% Widowed13.5% DivorcedWomen who gave birth in the past 12 months Now married:
51.0% (125)Unmarried:
49.0% (121)
Women who did not give birth in the past 12 months Now married:
17.3% (586)Unmarried:
82.7% (2,808)
Marital status - American Indian / Alaska Native population 15 years and over
Males 51.6% Never married27.5% Now married0.0% Separated0.0% Widowed20.9% DivorcedFemales 68.6% Never married29.4% Now married0.0% Separated2.0% Widowed0.0% DivorcedWomen who did not give birth in the past 12 months Now married:
24.7% (23)Unmarried:
75.3% (70)
Marital status - Asian population 15 years and over
Males 32.0% Never married60.0% Now married0.0% Separated6.9% Widowed1.1% DivorcedFemales 34.0% Never married49.3% Now married0.0% Separated6.3% Widowed10.4% DivorcedWomen who gave birth in the past 12 months Now married:
69.5% (65)Unmarried:
30.5% (28)
Women who did not give birth in the past 12 months Now married:
41.0% (146)Unmarried:
59.0% (210)
Marital status - Native Hawaiian / Pacific Islander population 15 years and over
Males 100.0% Never married0.0% Now married0.0% Separated0.0% Widowed0.0% DivorcedFemales 100.0% Never married0.0% Now married0.0% Separated0.0% Widowed0.0% DivorcedWomen who gave birth in the past 12 months Now married:
0.0% (0)Unmarried:
100.0% (15)
Marital status - Other race population 15 years and over
Males 51.5% Never married33.2% Now married3.0% Separated4.1% Widowed8.2% DivorcedFemales 34.9% Never married37.2% Now married9.8% Separated3.1% Widowed14.9% DivorcedWomen who gave birth in the past 12 months Now married:
28.2% (74)Unmarried:
71.8% (188)
Women who did not give birth in the past 12 months Now married:
47.4% (712)Unmarried:
52.6% (792)
Marital status - Two or more races population 15 years and over
Males 40.6% Never married49.3% Now married1.0% Separated0.1% Widowed9.0% DivorcedFemales 46.4% Never married39.5% Now married2.2% Separated2.6% Widowed9.4% DivorcedWomen who gave birth in the past 12 months Now married:
7.6% (11)Unmarried:
92.4% (130)
Women who did not give birth in the past 12 months Now married:
39.7% (1,058)Unmarried:
60.3% (1,609)
Marital status - White alone, not Hispanic / Latino population 15 years and over
Males 37.6% Never married47.1% Now married0.0% Separated3.3% Widowed12.0% DivorcedFemales 27.4% Never married43.1% Now married0.7% Separated14.9% Widowed13.9% DivorcedWomen who gave birth in the past 12 months Now married:
60.8% (44)Unmarried:
39.2% (28)
Women who did not give birth in the past 12 months Now married:
39.3% (1,069)Unmarried:
60.7% (1,651)
Marital status - Hispanic or Latino population 15 years and over
Males 49.2% Never married38.9% Now married1.4% Separated1.6% Widowed9.0% DivorcedFemales 42.4% Never married38.3% Now married4.9% Separated2.7% Widowed11.8% DivorcedWomen who gave birth in the past 12 months Now married:
20.5% (94)Unmarried:
79.5% (362)
Women who did not give birth in the past 12 months Now married:
41.6% (2,190)Unmarried:
58.4% (3,080)
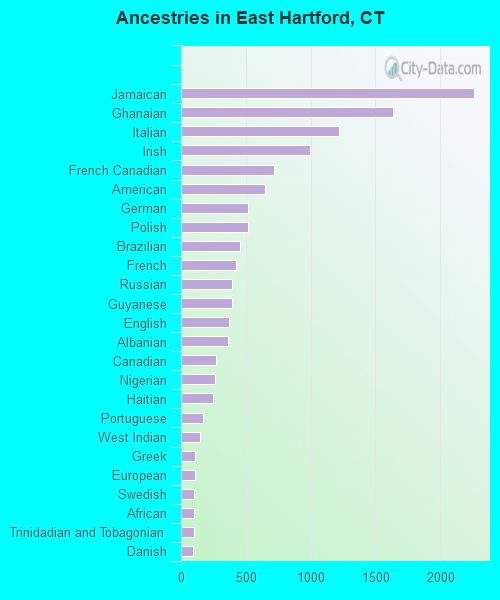
Ancestries in East Hartford
2,263 7.2% Jamaican1,636 5.2% Ghanaian1,221 3.9% Italian994 3.1% Irish717 2.3% French Canadian651 2.1% American516 1.6% German515 1.6% Polish456 1.4% Brazilian425 1.3% French395 1.3% Russian394 1.2% Guyanese371 1.2% English360 1.1% Albanian268 0.8% Canadian263 0.8% Nigerian248 0.8% Haitian173 0.5% Portuguese148 0.5% West Indian105 0.3% Greek105 0.3% European101 0.3% Swedish101 0.3% African98 0.3% Trinidadian and Tobagonian91 0.3% Danish71 0.2% British West Indian61 0.2% Ukrainian53 0.2% Scottish52 0.2% Dutch40 0.1% Lithuanian40 0.1% Ethiopian25 0.08% British18 0.06% Armenian17 0.05% Serbian15 0.05% Norwegian13 0.04% Barbadian11 0.03% Syrian11 0.03% Eastern European8 0.03% Iraqi7 0.02% Czech6 0.02% Belizean5 0.02% Latvian3 0.01% Welsh
Geographical mobility in East Hartford Same house 1 year ago 19,801 89.6% White (Caucasian)10,907 84.3% Black or African American255 94.4% American Indian / Alaska Native1,417 87.6% Asian48 100.0% Native Hawaiian / Pacific Islander5,877 100.0% Other race9,009 93.5% Two or more races14,831 93.0% White alone, not Hispanic / Latino17,808 91.4% Hispanic or LatinoMoved within same county 1,335 6.0% White / Caucasian1,024 7.9% Black or African American58 3.6% Asian86 1.5% Other race503 5.2% Two or more races465 2.9% White alone, not Hispanic / Latino1,308 6.7% Hispanic or LatinoMoved within same state 187 0.8% White / Caucasian52 0.4% Black or African American9 0.5% Asian1 0.0% Other race23 0.2% Two or more races79 0.5% White alone, not Hispanic / Latino127 0.7% Hispanic or LatinoMoved from different state 351 1.6% White / Caucasian906 7.0% Black or African American2 0.7% American Indian / Alaska Native8 0.1% Two or more races316 2.0% White alone, not Hispanic / Latino53 0.3% Hispanic or LatinoMoved from abroad 203 0.9% White39 0.3% Black or African American132 8.2% Asian54 0.9% Other race62 0.6% Two or more races210 1.3% White alone, not Hispanic / Latino97 0.5% Hispanic or Latino
Children Nativity (place of birth) in East Hartford
Children under 6 years - Living with two parents Both parents native 881 98.4% Native15 1.6% Foreign-bornBoth parents foreign-born 468 90.0% Native52 10.0% Foreign-bornOne native, one foreign-born parent 162 83.3% Native32 16.7% Foreign-bornChildren under 6 years - Living with one parent Native parent 1,252 100.0% NativeForeign-born parent 392 100.0% NativeChildren 6 to 17 years - Living with two parents Both parents native 2,210 98.3% Native39 1.7% Foreign-bornBoth parents foreign-born 873 89.3% Native104 10.7% Foreign-bornOne native, one foreign-born parent 210 74.5% Native72 25.5% Foreign-bornChildren 6 to 17 years - Living with one parent Native parent 2,209 100.0% NativeForeign-born parent 1,120 54.2% Native946 45.8% Foreign-born
Place of birth for residents in East Hartford 6,650 Americas6,367 Latin America2,852 Caribbean2,494 South America1,488 Europe1,139 Asia1,078 Africa1,020 Central America1,003 Western Africa897 Eastern Europe617 South Eastern Asia439 South Central Asia430 Southern Europe283 Northern America103 Northern Europe76 Eastern Asia76 China57 Western Europe24 Oceania24 Australia and New Zealand Subregion7 Eastern Africa6 Western Asia1,771 Jamaica1,452 Peru841 Ghana599 El Salvador461 Dominican Republic426 Vietnam383 Russia356 Brazil355 India299 Albania283 Canada214 Mexico207 Colombia184 Honduras174 Portugal153 St. Lucia149 Guyana138 Italy132 Argentina129 Haiti123 Trinidad and Tobago120 Poland109 Nigeria95 Greece88 Philippines84 Cuba84 St. Vincent and the Grenadines77 Bolivia76 Laos76 Chile75 Bangladesh62 China55 England50 Germany43 Ukraine35 United Kingdom24 Moldova24 Australia21 Spain21 Venezuela18 Ecuador17 West Indies17 Azores Islands15 Barbados14 Burma (Myanmar)14 Guatemala13 Hong Kong8 Nepal7 Netherlands7 Ethiopia7 Costa Rica6 Iraq6 Thailand5 Indonesia4 Ireland4 Latvia
Grandparents responsible for own grandchildren in East Hartford
Grandparents (30 to 59 years) White / Caucasian 103 100.0% Not responsible for grandchildrenBlack or African American 7 9.5% Responsible for grandchildren69 90.5% Not responsible for grandchildrenOther race 9 12.1% Responsible for grandchildren62 87.9% Not responsible for grandchildrenTwo or more races 158 55.5% Responsible for grandchildren126 44.5% Not responsible for grandchildrenWhite alone, not Hispanic / Latino 20 100.0% Not responsible for grandchildrenHispanic or Latino 70 22.8% Responsible for grandchildren236 77.2% Not responsible for grandchildrenGrandparents (60 years and over) White / Caucasian 16 10.0% Responsible for grandchildren148 90.0% Not responsible for grandchildrenBlack or African American 82 30.4% Responsible for grandchildren186 69.6% Not responsible for grandchildrenOther race 26 20.1% Responsible for grandchildren104 79.9% Not responsible for grandchildrenTwo or more races 60 100.0% Not responsible for grandchildrenWhite alone, not Hispanic / Latino 14 8.5% Responsible for grandchildren150 91.5% Not responsible for grandchildrenHispanic or Latino 20 12.2% Responsible for grandchildren144 87.8% Not responsible for grandchildren