Chelmsford, MA (Massachusetts) Houses and Residents
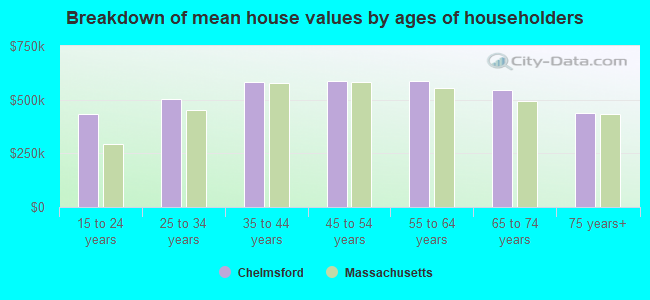
| Chelmsford: | $580,849 |
| Massachusetts: | $534,700 |
Total population: 33,802 (All urban)
Houses: 13,025 (12,812 occupied: 10,744 owner occupied, 2,068 renter occupied)
| % of renters here: | 16% |
| State: | 38% |
Housing density: 575 houses/condos per square mile
Median price asked for vacant for-sale houses and condos in 2022 in this county: $1,068,910.
Median contract rent in 2022: $1,793 (lower quartile is $1,318, upper quartile is over $2,000)
Median rent asked for vacant for-rent units in 2022: $2,566
Median gross rent in Chelmsford, MA in 2022: $1,858
Housing units in Chelmsford with a mortgage: 6,932 (461 second mortgage, 1,123 home equity loan, 17 both second mortgage and home equity loan)
Houses without a mortgage: 2,451
Compare current foreclosures near Chelmsford, MA:
| Photo | Address | Area | Beds / Baths | Price | Details |
|---|---|---|---|---|---|

|
#1
Regina Dr
Chelmsford, MA 01824
|
4,272 sq. feet
|
3 baths 4 beds |
show details | |

|
#2
Jensen Ave
Chelmsford, MA 01824
|
2,066 sq. feet
|
1 baths 3 beds |
show details | |

|
#3
Balsam Dr
Chelmsford, MA 01824
|
1,026 sq. feet
|
2 baths 3 beds |
show details | |

|
#4
B St
Chelmsford, MA 01824
|
725 sq. feet
|
1 baths 2 beds |
show details | |

|
#5
Acton Rd
Chelmsford, MA 01824
|
3,536 sq. feet
|
3 baths 3 beds |
show details | |

|
#6
Gorham St
Chelmsford, MA 01824
|
2,244 sq. feet
|
2 baths 4 beds |
show details | |

|
#7
Concord Rd
Chelmsford, MA 01824
|
1,382 sq. feet
|
2 baths 3 beds |
show details | |

|
#8
Sands Pl
Chelmsford, MA 01824
|
986 sq. feet
|
1 baths 3 beds |
show details | |

|
#9
Regina Dr
Chelmsford, MA 01824
|
2,964 sq. feet
|
2 baths 4 beds |
show details | |

|
#10
Gorham St
Chelmsford, MA 01824
|
- sq. feet
|
- baths - beds |
show details |
| Photo | Address | Area | Beds / Baths | Price | Details |
|---|---|---|---|---|---|

|
#11
Littleton Rd
Chelmsford, MA 01824
|
- sq. feet
|
- baths - beds |
show details | |

|
#12
Reo Rd
Maynard, MA 01754
|
987 sq. feet
|
1 baths 3 beds |
show details | |

|
#13
Merrimac Way Unit G
Tyngsboro, MA 01879
|
1,026 sq. feet
|
2 baths 2 beds |
show details | |

|
#14
Riverview Blvd
Methuen, MA 01844
|
1,200 sq. feet
|
3 baths 2 beds |
show details | |

|
#15
N Billerica Rd Apt 9
Lowell, MA 01852
|
661 sq. feet
|
1 baths 2 beds |
show details | |

|
#16
Maple St
Pepperell, MA 01463
|
2,852 sq. feet
|
3 baths 4 beds |
show details | |

|
#17
Jefferson Rd
Wakefield, MA 01880
|
1,540 sq. feet
|
2 baths 4 beds |
show details | |

|
#18
Lafayette St
Lowell, MA 01854
|
1,377 sq. feet
|
2 baths 3 beds |
show details | |

|
#19
Bedford Ln
Lincoln, MA 01773
|
2,372 sq. feet
|
2 baths 4 beds |
show details | |

|
#20
Avola St
Arlington, MA 02476
|
1,773 sq. feet
|
2 baths 3 beds |
show details |
| Photo | Address | Area | Beds / Baths | Price | Details |
|---|---|---|---|---|---|

|
#21
University Ave
Lowell, MA 01854
|
1,548 sq. feet
|
2 baths 4 beds |
show details | |

|
#22
Hartwell Ave
Littleton, MA 01460
|
1,644 sq. feet
|
2 baths 4 beds |
show details | |

|
#23
Chestnut Ln
Carlisle, MA 01741
|
5,031 sq. feet
|
5 baths 5 beds |
show details | |

|
#24
Lowell St
Lynnfield, MA 01940
|
2,330 sq. feet
|
2 baths 3 beds |
show details | |

|
#25
Mettacomet Path
Harvard, MA 01451
|
1,044 sq. feet
|
2 baths 1 beds |
show details | |

|
#26
High St
Acton, MA 01720
|
2,566 sq. feet
|
4 baths 5 beds |
show details | |

|
#27
Spencer St
Methuen, MA 01844
|
1,269 sq. feet
|
2 baths 3 beds |
show details | |

|
#28
Crawford St
Lowell, MA 01854
|
1,957 sq. feet
|
2 baths 3 beds |
show details | |

|
#29
Lowell Rd
North Reading, MA 01864
|
858 sq. feet
|
1 baths 1 beds |
show details | |

|
#30
Putnam Rd
Reading, MA 01867
|
1,630 sq. feet
|
2 baths 3 beds |
show details |
| Photo | Address | Area | Beds / Baths | Price | Details |
|---|---|---|---|---|---|

|
#31
Lawrence Rd
Salem, NH 03079
|
1,305 sq. feet
|
1 baths 1 beds |
show details | |

|
#32
Old Ferry Rd
Methuen, MA 01844
|
2,482 sq. feet
|
3 baths 5 beds |
show details | |

|
#33
Tobey Rd Unit 23
Dracut, MA 01826
|
1,261 sq. feet
|
2 baths 2 beds |
show details | |

|
#34
Lampson Ln
Billerica, MA 01821
|
1,474 sq. feet
|
3 baths 3 beds |
show details | |

|
#35
West St
Lawrence, MA 01841
|
1,292 sq. feet
|
1 baths 2 beds |
show details | |

|
#36
Poor St
Andover, MA 01810
|
1,080 sq. feet
|
1 baths 3 beds |
show details | |

|
#37
Arlington St
Dracut, MA 01826
|
1,710 sq. feet
|
2 baths 3 beds |
show details | |

|
#38
West St
Wilmington, MA 01887
|
1,448 sq. feet
|
2 baths 3 beds |
show details | |

|
#39
Lowell St
Andover, MA 01810
|
2,106 sq. feet
|
1 baths 3 beds |
show details | |

|
#40
Edwards St
Dracut, MA 01826
|
2,207 sq. feet
|
2 baths 5 beds |
show details |
| Photo | Address | Area | Beds / Baths | Price | Details |
|---|---|---|---|---|---|

|
#41
Main St
Tewksbury, MA 01876
|
1,568 sq. feet
|
2 baths 3 beds |
show details | |

|
#42
Jacqueline Rd Apt F
Waltham, MA 02452
|
780 sq. feet
|
1 baths 2 beds |
show details | |

|
#43
Larchwood St
North Billerica, MA 01862
|
1,898 sq. feet
|
2 baths 3 beds |
show details | |

|
#44
Pleasant St
Tewksbury, MA 01876
|
4,144 sq. feet
|
3 baths 4 beds |
show details | |

|
#45
Norma Dr
Nashua, NH 03062
|
1,361 sq. feet
|
2 baths 3 beds |
show details | |

|
#46
Cricket Ln
North Andover, MA 01845
|
4,135 sq. feet
|
5 baths 4 beds |
show details | |

|
#47
Burroughs Rd
Boxborough, MA 01719
|
3,566 sq. feet
|
5 baths 5 beds |
show details | |

|
#48
Old Bolton Rd
Hudson, MA 01749
|
1,244 sq. feet
|
1 baths 3 beds |
show details | |

|
#49
Schaefer Cir
Hudson, NH 03051
|
4,358 sq. feet
|
3 baths 5 beds |
show details | |

|
Check over 1 million property listings on Foreclosure.com!
|
browse all offers | |||
Latest news about housing in Chelmsford, MA collected exclusively by city-data.com from local newspapers, TV, and radio stations


Household type by relationship:
Households: 1,447,673- In family households: 1,161,600 (250,263 male householders, 116,393 female householders)
287,332 spouses, 410,462 children (392,286 natural, 9,871 adopted, 8,305 stepchildren), 16,644 grandchildren, 14,569 brothers or sisters, 15,064 parents, foster children, 15,023 other relatives, 25,838 non-relatives
- In nonfamily households: 286,073 (95,244 male householders (67,197 living alone)), 118,788 female householders (94,319 living alone)), 72,041 nonrelatives
- In group quarters: 55,412 (13,773 institutionalized population)
252,928 married couples with children.
55,356 single-parent households (9,721 men, 45,635 women).
90.0% of residents of Chelmsford speak English at home.
1.6% of residents speak Spanish at home (54% speak English very well, 20% speak English well, 21% speak English not well, 4% don't speak English at all).
5.0% of residents speak other Indo-European language at home (77% speak English very well, 16% speak English well, 6% speak English not well, 1% don't speak English at all).
3.0% of residents speak Asian or Pacific Island language at home (53% speak English very well, 30% speak English well, 16% speak English not well, 2% don't speak English at all).
0.3% of residents speak other language at home (84% speak English very well, 16% speak English well).
Foreign born population: 4,039 (10.8%)
(75.2% of them are naturalized citizens)
| Here: | 6.9 |
| State: | 6.5 |
| Here: | 3.0 |
| State: | 4.0 |
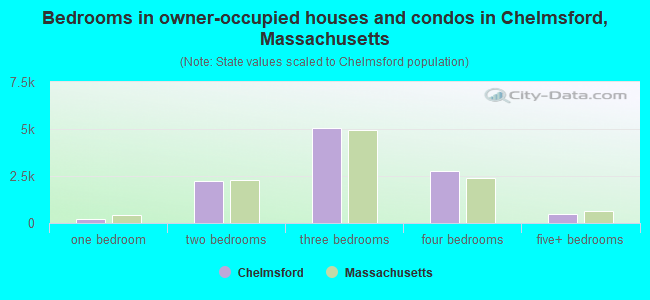
- Bedrooms in owner-occupied houses and condos in Chelmsford, Massachusetts
- 0no bedroom
- 2031 bedroom
- 2,2362 bedrooms
- 5,0613 bedrooms
- 2,7484 bedrooms
- 4965+ bedrooms
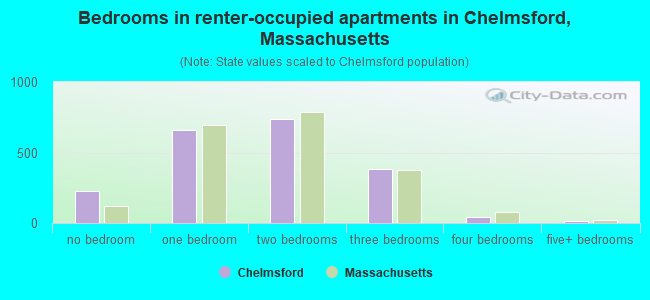
- Bedrooms in renter-occupied apartments in Chelmsford, Massachusetts
- 227no bedroom
- 6581 bedroom
- 7412 bedrooms
- 3843 bedrooms
- 424 bedrooms
- 165+ bedrooms
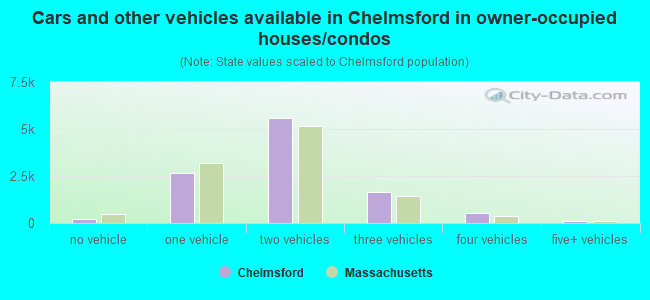
- Cars and other vehicles available in Chelmsford in owner-occupied houses/condos
- 236no vehicle
- 2,6471 vehicle
- 5,5842 vehicles
- 1,6513 vehicles
- 5064 vehicles
- 1205+ vehicles
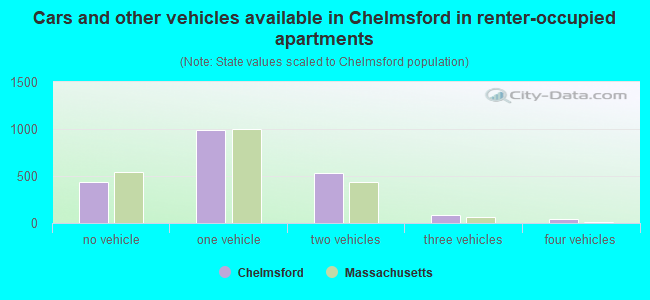
- Cars and other vehicles available in Chelmsford in renter-occupied apartments
- 432no vehicle
- 9861 vehicle
- 5302 vehicles
- 813 vehicles
- 394 vehicles
- 05+ vehicles
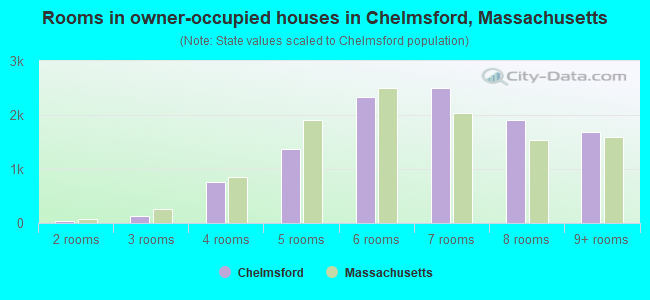
- Rooms in owner-occupied houses in Chelmsford, Massachusetts
- 01 room
- 332 rooms
- 1323 rooms
- 7614 rooms
- 1,3735 rooms
- 2,3396 rooms
- 2,5057 rooms
- 1,9118 rooms
- 1,6909+ rooms
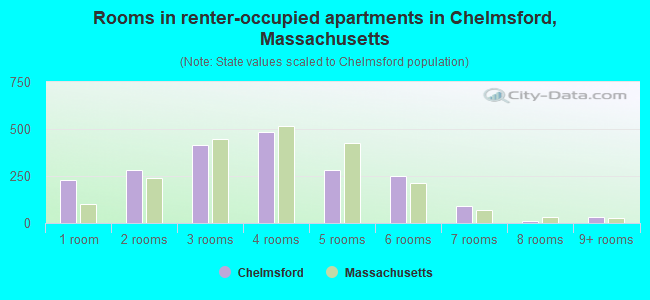
- Rooms in renter-occupied apartments in Chelmsford, Massachusetts
- 2271 room
- 2812 rooms
- 4153 rooms
- 4834 rooms
- 2835 rooms
- 2486 rooms
- 927 rooms
- 88 rooms
- 319+ rooms
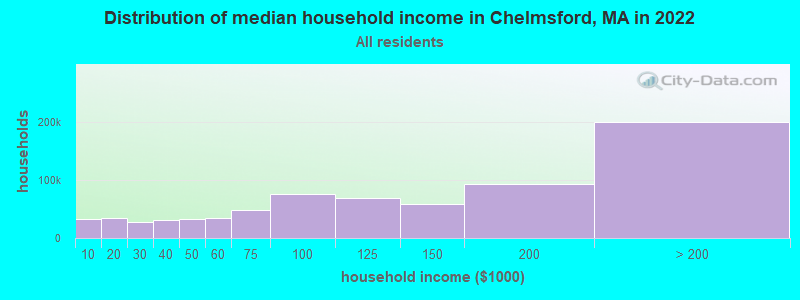
Chelmsford, MA household income distribution

- 32,957Less than $10,000
- 34,862$10,000 to $19,999
- 27,908$20,000 to $29,999
- 30,937$30,000 to $39,999
- 32,959$40,000 to $49,999
- 34,235$50,000 to $59,999
- 47,902$60,000 to $74,999
- 74,984$75,000 to $99,999
- 69,556$100,000 to $124,999
- 57,937$125,000 to $149,999
- 93,067$150,000 to $199,999
- 199,404$200,000 or more
Percentage of workers working in this county: 84.7%
Number of people working at home: 5,124 (24.7% of all workers)
Travel time to work (commute)
- Less than 5 minutes: 251
- 5 to 9 minutes: 1,328
- 10 to 14 minutes: 2,517
- 15 to 19 minutes: 2,411
- 20 to 24 minutes: 2,575
- 25 to 29 minutes: 1,142
- 30 to 34 minutes: 2,396
- 35 to 39 minutes: 622
- 40 to 44 minutes: 951
- 45 to 59 minutes: 1,722
- 60 to 89 minutes: 992
- 90 or more minutes: 484
Means of transportation to work:
- Drove a car alone: 15,736 (87.8%)
- Carpooled: 1,072 (6.0%)
- Bus or trolley bus: 38 (0.2%)
- Subway or elevated: 20 (0.1%)
- Railroad: 329 (1.8%)
- Taxi: 24 (0.1%)
- Bicycle: 5 (0.0%)
- Walked: 117 (0.7%)
- Other means: 50 (0.3%)
- Worked at home: 538 (3.0%)
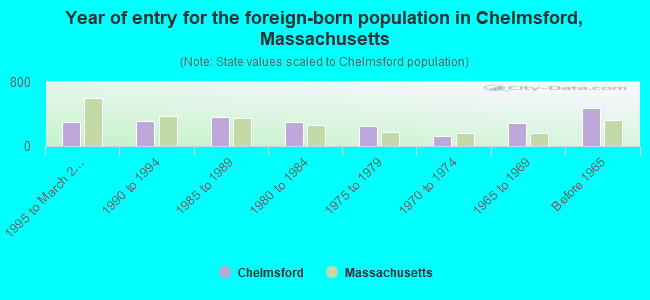
- Year of entry for the foreign-born population in Chelmsford, Massachusetts
- 2941995 to March 2000
- 3141990 to 1994
- 3651985 to 1989
- 3041980 to 1984
- 2541975 to 1979
- 1271970 to 1974
- 2841965 to 1969
- 476Before 1965
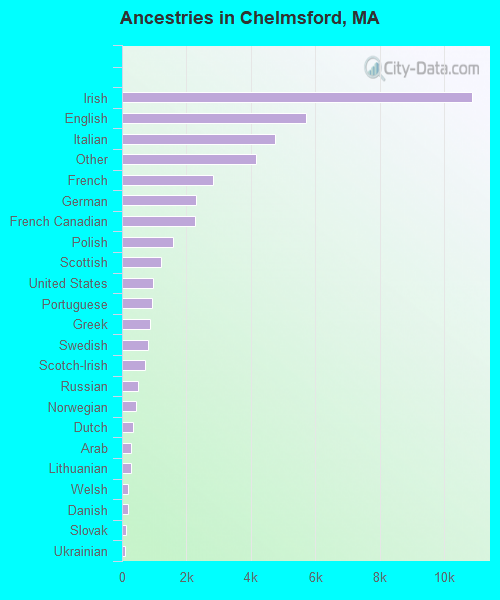
First ancestries reported:
- Irish: 10,852 (25.4%)
- English: 5,726 (13.4%)
- Italian: 4,752 (11.1%)
- Other: 4,173 (9.8%)
- French: 2,813 (6.6%)
- German: 2,309 (5.4%)
- French Canadian: 2,268 (5.3%)
- Polish: 1,569 (3.7%)
- Scottish: 1,211 (2.8%)
- United States: 974 (2.3%)
- Portuguese: 942 (2.2%)
- Greek: 872 (2.0%)
- Swedish: 821 (1.9%)
- Scotch-Irish: 721 (1.7%)
- Russian: 486 (1.1%)
- Norwegian: 449 (1.1%)
- Dutch: 336 (0.8%)
- Arab: 293 (0.7%)
- Lithuanian: 272 (0.6%)
- Welsh: 176 (0.4%)
- Danish: 174 (0.4%)
- Slovak: 121 (0.3%)
- Ukrainian: 105 (0.2%)
- Hungarian: 83 (0.2%)
- Czech: 70 (0.2%)
- Subsaharan African: 58 (0.1%)
- Swiss: 31 (0.07%)
- West Indian: 27 (0.06%)
Most common places of birth for foreign-born residents (%):
| Chelmsford: | 11.6% (280) |
| Massachusetts: | 3.6% (28,086) |
| Chelmsford: | 10.0% (242) |
| Massachusetts: | 3.3% (25,403) |
| Chelmsford: | 8.7% (210) |
| Massachusetts: | 5.2% (40,247) |
| Chelmsford: | 7.2% (174) |
| Massachusetts: | 5.1% (39,255) |
| Chelmsford: | 6.4% (155) |
| Massachusetts: | 0.9% (7,258) |
| Chelmsford: | 4.5% (110) |
| Massachusetts: | 3.9% (30,457) |
| Chelmsford: | 4.3% (103) |
| Massachusetts: | 1.7% (12,975) |
| Chelmsford: | 4.3% (103) |
| Massachusetts: | 1.7% (13,456) |
| Chelmsford: | 4.1% (98) |
| Massachusetts: | 8.6% (66,627) |
| Chelmsford: | 3.6% (88) |
| Massachusetts: | 0.6% (4,416) |
| Chelmsford: | 2.9% (70) |
| Massachusetts: | 2.0% (15,286) |
| Chelmsford: | 2.9% (69) |
| Massachusetts: | 1.9% (14,883) |
| Chelmsford: | 2.9% (69) |
| Massachusetts: | 1.8% (13,801) |
| Chelmsford: | 2.6% (62) |
| Massachusetts: | 1.6% (12,350) |
| Chelmsford: | 2.2% (54) |
| Massachusetts: | 3.7% (28,319) |
| Chelmsford: | 1.9% (46) |
| Massachusetts: | 1.1% (8,682) |
| Chelmsford: | 1.6% (39) |
| Massachusetts: | 0.2% (1,659) |
| Chelmsford: | 1.6% (38) |
| Massachusetts: | 1.0% (7,937) |
Place of birth for U.S.-born residents:
- This state: 24,723
- Other state: 6,547
- Northeast: 3,851
- Midwest: 1,034
- South: 1,022
- West: 640
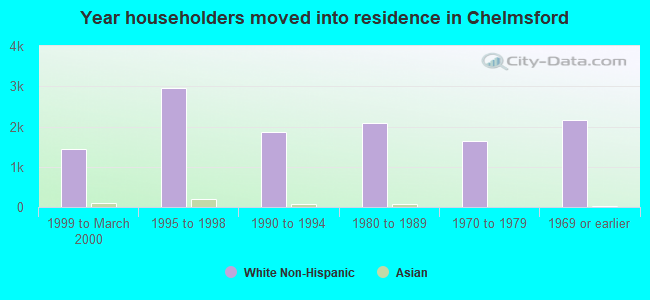
66% of Chelmsford residents lived in the same house 5 years ago.
Out of people who lived in different houses, 70% lived in this county.
Out of people who lived in different counties, 38% lived in Massachusetts.
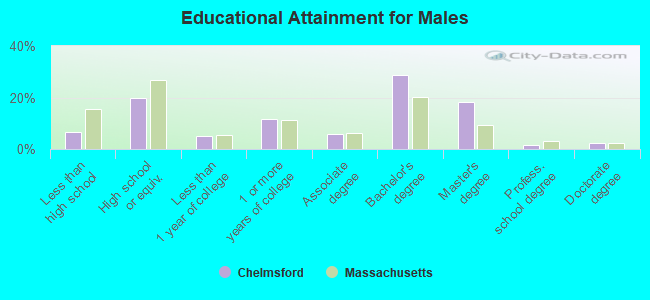
Education attainment for males 25 years and older:
- No schooling: 24
- Nursery to 4th grade: 7
- 5th and 6th grade: 17
- 7th and 8th grade: 161
- 9th grade: 104
- 10th grade: 207
- 11th grade: 86
- 12th grade, no diploma: 127
- High school graduate (or equivalency): 2,203
- Less than 1 year of college: 564
- Some college more than 1 year, no degree: 1,303
- Associate degree: 636
- Bachelor's degree: 3,159
- Master's degree: 2,020
- Professional school degree: 171
- Doctorate degree: 256
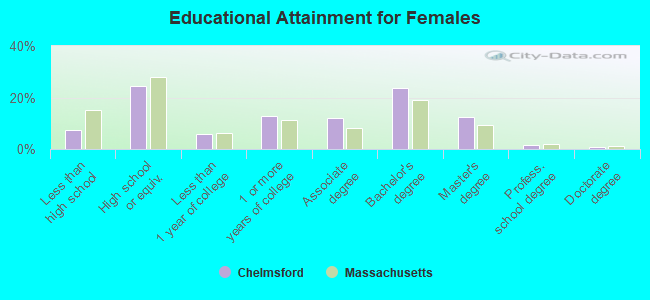
Education attainment for females 25 years and older:
- No schooling: 32
- Nursery to 4th grade: 22
- 5th and 6th grade: 26
- 7th and 8th grade: 237
- 9th grade: 119
- 10th grade: 173
- 11th grade: 97
- 12th grade, no diploma: 215
- High school graduate (or equivalency): 3,063
- Less than 1 year of college: 714
- Some college more than 1 year, no degree: 1,599
- Associate degree: 1,515
- Bachelor's degree: 2,968
- Master's degree: 1,548
- Professional school degree: 201
- Doctorate degree: 80


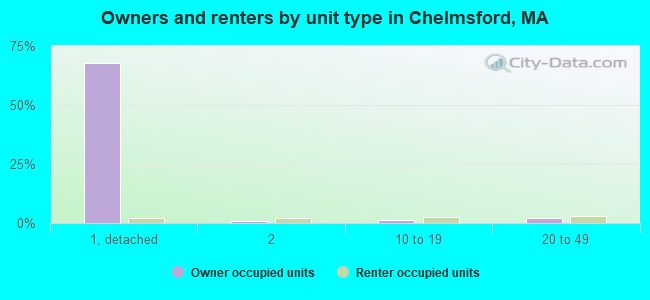
Housing units in structures:
- One, detached: 9,074
- One, attached: 1,144
- Two: 425
- 3 or 4: 285
- 5 to 9: 249
- 10 to 19: 529
- 20 to 49: 635
- 50 or more: 418
- Mobile homes: 266
Median worth of mobile homes: $61,441
Housing units lacking complete kitchen facilities: 1.6%
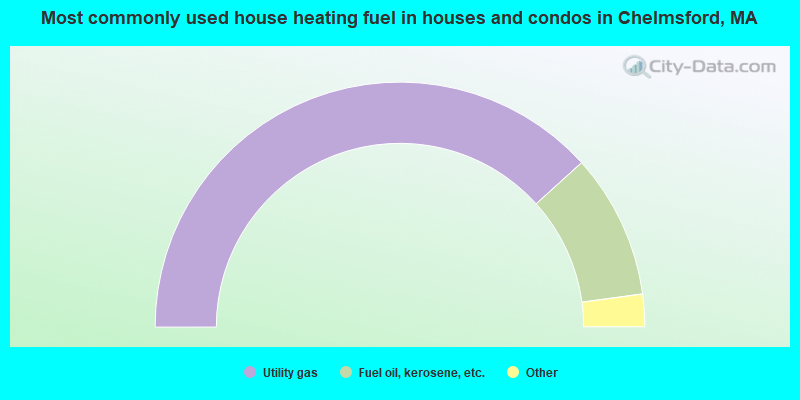
- 76.6%Utility gas
- 19.1%Fuel oil, kerosene, etc.
- 3.3%Electricity
- 0.4%Bottled, tank, or LP gas
- 0.4%Wood
- 0.1%Coal or coke
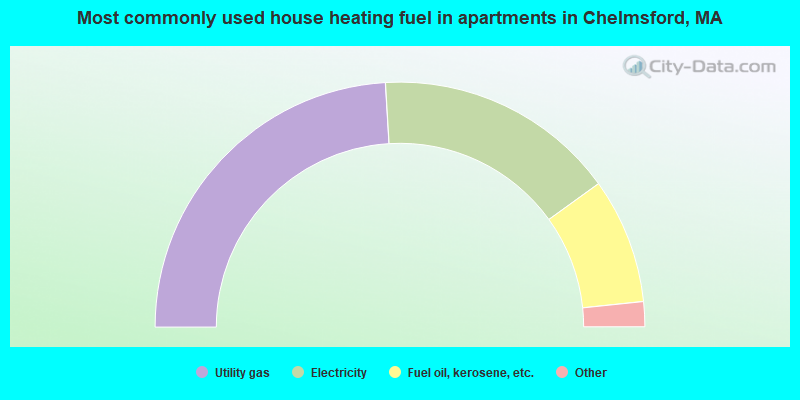
- 48.1%Utility gas
- 32.0%Electricity
- 16.6%Fuel oil, kerosene, etc.
- 2.6%Bottled, tank, or LP gas
- 0.4%Other fuel
- 0.4%No fuel used
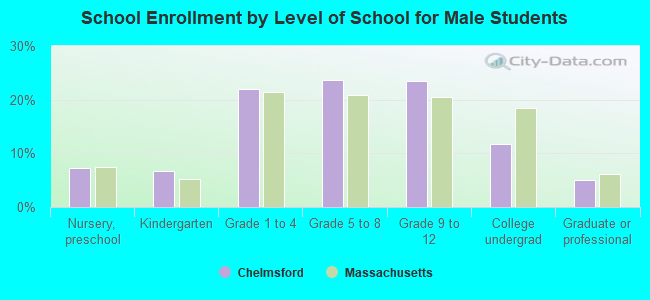
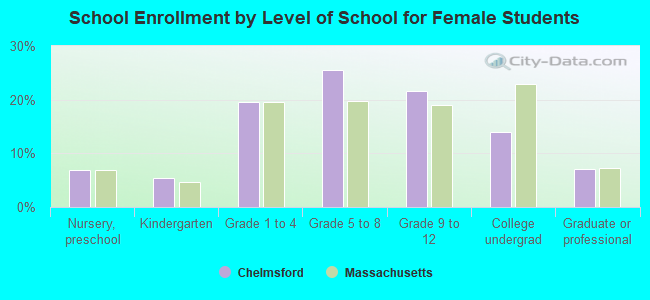
Private vs. public school enrollment:
| Here: | 4.5% |
| Massachusetts: | 10.8% |
| Here: | 3.5% |
| Massachusetts: | 12.2% |
| Here: | 35.0% |
| Massachusetts: | 48.2% |