Chelmsford, Massachusetts (MA) income map, earnings map, and wages data
The median household income in Chelmsford, MA in 2022 was $137,133, which was 31.1% greater than the median annual income of $94,488 across the entire state of Massachusetts. Compared to the median income of $70,207 in 2000 this represents an increase of 48.8%. The per capita income in 2022 was $63,251, which means an increase of 51.8% compared to 2000 when it was $30,465.
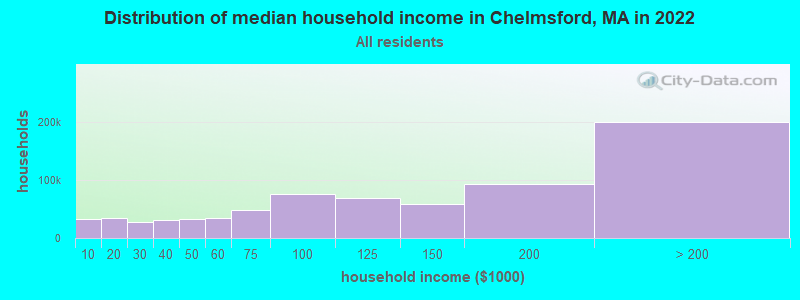
Income statistics for all residents
Median household income in Chelmsford, MA in 2022:| Chelmsford: | $137,133 |
| State: | $94,488 |
Change in median household income between 2000 and 2022:| Chelmsford, Massachusetts: | +95.3% |
| Massachusetts: | +87.1% |
Number of households with income < $10k:| Chelmsford: | 4.5% (32,957) |
| State: | 5.2% (146,170) |
Number of households with income $10k - 20k:| Chelmsford: | 4.7% (34,862) |
| State: | 6.4% (180,001) |
Number of households with income $20k - 30k:| Chelmsford: | 3.8% (27,908) |
| State: | 5.6% (156,667) |
Number of households with income $30k - 40k:| Chelmsford: | 4.2% (30,937) |
| State: | 5.6% (157,168) |
Number of households with income $40k - 50k:| Chelmsford: | 4.5% (32,959) |
| State: | 5.4% (151,455) |
Number of households with income $50k - 60k:| Chelmsford: | 4.6% (34,235) |
| Massachusetts: | 5.1% (142,726) |
Number of households with income $60k - 75k:| Chelmsford: | 6.5% (47,902) |
| State: | 7.6% (212,203) |
Number of households with income $75k - 100k:| Chelmsford: | 10.2% (74,984) |
| State: | 11.3% (317,064) |
Number of households with income $100k - 125k:| Chelmsford: | 9.4% (69,556) |
| State: | 9.7% (270,603) |
Number of households with income $125k - 150k:| Chelmsford: | 7.9% (57,937) |
| State: | 8.0% (223,140) |
Number of households with income $150k - 200k:| Chelmsford: | 12.6% (93,067) |
| State: | 11.0% (308,695) |
Number of households with income > $200k:| Chelmsford: | 27.1% (199,404) |
| State: | 19.0% (531,884) |
Aggregate household income in Chelmsford in 2022: $49,569,349,405
Median family income in Chelmsford in 2022:| Chelmsford: | $168,188 |
| State: | $120,263 |
Median non-family income in Chelmsford in 2022:| Chelmsford: | $66,028 |
| Massachusetts: | $55,979 |
Change in median non-family income between 2000 and 2022:| Chelmsford, Massachusetts: | +94.2% |
| State: | +88.0% |
Median per capita income in Chelmsford in 2022:| Chelmsford: | $63,251 |
| State: | $54,025 |
Change in median per capita income between 2000 and 2022:| Chelmsford, Massachusetts: | +107.6% |
| State: | +108.2% |
Income statistics for White residents
Median household income in Chelmsford, MA in 2022:| Chelmsford: | $137,332 |
| State: | $101,391 |
Change in median household income between 2000 and 2022:| Chelmsford, Massachusetts: | +98.2% |
| State: | +93.3% |
Number of households with income < $10k:| Chelmsford: | 3.9% (20,049) |
| State: | 4.4% (91,120) |
Number of households with income $10k - 20k:| Chelmsford: | 4.7% (24,440) |
| Massachusetts: | 5.9% (122,055) |
Number of households with income $20k - 30k:| Chelmsford: | 3.8% (19,723) |
| State: | 5.1% (105,311) |
Number of households with income $30k - 40k:| Chelmsford: | 4.2% (21,988) |
| State: | 5.3% (110,239) |
Number of households with income $40k - 50k:| Chelmsford: | 4.0% (20,884) |
| State: | 5.0% (104,636) |
Number of households with income $50k - 60k:| Chelmsford: | 4.3% (22,437) |
| State: | 4.8% (99,486) |
Number of households with income $60k - 75k:| Chelmsford: | 6.6% (34,193) |
| State: | 7.5% (155,124) |
Number of households with income $75k - 100k:| Chelmsford: | 10.1% (52,627) |
| Massachusetts: | 11.4% (236,252) |
Number of households with income $100k - 125k:| Chelmsford: | 8.8% (45,697) |
| State: | 9.9% (204,731) |
Number of households with income $125k - 150k:| Chelmsford: | 8.1% (42,206) |
| Massachusetts: | 8.5% (175,324) |
Number of households with income $150k - 200k:| Chelmsford: | 13.2% (68,802) |
| Massachusetts: | 11.7% (242,980) |
Number of households with income > $200k:| Chelmsford: | 28.2% (146,378) |
| State: | 20.5% (425,966) |
Aggregate household income in Chelmsford in 2022: $35,346,672,834
Median family income in Chelmsford in 2022:| Chelmsford: | $175,131 |
| Massachusetts: | $133,153 |
Number of families with income < $10k:| Chelmsford: | 1.3% (86) |
| State: | 2.0% (25,038) |
Number of families with income $10k - 20k:| Chelmsford: | 1.2% (78) |
| State: | 2.1% (26,403) |
Number of families with income $20k - 30k:| Chelmsford: | 1.3% (85) |
| State: | 2.6% (32,525) |
Number of families with income $30k - 40k:| Chelmsford: | 2.6% (168) |
| State: | 3.9% (48,079) |
Number of families with income $40k - 50k:| Chelmsford: | 3.8% (250) |
| State: | 3.8% (46,908) |
Number of families with income $50k - 60k:| Chelmsford: | 3.5% (230) |
| State: | 3.8% (46,476) |
Number of families with income $60k - 75k:| Chelmsford: | 5.8% (383) |
| State: | 6.4% (79,040) |
Number of families with income $75k - 100k:| Chelmsford: | 12.1% (799) |
| State: | 11.1% (137,395) |
Number of families with income $100k - 125k:| Chelmsford: | 14.4% (950) |
| State: | 11.1% (136,771) |
Number of families with income $125k - 150k:| Chelmsford: | 13.3% (873) |
| Massachusetts: | 10.0% (123,709) |
Number of families with income $150k - 200k:| Chelmsford: | 16.8% (1,105) |
| State: | 14.7% (181,602) |
Number of families with income > $200k:| Chelmsford: | 24.0% (1,579) |
| State: | 28.5% (351,887) |
Median non-family income in Chelmsford in 2022:| Chelmsford: | $61,917 |
| State: | $59,323 |
Change in median non-family income between 2000 and 2022:| Chelmsford, Massachusetts: | +90.7% |
| State: | +94.3% |
Median per capita income in Chelmsford in 2022:| Chelmsford: | $66,825 |
| State: | $60,804 |
Change in median per capita income between 2000 and 2022:| Chelmsford, Massachusetts: | +117.3% |
| State: | +118.7% |
Income statistics for Black or African American residents
Median household income in Chelmsford, MA in 2022:| Chelmsford: | $109,501 |
| State: | $63,189 |
Change in median household income between 2000 and 2022:| Chelmsford, Massachusetts: | +92.0% |
| State: | +87.4% |
Number of households with income < $10k:| Chelmsford: | 5.7% (2,069) |
| State: | 9.1% (15,797) |
Number of households with income $10k - 20k:| Chelmsford: | 7.1% (2,597) |
| State: | 9.4% (16,267) |
Number of households with income $20k - 30k:| Chelmsford: | 4.3% (1,578) |
| State: | 7.8% (13,520) |
Number of households with income $30k - 40k:| Chelmsford: | 6.4% (2,350) |
| State: | 8.3% (14,412) |
Number of households with income $40k - 50k:| Chelmsford: | 9.6% (3,494) |
| State: | 7.9% (13,790) |
Number of households with income $50k - 60k:| Chelmsford: | 5.7% (2,078) |
| State: | 5.8% (10,041) |
Number of households with income $60k - 75k:| Chelmsford: | 8.9% (3,256) |
| Massachusetts: | 8.5% (14,822) |
Number of households with income $75k - 100k:| Chelmsford: | 13.0% (4,741) |
| State: | 11.0% (19,122) |
Number of households with income $100k - 125k:| Chelmsford: | 8.1% (2,960) |
| State: | 8.4% (14,575) |
Number of households with income $125k - 150k:| Chelmsford: | 6.7% (2,452) |
| State: | 6.0% (10,429) |
Number of households with income $150k - 200k:| Chelmsford: | 11.2% (4,080) |
| State: | 7.2% (12,539) |
Number of households with income > $200k:| Chelmsford: | 13.3% (4,838) |
| State: | 10.5% (18,185) |
Aggregate household income in Chelmsford in 2022: $11,352,316
Median family income in Chelmsford in 2022:| Chelmsford: | $127,276 |
| State: | $79,815 |
Number of families with income $10k - 20k:| Chelmsford: | 5.3% (2) |
| State: | 6.8% (7,412) |
Number of families with income $20k - 30k:| Chelmsford: | 0.9% (0) |
| State: | 6.6% (7,274) |
Number of families with income $40k - 50k:| Chelmsford: | 20.5% (8) |
| State: | 7.9% (8,656) |
Number of families with income $60k - 75k:| Chelmsford: | 18.3% (7) |
| Massachusetts: | 7.9% (8,699) |
Number of families with income $75k - 100k:| Chelmsford: | 55.0% (21) |
| State: | 11.5% (12,654) |
Median non-family income in Chelmsford in 2022:| Chelmsford: | $97,790 |
| State: | $38,934 |
Change in median non-family income between 2000 and 2022:| Chelmsford, Massachusetts: | +71.5% |
| State: | +69.2% |
Median per capita income in Chelmsford in 2022:| Chelmsford: | $34,684 |
| Massachusetts: | $33,524 |
Change in median per capita income between 2000 and 2022:| Chelmsford, Massachusetts: | +98.1% |
| State: | +109.4% |
Income statistics for Asian residents
Median household income in Chelmsford, MA in 2022:| Chelmsford: | $185,240 |
| State: | $117,855 |
Change in median household income between 2000 and 2022:| Chelmsford, Massachusetts: | +108.1% |
| State: | +129.9% |
Number of households with income < $10k:| Chelmsford: | 6.0% (6,576) |
| Massachusetts: | 6.8% (11,982) |
Number of households with income $10k - 20k:| Chelmsford: | 3.1% (3,394) |
| State: | 4.8% (8,376) |
Number of households with income $20k - 30k:| Chelmsford: | 1.9% (2,128) |
| Massachusetts: | 3.7% (6,558) |
Number of households with income $30k - 40k:| Chelmsford: | 2.4% (2,618) |
| State: | 3.3% (5,748) |
Number of households with income $40k - 50k:| Chelmsford: | 4.4% (4,781) |
| State: | 4.1% (7,192) |
Number of households with income $50k - 60k:| Chelmsford: | 4.3% (4,720) |
| State: | 5.0% (8,734) |
Number of households with income $60k - 75k:| Chelmsford: | 4.5% (4,913) |
| State: | 5.8% (10,203) |
Number of households with income $75k - 100k:| Chelmsford: | 7.9% (8,681) |
| Massachusetts: | 8.6% (15,154) |
Number of households with income $100k - 125k:| Chelmsford: | 13.0% (14,234) |
| State: | 10.8% (18,942) |
Number of households with income $125k - 150k:| Chelmsford: | 8.3% (9,084) |
| State: | 8.0% (14,037) |
Number of households with income $150k - 200k:| Chelmsford: | 11.1% (12,156) |
| Massachusetts: | 12.5% (21,856) |
Number of households with income > $200k:| Chelmsford: | 32.9% (35,987) |
| Massachusetts: | 26.6% (46,694) |
Aggregate household income in Chelmsford in 2022: $306,470,361
Median family income in Chelmsford in 2022:| Chelmsford: | $222,065 |
| Massachusetts: | $140,113 |
Number of families with income $20k - 30k:| Chelmsford: | 1.2% (14) |
| State: | 2.3% (2,708) |
Number of families with income $30k - 40k:| Chelmsford: | 0.8% (9) |
| State: | 2.8% (3,234) |
Number of families with income $40k - 50k:| Chelmsford: | 1.3% (15) |
| Massachusetts: | 3.9% (4,621) |
Number of families with income $50k - 60k:| Chelmsford: | 1.8% (21) |
| State: | 3.9% (4,606) |
Number of families with income $60k - 75k:| Chelmsford: | 4.1% (47) |
| Massachusetts: | 6.1% (7,105) |
Number of families with income $75k - 100k:| Chelmsford: | 8.0% (92) |
| State: | 8.5% (10,022) |
Number of families with income $100k - 125k:| Chelmsford: | 28.6% (327) |
| Massachusetts: | 10.0% (11,697) |
Number of families with income $125k - 150k:| Chelmsford: | 6.0% (69) |
| State: | 8.6% (10,071) |
Number of families with income $150k - 200k:| Chelmsford: | 15.1% (173) |
| State: | 13.2% (15,478) |
Number of families with income > $200k:| Chelmsford: | 33.0% (378) |
| State: | 34.0% (39,856) |
Median non-family income in Chelmsford in 2022:| Chelmsford: | $158,477 |
| State: | $71,440 |
Change in median non-family income between 2000 and 2022:| Chelmsford, Massachusetts: | +119.9% |
| State: | +128.0% |
Median per capita income in Chelmsford in 2022:| Chelmsford: | $86,262 |
| State: | $58,900 |
Income statistics for Hispanic or Latino residents
Median household income in Chelmsford, MA in 2022:| Chelmsford: | $74,898 |
| State: | $61,523 |
Change in median household income between 2000 and 2022:| Chelmsford, Massachusetts: | +138.1% |
| Massachusetts: | +125.4% |
Number of households with income < $10k:| Chelmsford: | 6.6% (2,253) |
| State: | 8.8% (25,307) |
Number of households with income $10k - 20k:| Chelmsford: | 7.1% (2,408) |
| State: | 10.0% (28,653) |
Number of households with income $20k - 30k:| Chelmsford: | 6.0% (2,061) |
| State: | 8.8% (25,189) |
Number of households with income $30k - 40k:| Chelmsford: | 3.4% (1,155) |
| State: | 7.2% (20,822) |
Number of households with income $40k - 50k:| Chelmsford: | 6.4% (2,179) |
| State: | 7.2% (20,817) |
Number of households with income $50k - 60k:| Chelmsford: | 6.1% (2,096) |
| State: | 6.5% (18,748) |
Number of households with income $60k - 75k:| Chelmsford: | 6.3% (2,151) |
| State: | 8.8% (25,390) |
Number of households with income $75k - 100k:| Chelmsford: | 11.4% (3,901) |
| State: | 12.0% (34,488) |
Number of households with income $100k - 125k:| Chelmsford: | 10.6% (3,614) |
| State: | 8.6% (24,599) |
Number of households with income $125k - 150k:| Chelmsford: | 7.5% (2,558) |
| State: | 6.2% (17,743) |
Number of households with income $150k - 200k:| Chelmsford: | 11.4% (3,890) |
| State: | 7.3% (21,017) |
Number of households with income > $200k:| Chelmsford: | 17.2% (5,868) |
| State: | 8.6% (24,606) |
Aggregate household income in Chelmsford in 2022: $20,109,528
Median family income in Chelmsford in 2022:| Chelmsford: | $108,988 |
| Massachusetts: | $66,072 |
Number of families with income < $10k:| Chelmsford: | 2.5% (18) |
| Massachusetts: | 6.2% (12,456) |
Number of families with income $10k - 20k:| Chelmsford: | 2.7% (20) |
| State: | 6.0% (12,071) |
Number of families with income $20k - 30k:| Chelmsford: | 3.4% (25) |
| Massachusetts: | 10.1% (20,376) |
Number of families with income $30k - 40k:| Chelmsford: | 2.5% (19) |
| State: | 8.2% (16,470) |
Number of families with income $40k - 50k:| Chelmsford: | 7.1% (52) |
| Massachusetts: | 7.4% (14,829) |
Number of families with income $50k - 60k:| Chelmsford: | 8.3% (61) |
| State: | 7.3% (14,643) |
Number of families with income $60k - 75k:| Chelmsford: | 10.3% (76) |
| State: | 10.6% (21,252) |
Number of families with income $75k - 100k:| Chelmsford: | 16.1% (119) |
| State: | 12.0% (24,088) |
Number of families with income $100k - 125k:| Chelmsford: | 15.5% (115) |
| State: | 8.9% (17,954) |
Number of families with income $125k - 150k:| Chelmsford: | 10.0% (74) |
| State: | 6.9% (13,837) |
Number of families with income $150k - 200k:| Chelmsford: | 10.7% (79) |
| State: | 7.3% (14,683) |
Number of families with income > $200k:| Chelmsford: | 10.7% (79) |
| State: | 9.3% (18,741) |
Median non-family income in Chelmsford in 2022:| Chelmsford: | $43,335 |
| Massachusetts: | $37,563 |
Change in median non-family income between 2000 and 2022:| Chelmsford, Massachusetts: | +98.1% |
| State: | +115.0% |
Median per capita income in Chelmsford in 2022:| Chelmsford: | $35,886 |
| State: | $28,993 |
Change in median per capita income between 2000 and 2022:| Chelmsford, Massachusetts: | +142.9% |
| State: | +142.4% |
Income statistics for American Indian and Alaska Native residents
Number of households with income < $10k:| Chelmsford: | 6.5% (11) |
| State: | 6.6% (451) |
Number of households with income $10k - 20k:| Chelmsford: | 7.1% (12) |
| State: | 7.0% (476) |
Number of households with income $20k - 30k:| Chelmsford: | 2.4% (4) |
| State: | 2.8% (192) |
Number of households with income $30k - 40k:| Chelmsford: | 2.9% (5) |
| Massachusetts: | 3.2% (218) |
Number of households with income $40k - 50k:| Chelmsford: | 2.9% (5) |
| Massachusetts: | 2.9% (199) |
Number of households with income $50k - 60k:| Chelmsford: | 10.0% (17) |
| State: | 9.9% (677) |
Number of households with income $60k - 75k:| Chelmsford: | 11.8% (20) |
| State: | 11.5% (781) |
Number of households with income $75k - 100k:| Chelmsford: | 9.4% (16) |
| State: | 9.2% (629) |
Number of households with income $100k - 125k:| Chelmsford: | 5.9% (10) |
| State: | 6.0% (406) |
Number of households with income $125k - 150k:| Chelmsford: | 13.5% (23) |
| State: | 13.5% (921) |
Number of households with income $150k - 200k:| Chelmsford: | 12.9% (22) |
| Massachusetts: | 12.6% (859) |
Number of households with income > $200k:| Chelmsford: | 14.7% (25) |
| State: | 14.7% (1,003) |
Median per capita income in Chelmsford in 2022:| Chelmsford: | $1,382 |
| State: | $39,434 |
Income statistics for Multirace residents
Median household income in Chelmsford, MA in 2022:| Chelmsford: | $103,148 |
| State: | $71,552 |
Change in median household income between 2000 and 2022:| Chelmsford, Massachusetts: | +146.3% |
| State: | +109.0% |
Number of households with income < $10k:| Chelmsford: | 5.4% (2,452) |
| State: | 6.6% (15,127) |
Number of households with income $10k - 20k:| Chelmsford: | 6.0% (2,739) |
| Massachusetts: | 9.2% (21,158) |
Number of households with income $20k - 30k:| Chelmsford: | 2.8% (1,291) |
| Massachusetts: | 7.8% (18,016) |
Number of households with income $30k - 40k:| Chelmsford: | 6.0% (2,753) |
| Massachusetts: | 7.9% (18,260) |
Number of households with income $40k - 50k:| Chelmsford: | 4.1% (1,877) |
| Massachusetts: | 5.6% (13,027) |
Number of households with income $50k - 60k:| Chelmsford: | 5.9% (2,686) |
| State: | 5.6% (12,909) |
Number of households with income $60k - 75k:| Chelmsford: | 6.7% (3,027) |
| Massachusetts: | 9.0% (20,800) |
Number of households with income $75k - 100k:| Chelmsford: | 12.9% (5,889) |
| State: | 12.1% (27,875) |
Number of households with income $100k - 125k:| Chelmsford: | 10.7% (4,892) |
| Massachusetts: | 8.1% (18,754) |
Number of households with income $125k - 150k:| Chelmsford: | 6.4% (2,897) |
| State: | 6.8% (15,621) |
Number of households with income $150k - 200k:| Chelmsford: | 12.8% (5,837) |
| State: | 9.4% (21,618) |
Number of households with income > $200k:| Chelmsford: | 20.1% (9,168) |
| Massachusetts: | 12.0% (27,592) |
Aggregate household income in Chelmsford in 2022: $40,565,161
Median family income in Chelmsford in 2022:| Chelmsford: | $104,570 |
| State: | $78,380 |
Number of families with income $30k - 40k:| Chelmsford: | 23.7% (64) |
| State: | 8.2% (12,705) |
Number of families with income $40k - 50k:| Chelmsford: | 1.8% (5) |
| State: | 5.3% (8,255) |
Number of families with income $75k - 100k:| Chelmsford: | 17.4% (47) |
| Massachusetts: | 12.1% (18,758) |
Number of families with income $100k - 125k:| Chelmsford: | 14.1% (38) |
| State: | 7.9% (12,321) |
Number of families with income $150k - 200k:| Chelmsford: | 43.0% (116) |
| Massachusetts: | 10.3% (15,978) |
Median non-family income in Chelmsford in 2022:| Chelmsford: | $122,878 |
| Massachusetts: | $42,253 |
Median per capita income in Chelmsford in 2022:| Chelmsford: | $25,387 |
| Massachusetts: | $34,029 |
Change in median per capita income between 2000 and 2022:| Chelmsford, Massachusetts: | +116.4% |
| State: | +132.1% |
Income statistics for other residents
Aggregate household income in Chelmsford in 2022: $1,777,717
Median family income in Chelmsford in 2022:| Chelmsford: | $13,061 |
| Massachusetts: | $66,840 |
Number of families with income < $10k:| Chelmsford: | 100.0% (14) |
| Massachusetts: | 6.7% (6,769) |
Median non-family income in Chelmsford in 2022:| Chelmsford: | $65,894 |
| State: | $36,127 |
Change in median non-family income between 2000 and 2022:| Chelmsford, Massachusetts: | +81.8% |
| Massachusetts: | +123.4% |
Median per capita income in Chelmsford in 2022:| Chelmsford: | $37,815 |
| State: | $30,797 |