Cape Coral, FL (Florida) Houses and Residents
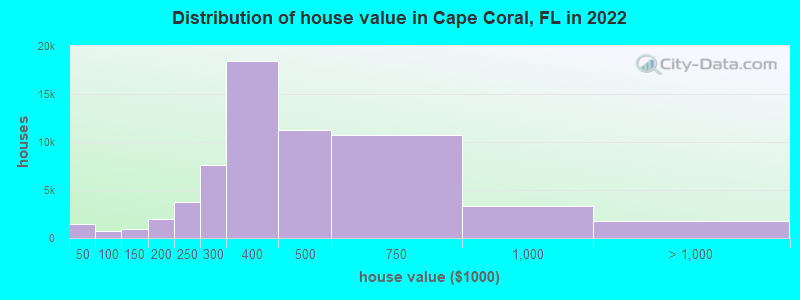
Estimated median house or condo value in 2022: $379,600 (it was $106,500 in 2000 )
Cape Coral:
$379,600Florida:
$354,100
Lower value quartile - upper value quartile: $294,700 - $510,700Mean price in 2022: Detached houses: $441,592 Here:
$441,592State:
$500,941
Townhouses or other attached units: $381,032 Here:
$381,032State:
$370,869
In 2-unit structures: $375,448 Here:
$375,448State:
$423,188
In 3-to-4-unit structures: $209,519 Here:
$209,519State:
$309,944
In 5-or-more-unit structures: $261,614 Here:
$261,614State:
$447,145
Mobile homes: $18,759 Here:
$18,759State:
$113,202
Total population: 169,854 (Urban population: 98,281, Rural population: 3,925 (all nonfarm) )
Houses: 99,811 (81,419 occupied: 61,786 owner occupied, 19,633 renter occupied )
% of renters here:
24%State:
33%
Housing density: 949 houses/condos per square mile
Median price asked for vacant for-sale houses and condos in 2022: $483,783.
Median contract rent in 2022: $1,595 (lower quartile is $1,259, upper quartile is $1,922)
Median rent asked for vacant for-rent units in 2022: $3,100
Median gross rent in Cape Coral, FL in 2022: $1,800
Housing units in Cape Coral with a mortgage: 39,487 (2,718 second mortgage, 85 home equity loan, 2,188 both second mortgage and home equity loan )Houses without a mortgage: 1,155
Median household income for houses/condos with a mortgage: $87,034
Median household income for apartments without a mortgage: $64,346
Median monthly housing costs: $1,468
Data:
Median house or condo value ($)
Median house or condo value ($ change since 2000)
Median house or condo value ($) - White
Median house or condo value ($) - Black or African American
Median house or condo value ($) - Asian
Median house or condo value ($) - Hispanic or Latino
Median house or condo value ($) - American Indian and Alaska Native
Median house or condo value ($) - Multirace
Median house or condo value ($) - Other Race
Median price asked for mobile homes ($)
Household density (households per square mile)
Mean house or condo value by units in structure - 1, detached ($)
Mean house or condo value by units in structure - 1, attached ($)
Mean house or condo value by units in structure - 2 ($)
Mean house or condo value by units in structure by units in structure - 3 or 4 ($)
Mean house or condo value by units in structure - 5 or more ($)
Mean house or condo value by units in structure - Boat, RV, van, etc. ($)
Mean house or condo value by units in structure - Mobile home ($)
Median contract rent ($)
Median contract rent - Lower quartile ($)
Median contract rent - Upper quartile ($)
Median gross rent ($)
Urban houses (%)
Rural houses (%)
Houses occupied (%)
Houses occupied (% change since 2000)
Houses owner occupied (%)
Houses owner occupied (% change since 2000)
Houses renter occupied (%)
Houses renter occupied (% change since 2000)
Vacant housing units - For rent (%)
Vacant housing units - For rent (% change since 2000)
Vacant housing units - For sale only (%)
Vacant housing units - For sale only (% change since 2000)
Vacant housing units - Rented or sold, not occupied (%)
Vacant housing units - Rented or sold, not occupied (% change since 2000)
Vacant housing units - For seasonal, recreational, or occasional use (%)
Vacant housing units - For seasonal, recreational, or occasional use (% change since 2000)
Vacant housing units - For migrant workers (%)
Vacant housing units - For migrant workers (% change since 2000)
Vacant housing units - Other vacant (%)
Vacant housing units - Other vacant (% change since 2000)
Median monthly housing costs ($)
Median household income for houses/condos with a mortgage ($)
Median household income for houses/condos without a mortgage ($)
Median household income ($)
Median household income ($) - White
Median household income ($) - Black or African American
Median household income ($) - Asian
Median household income ($) - Hispanic or Latino
Median household income ($) - American Indian and Alaska Native
Median household income ($) - Multirace
Median household income ($) - Other Race
Mortgage status - with mortgage (%)
Mortgage status - with second mortgage (%)
Mortgage status - with home equity loan (%)
Mortgage status - with both second mortgage and home equity loan (%)
Mortgage status - without a mortgage (%)
Median year house/condo built
Median year apartment built
Household type by relationship - Male householder living alone (%)
Household type by relationship - Male householder not living alone (%)
Household type by relationship - Female householder living alone (%)
Household type by relationship - Female householder not living alone (%)
Household type by relationship - Opposite-Sex spouse (%)
Household type by relationship - Same-Sex spouse (%)
Household type by relationship - Opposite-Sex unmarried partner (%)
Household type by relationship - Same-Sex unmarried partner (%)
Household type by relationship - In group quarters (%)
Size of family households - 2-person household (%)
Size of family households - 3-person household (%)
Size of family households - 4-person household (%)
Size of family households - 5-person household (%)
Size of family households - 6-person household (%)
Size of family households - 7-or-more-person household (%)
Size of nonfamily households - 1-person household (%)
Size of nonfamily households - 2-person household (%)
Size of nonfamily households - 3-person household (%)
Size of nonfamily households - 4-person household (%)
Size of nonfamily households - 5-person household (%)
Size of nonfamily households - 6-person household (%)
Size of nonfamily households - 7-or-moreperson household (%)
Year house built - Built 2010 or later (%)
Year house built - Built 2000 to 2009 (%)
Year house built - Built 1990 to 1999 (%)
Year house built - Built 1980 to 1989 (%)
Year house built - Built 1970 to 1979 (%)
Year house built - Built 1960 to 1969 (%)
Year house built - Built 1950 to 1959 (%)
Year house built - Built 1940 to 1949 (%)
Year house built - Built 1939 or earlier (%)
Median number of rooms in houses and condos
Median number of rooms in apartments
Median number of bedrooms in owner occupied houses
Mean number of bedrooms in owner occupied houses
Median number of bedrooms in renter occupied houses
Mean number of bedrooms in renter occupied houses
Median number of vehichles in owner occupied houses
Mean number of vehichles in owner occupied houses
Median number of vehichles in renter occupied houses
Mean number of vehichles in renter occupied houses
Rooms in owner-occupied houses - 1 room (%)
Rooms in owner-occupied houses - 2 rooms (%)
Rooms in owner-occupied houses - 3 rooms (%)
Rooms in owner-occupied houses - 4 rooms (%)
Rooms in owner-occupied houses - 5 rooms (%)
Rooms in owner-occupied houses - 6 rooms (%)
Rooms in owner-occupied houses - 7 rooms (%)
Rooms in owner-occupied houses - 8 rooms (%)
Rooms in owner-occupied houses - 9+ rooms (%)
Rooms in renter-occupied houses - 1 room (%)
Rooms in renter-occupied houses - 2 rooms (%)
Rooms in renter-occupied houses - 3 rooms (%)
Rooms in renter-occupied houses - 4 rooms (%)
Rooms in renter-occupied houses - 5 rooms (%)
Rooms in renter-occupied houses - 6 rooms (%)
Rooms in renter-occupied houses - 7 rooms (%)
Rooms in renter-occupied houses - 8 rooms (%)
Rooms in renter-occupied houses - 9+ rooms (%)
Bedrooms in owner-occupied houses - no bedrooms (%)
Bedrooms in owner-occupied houses - 1 bedroom (%)
Bedrooms in owner-occupied houses - 2 bedrooms (%)
Bedrooms in owner-occupied houses - 3 bedrooms (%)
Bedrooms in owner-occupied houses - 4 bedrooms (%)
Bedrooms in owner-occupied houses - 5+ bedrooms (%)
Bedrooms in renter-occupied houses - no bedrooms (%)
Bedrooms in renter-occupied houses - 1 bedroom (%)
Bedrooms in renter-occupied houses - 2 bedrooms (%)
Bedrooms in renter-occupied houses - 3 bedrooms (%)
Bedrooms in renter-occupied houses - 4 bedrooms (%)
Bedrooms in renter-occupied houses - 5+ bedrooms (%)
Vehicles available in owner-occupied houses - no vehicle available (%)
Vehicles available in owner-occupied houses - 1 vehicle available(%)
Vehicles available in owner-occupied houses - 2 Vehicles available (%)
Vehicles available in owner-occupied houses - 3 Vehicles available (%)
Vehicles available in owner-occupied houses - 4 Vehicles available (%)
Vehicles available in owner-occupied houses - 5+ Vehicles available (%)
Vehicles available in renter-occupied houses - no vehicle available (%)
Vehicles available in renter-occupied houses - 1 vehicle available (%)
Vehicles available in renter-occupied houses - 2 Vehicles available (%)
Vehicles available in renter-occupied houses - 3 Vehicles available (%)
Vehicles available in renter-occupied houses - 4 Vehicles available (%)
Vehicles available in renter-occupied houses - 5+ Vehicles available (%)
Housing units in structures - 1, detached (%)
Housing units in structures - 1, attached (%)
Housing units in structures - 2 (%)
Housing units in structures - 3 or 4 (%)
Housing units in structures - 5 to 9 (%)
Housing units in structures - 10 to 19 (%)
Housing units in structures - 20 to 49 (%)
Housing units in structures - 50 or more (%)
Housing units in structures - Mobile home (%)
Housing units in structures - Boat, RV, van, etc. (%)
Housing units in structures - Owners - 1, detached (%)
Housing units in structures - Owners - 1, attached (%)
Housing units in structures - Owners - 2 (%)
Housing units in structures - Owners - 3 or 4 (%)
Housing units in structures - Owners - 5 to 9 (%)
Housing units in structures - Owners - 10 to 19 (%)
Housing units in structures - Owners - 20 to 49 (%)
Housing units in structures - Owners - 50 or more (%)
Housing units in structures - Owners - Mobile home (%)
Housing units in structures - Owners - Boat, RV, van, etc. (%)
Housing units in structures - Renters - 1, detached (%)
Housing units in structures - Renters - 1, attached (%)
Housing units in structures - Renters - 2 (%)
Housing units in structures - Renters - 3 or 4 (%)
Housing units in structures - Renters - 5 to 9 (%)
Housing units in structures - Renters - 10 to 19 (%)
Housing units in structures - Renters - 20 to 49 (%)
Housing units in structures - Renters - 50 or more (%)
Housing units in structures - Renters - Mobile home (%)
Housing units in structures - Renters - Boat, RV, van, etc. (%)
House/condo owner moved in on average (years ago)
Renter moved in on average (years ago)
Year householder moved into unit - Moved in 1999 to March 2000 (%)
Year householder moved into unit - Moved in 1999 to March 2000 (%) - White
Year householder moved into unit - Moved in 1999 to March 2000 (%) - Black or African American
Year householder moved into unit - Moved in 1999 to March 2000 (%) - Asian
Year householder moved into unit - Moved in 1999 to March 2000 (%) - Hispanic or Latino
Year householder moved into unit - Moved in 1999 to March 2000 (%) - American Indian and Alaska Native
Year householder moved into unit - Moved in 1999 to March 2000 (%) - Multirace
Year householder moved into unit - Moved in 1999 to March 2000 (%) - Other Race
Year householder moved into unit - Moved in 1995 to 1998 (%)
Year householder moved into unit - Moved in 1995 to 1998 (%) - White
Year householder moved into unit - Moved in 1995 to 1998 (%) - Black or African American
Year householder moved into unit - Moved in 1995 to 1998 (%) - Asian
Year householder moved into unit - Moved in 1995 to 1998 (%) - Hispanic or Latino
Year householder moved into unit - Moved in 1995 to 1998 (%) - American Indian and Alaska Native
Year householder moved into unit - Moved in 1995 to 1998 (%) - Multirace
Year householder moved into unit - Moved in 1995 to 1998 (%) - Other Race
Year householder moved into unit - Moved in 1990 to 1994 (%)
Year householder moved into unit - Moved in 1990 to 1994 (%) - White
Year householder moved into unit - Moved in 1990 to 1994 (%) - Black or African American
Year householder moved into unit - Moved in 1990 to 1994 (%) - Asian
Year householder moved into unit - Moved in 1990 to 1994 (%) - Hispanic or Latino
Year householder moved into unit - Moved in 1990 to 1994 (%) - American Indian and Alaska Native
Year householder moved into unit - Moved in 1990 to 1994 (%) - Multirace
Year householder moved into unit - Moved in 1990 to 1994 (%) - Other Race
Year householder moved into unit - Moved in 1980 to 1989 (%)
Year householder moved into unit - Moved in 1980 to 1989 (%) - White
Year householder moved into unit - Moved in 1980 to 1989 (%) - Black or African American
Year householder moved into unit - Moved in 1980 to 1989 (%) - Asian
Year householder moved into unit - Moved in 1980 to 1989 (%) - Hispanic or Latino
Year householder moved into unit - Moved in 1980 to 1989 (%) - American Indian and Alaska Native
Year householder moved into unit - Moved in 1980 to 1989 (%) - Multirace
Year householder moved into unit - Moved in 1980 to 1989 (%) - Other Race
Year householder moved into unit - Moved in 1970 to 1979 (%)
Year householder moved into unit - Moved in 1970 to 1979 (%) - White
Year householder moved into unit - Moved in 1970 to 1979 (%) - Black or African American
Year householder moved into unit - Moved in 1970 to 1979 (%) - Asian
Year householder moved into unit - Moved in 1970 to 1979 (%) - Hispanic or Latino
Year householder moved into unit - Moved in 1970 to 1979 (%) - American Indian and Alaska Native
Year householder moved into unit - Moved in 1970 to 1979 (%) - Multirace
Year householder moved into unit - Moved in 1970 to 1979 (%) - Other Race
Year householder moved into unit - Moved in 1969 or earlier (%)
Year householder moved into unit - Moved in 1969 or earlier (%) - White
Year householder moved into unit - Moved in 1969 or earlier (%) - Black or African American
Year householder moved into unit - Moved in 1969 or earlier (%) - Asian
Year householder moved into unit - Moved in 1969 or earlier (%) - Hispanic or Latino
Year householder moved into unit - Moved in 1969 or earlier (%) - American Indian and Alaska Native
Year householder moved into unit - Moved in 1969 or earlier (%) - Multirace
Year householder moved into unit - Moved in 1969 or earlier (%) - Other Race
Housing units lacking complete plumbing facilities (%)
Housing units lacking complete kitchen facilities (%)
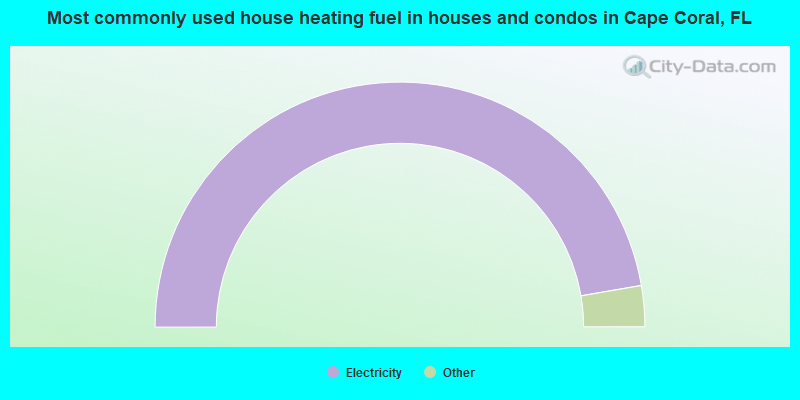
House heating fuel used in houses and condos - Utility gas (%)
House heating fuel used in houses and condos - Bottled, tank, or LP gas (%)
House heating fuel used in houses and condos - Electricity (%)
House heating fuel used in houses and condos - Fuel oil, kerosene, etc. (%)
House heating fuel used in houses and condos - Coal or coke (%)
House heating fuel used in houses and condos - Wood (%)
House heating fuel used in houses and condos - Solar energy (%)
House heating fuel used in houses and condos - Other fuel (%)
House heating fuel used in houses and condos - No fuel used (%)
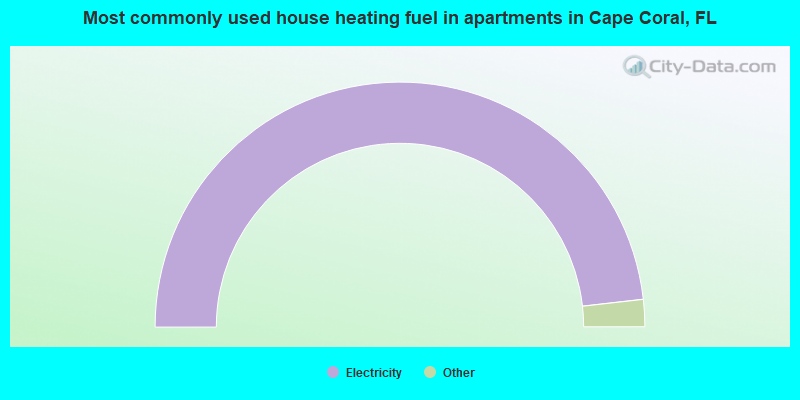
House heating fuel used in apartments - Utility gas (%)
House heating fuel used in apartments - Bottled, tank, or LP gas (%)
House heating fuel used in apartments - Electricity (%)
House heating fuel used in apartments - Fuel oil, kerosene, etc. (%)
House heating fuel used in apartments - Coal or coke (%)
House heating fuel used in apartments - Wood (%)
House heating fuel used in apartments - Solar energy (%)
House heating fuel used in apartments - Other fuel (%)
House heating fuel used in apartments - No fuel used (%)
Median year house/condo built: 2000Median year apartment built: 1996Household type by relationship:
Households: 216,984
Male householders: 38,069 (7,178 living alone ), Female householders: 43,350 (8,337 living alone )44,740 spouses (44,374 opposite-sex spouses ), 8,164 unmarried partners , (7,795 opposite-sex unmarried partners ), 59,317 children (53,378 natural , 1,889 adopted , 4,050 stepchildren ), 7,278 grandchildren , 1,342 brothers or sisters , 3,617 parents , 0 foster children , 2,938 other relatives , 7,186 non-relatives In group quarters: 983
Size of family households: 33,410 2-persons , 10,577 3-persons , 7,895 4-persons , 4,630 5-persons , 1,053 6-persons , 835 7-or-more-persons .
Size of nonfamily households: 15,515 1-person , 6,693 2-persons , 407 3-persons , 404 4-persons .
24,969 married couples with children. single-parent households (1,701 men , 8,769 women ).
75.1% of residents of Cape Coral speak English at home. of residents speak Spanish at home (51% speak English very well , 22% speak English well , 16% speak English not well , 11% don't speak English at all ).of residents speak other Indo-European language at home (69% speak English very well , 18% speak English well , 8% speak English not well , 5% don't speak English at all ).of residents speak Asian or Pacific Island language at home (57% speak English very well , 31% speak English well , 10% speak English not well , 1% don't speak English at all ).of residents speak other language at home (84% speak English very well , 16% speak English well ).
Foreign born population: 31,781 (14.6%)of them are naturalized citizens )
Median number of rooms in houses and condos:
Median number of rooms in apartments
Owner-occupied Renter-occupied
Rooms in owner-occupied houses in Cape Coral, Florida
0 1 room 309 2 rooms 1,884 3 rooms 5,087 4 rooms 18,598 5 rooms 15,971 6 rooms 10,794 7 rooms 5,421 8 rooms 3,722 9+ rooms
Rooms in renter-occupied apartments in Cape Coral, Florida
740 1 room 623 2 rooms 1,641 3 rooms 4,820 4 rooms 6,160 5 rooms 2,157 6 rooms 1,643 7 rooms 1,361 8 rooms 488 9+ rooms
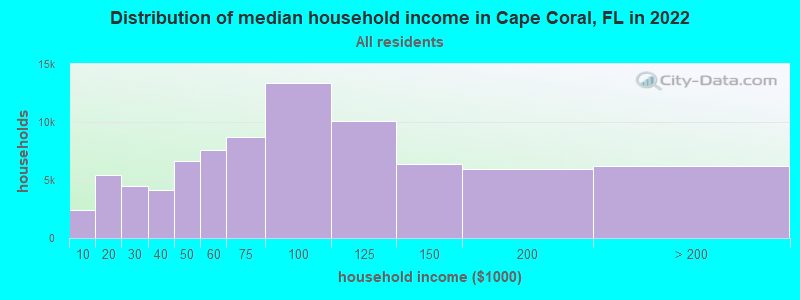
Cape Coral, FL household income distribution 2,372 Less than $10,0005,405 $10,000 to $19,9994,522 $20,000 to $29,9994,155 $30,000 to $39,9996,595 $40,000 to $49,9997,580 $50,000 to $59,9998,741 $60,000 to $74,99913,380 $75,000 to $99,99910,121 $100,000 to $124,9996,357 $125,000 to $149,9995,960 $150,000 to $199,9996,231 $200,000 or more
Home value of owner - occupied houses in 2022 in Cape Coral, FL 298 Less than $10,00080 $10,000 to $14,99970 $15,000 to $19,99947 $20,000 to $24,999200 $25,000 to $29,999510 $30,000 to $34,999145 $35,000 to $39,99980 $40,000 to $49,999151 $50,000 to $59,99940 $70,000 to $79,999200 $80,000 to $89,999240 $90,000 to $99,999519 $100,000 to $124,999373 $125,000 to $149,9991,005 $150,000 to $174,999955 $175,000 to $199,9993,765 $200,000 to $249,9997,574 $250,000 to $299,99918,389 $300,000 to $399,99911,237 $400,000 to $499,99910,737 $500,000 to $749,9993,349 $750,000 to $999,9991,337 $1,000,000 to $1,499,999210 $1,500,000 to $1,999,999275 $2,000,000 or moreRent paid by renters in 2022 in Cape Coral, FL 87 $100 to $14922 $150 to $19923 $200 to $24923 $250 to $29996 $400 to $44910 $450 to $49937 $550 to $599224 $600 to $64938 $650 to $699134 $700 to $749414 $750 to $799236 $800 to $899702 $900 to $9992,584 $1,000 to $1,2494,142 $1,250 to $1,4997,608 $1,500 to $1,9991,471 $2,000 to $2,499219 $2,500 to $2,999153 $3,000 to $3,499391 $3,500 or more704 No cash rent
Percentage of workers working in this county: 94.2%Number of people working at home: 14,596 (14.7% of all workers )
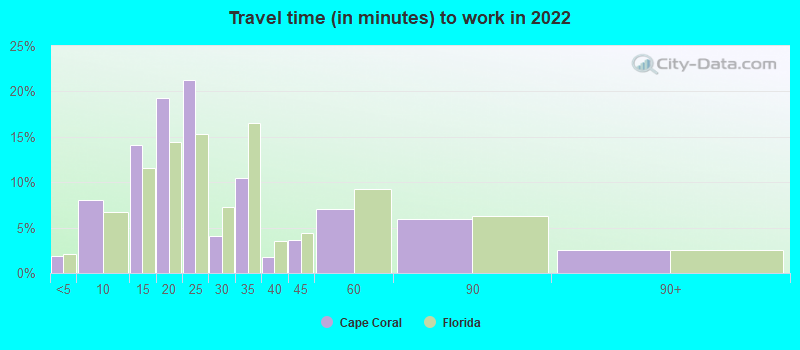
Travel time to work (commute)
Less than 5 minutes: 1,5425 to 9 minutes: 4,90510 to 14 minutes: 8,56015 to 19 minutes: 12,39220 to 24 minutes: 15,87825 to 29 minutes: 4,68530 to 34 minutes: 12,65035 to 39 minutes: 3,37840 to 44 minutes: 5,11845 to 59 minutes: 8,60260 to 89 minutes: 6,28990 or more minutes: 3,023
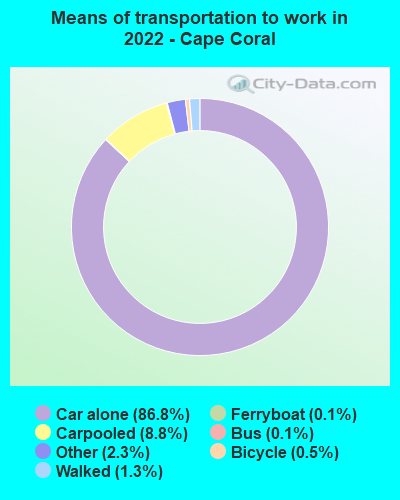
Means of transportation to work:
Drove a car alone: 38,610 (66.1%)Carpooled: 4,807 (8.2%)Bus : 72 (0.1%)Ferryboat: 47 (0.1%)Taxi: 703 (1.2%)Bicycle: 146 (0.2%)Walked: 642 (1.1%)Worked at home: 14,596 (25.0%)
Unemployment by race in 2022
Unemployment rate for White non-Hispanic residents 0.7% Males3.7% FemalesUnemployment rate for Black residents 4.2% FemalesUnemployment rate for American Indian and Alaska Native residents 73.8% MalesUnemployment rate for Asian residents 8.0% Males4.1% FemalesUnemployment rate for other race residents 7.3% Males5.5% FemalesUnemployment rate for two or more race residents 8.8% Males0.5% FemalesUnemployment rate for Hispanic or Latino residents 9.5% Males4.7% Females
Year of entry for the foreign-born population in Cape Coral, Florida
12,897 2010 or later 9,024 2000 to 2009 6,496 1990 to 1999 1,755 1980 to 1989 1,131 1970 to 1979 3,426 Before 1970
First ancestries reported:
American: 20,111 (18.2%)
German: 11,003 (9.9%)
Italian: 8,310 (7.5%)
Irish: 7,019 (6.3%)
English: 5,893 (5.3%)
Polish: 2,484 (2.2%)
European: 1,463 (1.3%)
Haitian: 1,063 (1.0%)
French: 821 (0.7%)
Norwegian: 707 (0.6%)
Jamaican: 680 (0.6%)
Canadian: 624 (0.6%)
French Canadian: 615 (0.6%)
Scottish: 615 (0.6%)
Swedish: 602 (0.5%)
Brazilian: 536 (0.5%)
Portuguese: 511 (0.5%)
Hungarian: 503 (0.5%)
British: 478 (0.4%)
Dutch: 449 (0.4%)
Scotch-Irish: 430 (0.4%)
African: 403 (0.4%)
Czech: 385 (0.3%)
Russian: 375 (0.3%)
Greek: 288 (0.3%)
Eastern European: 270 (0.2%)
Ukrainian: 256 (0.2%)
Slovak: 225 (0.2%)
Lebanese: 221 (0.2%)
Lithuanian: 209 (0.2%)
Romanian: 209 (0.2%)
Scandinavian: 200 (0.2%)
Yugoslavian: 168 (0.2%)
Swiss: 166 (0.1%)
Welsh: 156 (0.1%)
British West Indian: 123 (0.1%)
Trinidadian and Tobagonian: 116 (0.1%)
Croatian: 109 (0.10%)
Belgian: 103 (0.09%)
Danish: 82 (0.07%)
Czechoslovakian: 81 (0.07%)
Slovene: 64 (0.06%)
Slavic: 63 (0.06%)
Armenian: 61 (0.06%)
Finnish: 60 (0.05%)
Austrian: 51 (0.05%)
Israeli: 49 (0.04%)
Turkish: 42 (0.04%)
Egyptian: 39 (0.04%)
Moroccan: 37 (0.03%)
Pennsylvania German: 16 (0.01%)
Iranian: 16 (0.01%)
Belizean: 16 (0.01%)
Icelander: 15 (0.01%)
Arab: 14 (0.01%)
Bulgarian: 12 (0.01%)
Serbian: 10 (0.01%)
Latvian: 10 (0.01%)
Northern European: 9 (0.01%)
Syrian: 7 (0.01%)
Most common places of birth for foreign-born residents (%): Cuba Cape Coral:
36.5% (13,203)Florida:
22.0% (1,006,576)
Colombia Cape Coral:
6.9% (2,481)Florida:
6.5% (298,669)
Dominican Republic Cape Coral:
5.3% (1,900)Florida:
3.0% (137,727)
Philippines Cape Coral:
3.5% (1,280)Florida:
1.8% (84,403)
Germany Cape Coral:
3.2% (1,155)Florida:
1.2% (54,272)
Canada Cape Coral:
3.1% (1,132)Florida:
2.4% (109,132)
Brazil Cape Coral:
2.8% (1,031)Florida:
2.7% (122,906)
Honduras Cape Coral:
2.7% (983)Florida:
2.3% (107,160)
Mexico Cape Coral:
2.6% (952)Florida:
5.6% (257,152)
Jamaica Cape Coral:
2.5% (907)Florida:
5.0% (227,319)
Peru Cape Coral:
2.4% (858)Florida:
2.1% (96,693)
Venezuela Cape Coral:
2.4% (857)Florida:
5.7% (262,042)
Nicaragua Cape Coral:
1.7% (630)Florida:
2.3% (105,066)
China, excluding Hong Kong and Taiwan Cape Coral:
1.5% (555)Florida:
1.2% (56,071)
Haiti Cape Coral:
1.5% (548)Florida:
7.5% (342,375)
Place of birth for U.S.-born residents:
This state: 58,093Other state: 123,467Northeast: 56,342Midwest: 43,474South: 17,394West: 6,257 87.2% of Cape Coral residents lived in the same house 1 years ago.
Out of people who lived in different houses, 32.0% lived in this county.
Out of people who lived in different counties, 23.6% lived in Florida.
Cape Coral:
87.2%State average:
86.3%
Education attainment for males 25 years and older:
No schooling: 748Nursery to 4th grade: 05th and 6th grade: 1917th and 8th grade: 8479th grade: 45310th grade: 74511th grade: 1,01612th grade, no diploma: 2,467High school graduate (or equivalency): 28,349Less than 1 year of college: 8,659Some college more than 1 year, no degree: 9,473Associate degree: 7,665Bachelor's degree: 12,720Master's degree: 4,512Professional school degree: 1,968Doctorate degree: 989
Education attainment for females 25 years and older:
No schooling: 546Nursery to 4th grade: 2365th and 6th grade: 2387th and 8th grade: 2219th grade: 1,35610th grade: 31311th grade: 52012th grade, no diploma: 2,251High school graduate (or equivalency): 23,351Less than 1 year of college: 7,789Some college more than 1 year, no degree: 9,315Associate degree: 12,134Bachelor's degree: 15,861Master's degree: 5,866Professional school degree: 1,046Doctorate degree: 431
Housing units in structures:
One, detached: 78,788One, attached: 3,268Two: 2,3273 or 4: 2,3895 to 9: 2,97710 to 19: 4,56720 to 49: 2,87250 or more: 1,376Mobile homes: 1,247Median worth of mobile homes: $133,101
Housing units lacking complete plumbing facilities in 2022: 0.1%Housing units lacking complete kitchen facilities in 2022: 0.7%House/condo owner moved in on average 6 years ago
Renter moved in on average 2 years ago
Private vs. public school enrollment:
Students in private schools in grades 1 to 8 (elementary and middle school): 858 Students in private schools in grades 9 to 12 (high school): 969 Students in private undergraduate colleges: 1,215