Races in Cape Coral, Florida (FL) Detailed Stats
Data:
Races - White alone (%)
Races - White alone (% change since 2000)
Races - Black alone (%)
Races - Black alone (% change since 2000)
Races - American Indian alone (%)
Races - American Indian alone (% change since 2000)
Races - Asian alone (%)
Races - Asian alone (% change since 2000)
Races - Hispanic (%)
Races - Hispanic (% change since 2000)
Races - Native Hawaiian and Other Pacific Islander alone (%)
Races - Native Hawaiian and Other Pacific Islander alone (% change since 2000)
Races - Two or more races(%)
Races - Two or more races(% change since 2000)
Races - Other race alone (%)
Races - Other race alone (% change since 2000)
Racial diversity
Place of birth - Born in state of residence (%)
Place of birth - Born in state of residence (%) - White
Place of birth - Born in state of residence (%) - Black or African American
Place of birth - Born in state of residence (%) - Asian
Place of birth - Born in state of residence (%) - Hispanic or Latino
Place of birth - Born in state of residence (%) - American Indian and Alaska Native
Place of birth - Born in state of residence (%) - Multirace
Place of birth - Born in state of residence (%) - Other Race
Place of birth - Born in other state (%)
Place of birth - Born in other state (%) - White
Place of birth - Born in other state (%) - Black or African American
Place of birth - Born in other state (%) - Asian
Place of birth - Born in other state (%) - Hispanic or Latino
Place of birth - Born in other state (%) - American Indian and Alaska Native
Place of birth - Born in other state (%) - Multirace
Place of birth - Born in other state (%) - Other Race
Place of birth - Native, outside of US (%)
Place of birth - Native, outside of US (%) - White
Place of birth - Native, outside of US (%) - Black or African American
Place of birth - Native, outside of US (%) - Asian
Place of birth - Native, outside of US (%) - Hispanic or Latino
Place of birth - Native, outside of US (%) - American Indian and Alaska Native
Place of birth - Native, outside of US (%) - Multirace
Place of birth - Native, outside of US (%) - Other Race
Place of birth - Foreign born (%)
Place of birth - Foreign born (%) - White
Place of birth - Foreign born (%) - Black or African American
Place of birth - Foreign born (%) - Asian
Place of birth - Foreign born (%) - Hispanic or Latino
Place of birth - Foreign born (%) - American Indian and Alaska Native
Place of birth - Foreign born (%) - Multirace
Place of birth - Foreign born (%) - Other Race
Residents speaking English at home (%)
Residents speaking English at home - Born in the United States (%)
Residents speaking English at home - Native, born elsewhere (%)
Residents speaking English at home - Foreign born (%)
Residents speaking Spanish at home (%)
Residents speaking Spanish at home - Born in the United States (%)
Residents speaking Spanish at home - Native, born elsewhere (%)
Residents speaking Spanish at home - Foreign born (%)
Residents speaking other language at home (%)
Residents speaking other language at home - Born in the United States (%)
Residents speaking other language at home - Native, born elsewhere (%)
Residents speaking other language at home - Foreign born (%)
Marital status - Never married (%)
Marital status - Now married (%)
Marital status - Separated (%)
Marital status - Widowed (%)
Marital status - Divorced (%)
Ancestries Reported - Arab (%)
Ancestries Reported - Czech (%)
Ancestries Reported - Danish (%)
Ancestries Reported - Dutch (%)
Ancestries Reported - English (%)
Ancestries Reported - French (%)
Ancestries Reported - French Canadian (%)
Ancestries Reported - German (%)
Ancestries Reported - Greek (%)
Ancestries Reported - Hungarian (%)
Ancestries Reported - Irish (%)
Ancestries Reported - Italian (%)
Ancestries Reported - Lithuanian (%)
Ancestries Reported - Norwegian (%)
Ancestries Reported - Polish (%)
Ancestries Reported - Portuguese (%)
Ancestries Reported - Russian (%)
Ancestries Reported - Scotch-Irish (%)
Ancestries Reported - Scottish (%)
Ancestries Reported - Slovak (%)
Ancestries Reported - Subsaharan African (%)
Ancestries Reported - Swedish (%)
Ancestries Reported - Swiss (%)
Ancestries Reported - Ukrainian (%)
Ancestries Reported - United States (%)
Ancestries Reported - Welsh (%)
Ancestries Reported - West Indian (%)
Ancestries Reported - Other (%)
Geographical mobility - Same house 1 year ago (%)
Geographical mobility - Same house 1 year ago (%) - White
Geographical mobility - Same house 1 year ago (%) - Black or African American
Geographical mobility - Same house 1 year ago (%) - Asian
Geographical mobility - Same house 1 year ago (%) - Hispanic or Latino
Geographical mobility - Same house 1 year ago (%) - American Indian and Alaska Native
Geographical mobility - Same house 1 year ago (%) - Multirace
Geographical mobility - Same house 1 year ago (%) - Other Race
Geographical mobility - Moved within same county (%)
Geographical mobility - Moved within same county (%) - White
Geographical mobility - Moved within same county (%) - Black or African American
Geographical mobility - Moved within same county (%) - Asian
Geographical mobility - Moved within same county (%) - Hispanic or Latino
Geographical mobility - Moved within same county (%) - American Indian and Alaska Native
Geographical mobility - Moved within same county (%) - Multirace
Geographical mobility - Moved within same county (%) - Other Race
Geographical mobility - Moved from different county within same state (%)
Geographical mobility - Moved from different county within same state (%) - White
Geographical mobility - Moved from different county within same state (%) - Black or African American
Geographical mobility - Moved from different county within same state (%) - Asian
Geographical mobility - Moved from different county within same state (%) - Hispanic or Latino
Geographical mobility - Moved from different county within same state (%) - American Indian and Alaska Native
Geographical mobility - Moved from different county within same state (%) - Multirace
Geographical mobility - Moved from different county within same state (%) - Other Race
Geographical mobility - Moved from different state (%)
Geographical mobility - Moved from different state (%) - White
Geographical mobility - Moved from different state (%) - Black or African American
Geographical mobility - Moved from different state (%) - Asian
Geographical mobility - Moved from different state (%) - Hispanic or Latino
Geographical mobility - Moved from different state (%) - American Indian and Alaska Native
Geographical mobility - Moved from different state (%) - Multirace
Geographical mobility - Moved from different state (%) - Other Race
Geographical mobility - Moved from abroad (%)
Geographical mobility - Moved from abroad (%) - White
Geographical mobility - Moved from abroad (%) - Black or African American
Geographical mobility - Moved from abroad (%) - Asian
Geographical mobility - Moved from abroad (%) - Hispanic or Latino
Geographical mobility - Moved from abroad (%) - American Indian and Alaska Native
Geographical mobility - Moved from abroad (%) - Multirace
Geographical mobility - Moved from abroad (%) - Other Race
Place of birth for the foreign-born population - Ireland (%)
Place of birth for the foreign-born population - Denmark (%)
Place of birth for the foreign-born population - Norway (%)
Place of birth for the foreign-born population - Sweden (%)
Place of birth for the foreign-born population - United Kingdom (%)
Place of birth for the foreign-born population - England (%)
Place of birth for the foreign-born population - Scotland (%)
Place of birth for the foreign-born population - Other Northern Europe (%)
Place of birth for the foreign-born population - Austria (%)
Place of birth for the foreign-born population - Belgium (%)
Place of birth for the foreign-born population - France (%)
Place of birth for the foreign-born population - Germany (%)
Place of birth for the foreign-born population - Netherlands (%)
Place of birth for the foreign-born population - Switzerland (%)
Place of birth for the foreign-born population - Other Western Europe (%)
Place of birth for the foreign-born population - Greece (%)
Place of birth for the foreign-born population - Italy (%)
Place of birth for the foreign-born population - Portugal (%)
Place of birth for the foreign-born population - Spain (%)
Place of birth for the foreign-born population - Other Southern Europe (%)
Place of birth for the foreign-born population - Albania (%)
Place of birth for the foreign-born population - Belarus (%)
Place of birth for the foreign-born population - Bosnia and Herzegovina (%)
Place of birth for the foreign-born population - Bulgaria (%)
Place of birth for the foreign-born population - Croatia (%)
Place of birth for the foreign-born population - Czechoslovakia (%)
Place of birth for the foreign-born population - Hungary (%)
Place of birth for the foreign-born population - Latvia (%)
Place of birth for the foreign-born population - Lithuania (%)
Place of birth for the foreign-born population - North Macedonia (Macedonia) (%)
Place of birth for the foreign-born population - Moldova (%)
Place of birth for the foreign-born population - Poland (%)
Place of birth for the foreign-born population - Romania (%)
Place of birth for the foreign-born population - Russia (%)
Place of birth for the foreign-born population - Serbia (%)
Place of birth for the foreign-born population - Ukraine (%)
Place of birth for the foreign-born population - Other Eastern Europe (%)
Place of birth for the foreign-born population - China (%)
Place of birth for the foreign-born population - Hong Kong (%)
Place of birth for the foreign-born population - Taiwan (%)
Place of birth for the foreign-born population - Japan (%)
Place of birth for the foreign-born population - Korea (%)
Place of birth for the foreign-born population - Other Eastern Asia (%)
Place of birth for the foreign-born population - Afghanistan (%)
Place of birth for the foreign-born population - Bangladesh (%)
Place of birth for the foreign-born population - India (%)
Place of birth for the foreign-born population - Iran (%)
Place of birth for the foreign-born population - Kazakhstan (%)
Place of birth for the foreign-born population - Nepal (%)
Place of birth for the foreign-born population - Pakistan (%)
Place of birth for the foreign-born population - Sri Lanka (%)
Place of birth for the foreign-born population - Uzbekistan (%)
Place of birth for the foreign-born population - Other South Central Asia (%)
Place of birth for the foreign-born population - Burma (%)
Place of birth for the foreign-born population - Cambodia (%)
Place of birth for the foreign-born population - Indonesia (%)
Place of birth for the foreign-born population - Laos (%)
Place of birth for the foreign-born population - Malaysia (%)
Place of birth for the foreign-born population - Philippines (%)
Place of birth for the foreign-born population - Singapore (%)
Place of birth for the foreign-born population - Thailand (%)
Place of birth for the foreign-born population - Vietnam (%)
Place of birth for the foreign-born population - Other South Eastern Asia (%)
Place of birth for the foreign-born population - Armenia (%)
Place of birth for the foreign-born population - Iraq (%)
Place of birth for the foreign-born population - Israel (%)
Place of birth for the foreign-born population - Jordan (%)
Place of birth for the foreign-born population - Kuwait (%)
Place of birth for the foreign-born population - Lebanon (%)
Place of birth for the foreign-born population - Saudi Arabia (%)
Place of birth for the foreign-born population - Syria (%)
Place of birth for the foreign-born population - Turkey (%)
Place of birth for the foreign-born population - Yemen (%)
Place of birth for the foreign-born population - Other Western Asia (%)
Place of birth for the foreign-born population - Eritrea (%)
Place of birth for the foreign-born population - Ethiopia (%)
Place of birth for the foreign-born population - Kenya (%)
Place of birth for the foreign-born population - Somalia (%)
Place of birth for the foreign-born population - Uganda (%)
Place of birth for the foreign-born population - Zimbabwe (%)
Place of birth for the foreign-born population - Other Eastern Africa (%)
Place of birth for the foreign-born population - Cameroon (%)
Place of birth for the foreign-born population - Congo (%)
Place of birth for the foreign-born population - Democratic Republic of Congo (Zaire) (%)
Place of birth for the foreign-born population - Other Middle Africa (%)
Place of birth for the foreign-born population - Egypt (%)
Place of birth for the foreign-born population - Morocco (%)
Place of birth for the foreign-born population - Sudan (%)
Place of birth for the foreign-born population - Other Northern Africa (%)
Place of birth for the foreign-born population - South Africa (%)
Place of birth for the foreign-born population - Other Southern Africa (%)
Place of birth for the foreign-born population - Cabo Verde (%)
Place of birth for the foreign-born population - Ghana (%)
Place of birth for the foreign-born population - Liberia (%)
Place of birth for the foreign-born population - Nigeria (%)
Place of birth for the foreign-born population - Senegal (%)
Place of birth for the foreign-born population - Sierra Leone (%)
Place of birth for the foreign-born population - Other Western Africa (%)
Place of birth for the foreign-born population - Australia (%)
Place of birth for the foreign-born population - New Zealand (%)
Place of birth for the foreign-born population - Fiji (%)
Place of birth for the foreign-born population - Micronesia (%)
Place of birth for the foreign-born population - Bahamas (%)
Place of birth for the foreign-born population - Barbados (%)
Place of birth for the foreign-born population - Cuba (%)
Place of birth for the foreign-born population - Dominica (%)
Place of birth for the foreign-born population - Dominican Republic (%)
Place of birth for the foreign-born population - Grenada (%)
Place of birth for the foreign-born population - Haiti (%)
Place of birth for the foreign-born population - Jamaica (%)
Place of birth for the foreign-born population - St. Vincent and the Grenadines (%)
Place of birth for the foreign-born population - Trinidad and Tobago (%)
Place of birth for the foreign-born population - West Indies (%)
Place of birth for the foreign-born population - Other Caribbean (%)
Place of birth for the foreign-born population - Belize (%)
Place of birth for the foreign-born population - Costa Rica (%)
Place of birth for the foreign-born population - El Salvador (%)
Place of birth for the foreign-born population - Guatemala (%)
Place of birth for the foreign-born population - Honduras (%)
Place of birth for the foreign-born population - Mexico (%)
Place of birth for the foreign-born population - Nicaragua (%)
Place of birth for the foreign-born population - Panama (%)
Place of birth for the foreign-born population - Other Central America (%)
Place of birth for the foreign-born population - Argentina (%)
Place of birth for the foreign-born population - Bolivia (%)
Place of birth for the foreign-born population - Brazil (%)
Place of birth for the foreign-born population - Chile (%)
Place of birth for the foreign-born population - Colombia (%)
Place of birth for the foreign-born population - Ecuador (%)
Place of birth for the foreign-born population - Guyana (%)
Place of birth for the foreign-born population - Peru (%)
Place of birth for the foreign-born population - Uruguay (%)
Place of birth for the foreign-born population - Venezuela (%)
Place of birth for the foreign-born population - Other South America (%)
Place of birth for the foreign-born population - Canada (%)
Place of birth for the foreign-born population - Other Northern America (%)
Place of birth for the foreign-born population - Other (%)
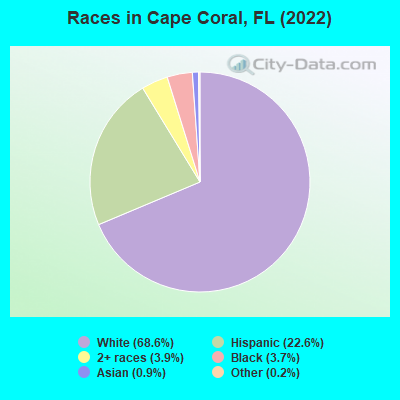
According to 2022 data, the most numerous races in Cape Coral, FL are White alone (148,797 residents), Hispanic (49,040 residents), and Black alone (8,118 residents). 78.6% of Cape Coral residents speak English at home. 17.1% of Cape Coral, FL residents are foreign-born (12.9% born in Latin America, 2.3% born in Europe), which is 22.8% less than the foreign-born rate of 21.0% across the entire state of Florida.
Race distribution in Cape Coral
2000 2022
10,458,509 65.4% White alone 2,682,715 16.8% Hispanic 2,264,268 14.2% Black alone 261,693 1.6% Asian alone 236,954 1.5% Two or more races 42,358 0.3% American Indian alone 28,994 0.2% Other race alone 6,887 0.04% Native Hawaiian and Other
11,309,403 50.8% White alone 6,025,039 27.1% Hispanic 3,241,015 14.6% Black alone 861,630 3.9% Two or more races 623,692 2.8% Asian alone 152,054 0.7% Other race alone 22,504 0.1% American Indian alone 9,486 0.04% Native Hawaiian and Other
Income and house value in Cape Coral Median household income in 2022 $84,274 White non-Hispanic householders$62,848 Black householders$90,330 Asian householders$88,597 Some other race householders$57,990 Two or more races householders$62,386 Hispanic or Latino race householdersMedian 2022 house value $400,629 White Non-Hispanic householders$330,412 Black or African American householders$366,055 American Indian or Alaska Native householders $414,530 Asian householders$267,323 Native Hawaiian and other Pacific Islander householders$361,421 Some other race householders$337,541 Two or more races householders$348,946 Hispanic or Latino householders
Median age by race in Cape Coral
50.4 Median age for White residents49.7 51.0 34.6 Median age for Black or African American residents33.8 34.8 23.7 Median age for American Indian / Alaska Native residents23.5 65.4 57.1 Median age for Asian residents47.5 60.0 -666,666,666.0 Median age for Native Hawaiian / Pacific Islander residents-666,666,666.0 -666,666,666.0 42.6 Median age for Other race residents46.1 42.5 36.9 Median age for Two or more races residents35.0 38.7 51.8 Median age for White alone residents51.3 52.4 37.8 Median age for Hispanic or Latino residents36.9 38.6
Owner/renter occupied households by race in Cape Coral
House owners and renters - White residents 50,779 78.4% Owner occupied14,027 21.6% Renter occupiedHouse owners and renters - Black or African American residents 2,377 89.8% Owner occupied270 10.2% Renter occupiedHouse owners and renters - American Indian / Alaska Native residents 64 100.0% Owner occupiedHouse owners and renters - Asian residents 1,188 93.4% Owner occupied84 6.6% Renter occupiedHouse owners and renters - Other race residents 1,528 67.4% Owner occupied738 32.6% Renter occupiedHouse owners and renters - Two or more races residents 6,253 57.8% Owner occupied4,574 42.2% Renter occupiedHouse owners and renters - White alone residents 48,774 79.7% Owner occupied12,386 20.3% Renter occupiedHouse owners and renters - Hispanic or Latino residents 8,531 56.8% Owner occupied6,489 43.2% Renter occupied
Language usage in Cape Coral
English speakers - Total 78.6% of residents of Cape Coral speak English at home.
16.8% of residents speak Spanish at home 19,201 55.3% Speak English very well15,507 44.7% Speak English less than very well4.6% of residents speak other language at home 6,694 70.4% Speak English very well2,811 29.6% Speak English less than very well
English speakers - Born in the United States 92.3% of residents of Cape Coral speak English at home.
6.7% of residents speak Spanish at home 7,127 86.7% Speak English very well1,090 13.3% Speak English less than very well1.0% of residents speak other language at home 1,156 92.4% Speak English very well95 7.6% Speak English less than very well
English speakers - Native, born elsewhere 25.4% of residents of Cape Coral speak English at home.
71.2% of residents speak Spanish at home 2,025 83.5% Speak English very well400 16.5% Speak English less than very well3.5% of residents speak other language at home 118 100.0% Speak English very well
English speakers - Foreign-born 20.3% of residents of Cape Coral speak English at home.
60.1% of residents speak Spanish at home 5,973 31.3% Speak English very well13,138 68.7% Speak English less than very well19.6% of residents speak other language at home 3,515 56.4% Speak English very well2,716 43.6% Speak English less than very well
White (Caucasian) - Speak only English Native:
95.3% (136,049)Foreign-born:
35.1% (3,441)
White (Caucasian) - Speak another language Native:
4.7% (6,690)Foreign-born:
64.9% (6,351)
Black or African American - Speak only English Native:
86.8% (5,157)Foreign-born:
63.1% (1,537)
Black or African American - Speak another language Native:
13.5% (804)Foreign-born:
40.6% (990)
Asian - Speak only English Native:
91.8% (1,243)Foreign-born:
32.6% (861)
Asian - Speak another language Native:
14.9% (202)Foreign-born:
67.7% (1,788)
Other race - Speak only English Native:
39.3% (1,231)Foreign-born:
13.4% (553)
Other race - Speak another language Native:
60.7% (1,900)Foreign-born:
86.6% (3,576)
Two or more races - Speak only English Native:
61.0% (12,427)Foreign-born:
10.0% (1,490)
Two or more races - Speak another language Native:
39.0% (7,953)Foreign-born:
90.0% (13,346)
White alone - Speak only English Native:
97.5% (131,738)Foreign-born:
45.1% (3,306)
White alone - Speak another language Native:
2.5% (3,445)Foreign-born:
54.9% (4,017)
Hispanic or Latino - Speak only English Native:
48.4% (12,549)Foreign-born:
9.4% (1,959)
Hispanic or Latino - Speak another language Native:
51.6% (13,367)Foreign-born:
90.6% (18,830)
Foreign-born residents in Cape Coral 36,187 residents are foreign born (12.9% Latin America , 2.3% Europe ).
This city:
17.1%Florida:
21.1%
Marital status for residents in Cape Coral Marital status - White (Caucasian) population 15 years and over
Males 27.0% Never married54.8% Now married2.0% Separated3.6% Widowed12.5% DivorcedFemales 22.9% Never married51.3% Now married1.7% Separated11.5% Widowed12.7% DivorcedWomen who gave birth in the past 12 months Now married:
73.4% (1,072)Unmarried:
26.6% (388)
Women who did not give birth in the past 12 months Now married:
40.2% (11,314)Unmarried:
59.8% (16,848)
Marital status - Black or African American population 15 years and over
Males 27.7% Never married62.1% Now married1.0% Separated2.2% Widowed7.0% DivorcedFemales 28.2% Never married45.4% Now married2.5% Separated9.2% Widowed14.7% DivorcedWomen who gave birth in the past 12 months Now married:
0.0% (0)Unmarried:
100.0% (38)
Women who did not give birth in the past 12 months Now married:
42.7% (863)Unmarried:
57.3% (1,156)
Marital status - American Indian / Alaska Native population 15 years and over
Males 83.2% Never married16.8% Now married0.0% Separated0.0% Widowed0.0% DivorcedFemales 0.0% Never married86.1% Now married0.0% Separated0.0% Widowed13.9% DivorcedMarital status - Asian population 15 years and over
Males 40.5% Never married52.7% Now married0.0% Separated2.0% Widowed4.8% DivorcedFemales 14.6% Never married68.2% Now married0.0% Separated13.3% Widowed3.9% DivorcedWomen who gave birth in the past 12 months Now married:
100.0% (5)Unmarried:
0.0% (0)
Women who did not give birth in the past 12 months Now married:
73.3% (658)Unmarried:
26.7% (240)
Marital status - Native Hawaiian / Pacific Islander population 15 years and over
Males 0.0% Never married100.0% Now married0.0% Separated0.0% Widowed0.0% DivorcedFemales 0.0% Never married50.0% Now married0.0% Separated50.0% Widowed0.0% DivorcedMarital status - Other race population 15 years and over
Males 28.0% Never married50.5% Now married0.0% Separated0.0% Widowed21.5% DivorcedFemales 25.0% Never married60.2% Now married3.8% Separated3.2% Widowed7.7% DivorcedWomen who gave birth in the past 12 months Now married:
100.0% (64)Unmarried:
0.0% (0)
Women who did not give birth in the past 12 months Now married:
41.3% (581)Unmarried:
58.7% (825)
Marital status - Two or more races population 15 years and over
Males 37.8% Never married50.6% Now married2.4% Separated0.5% Widowed8.7% DivorcedFemales 31.2% Never married48.0% Now married1.5% Separated9.3% Widowed10.1% DivorcedWomen who gave birth in the past 12 months Now married:
33.6% (260)Unmarried:
66.4% (514)
Women who did not give birth in the past 12 months Now married:
48.1% (4,627)Unmarried:
51.9% (5,000)
Marital status - White alone, not Hispanic / Latino population 15 years and over
Males 26.6% Never married54.9% Now married1.8% Separated3.8% Widowed12.9% DivorcedFemales 21.0% Never married52.6% Now married1.8% Separated12.1% Widowed12.5% DivorcedWomen who gave birth in the past 12 months Now married:
72.1% (1,005)Unmarried:
27.9% (388)
Women who did not give birth in the past 12 months Now married:
41.4% (10,286)Unmarried:
58.6% (14,558)
Marital status - Hispanic or Latino population 15 years and over
Males 37.4% Never married50.8% Now married2.5% Separated0.3% Widowed9.0% DivorcedFemales 33.9% Never married45.5% Now married1.1% Separated7.5% Widowed12.0% DivorcedWomen who gave birth in the past 12 months Now married:
49.8% (244)Unmarried:
50.2% (246)
Women who did not give birth in the past 12 months Now married:
44.1% (5,892)Unmarried:
55.9% (7,455)
Ancestries in Cape Coral
20,111 18.2% American11,003 9.9% German8,310 7.5% Italian7,019 6.3% Irish5,893 5.3% English2,484 2.2% Polish1,463 1.3% European1,063 1.0% Haitian821 0.7% French707 0.6% Norwegian680 0.6% Jamaican624 0.6% Canadian615 0.6% French Canadian615 0.6% Scottish602 0.5% Swedish536 0.5% Brazilian511 0.5% Portuguese503 0.5% Hungarian478 0.4% British449 0.4% Dutch430 0.4% Scotch-Irish403 0.4% African385 0.3% Czech375 0.3% Russian288 0.3% Greek270 0.2% Eastern European256 0.2% Ukrainian225 0.2% Slovak221 0.2% Lebanese209 0.2% Lithuanian209 0.2% Romanian200 0.2% Scandinavian168 0.2% Yugoslavian166 0.1% Swiss156 0.1% Welsh123 0.1% British West Indian116 0.1% Trinidadian and Tobagonian109 0.10% Croatian103 0.09% Belgian82 0.07% Danish81 0.07% Czechoslovakian64 0.06% Slovene63 0.06% Slavic61 0.06% Armenian60 0.05% Finnish51 0.05% Austrian49 0.04% Israeli42 0.04% Turkish39 0.04% Egyptian37 0.03% Moroccan16 0.01% Pennsylvania German16 0.01% Iranian16 0.01% Belizean15 0.01% Icelander14 0.01% Arab12 0.01% Bulgarian10 0.01% Serbian10 0.01% Latvian9 0.01% Northern European7 0.01% Syrian
Geographical mobility in Cape Coral Same house 1 year ago 136,707 86.6% White (Caucasian)7,935 90.2% Black or African American209 78.8% American Indian / Alaska Native3,710 94.0% Asian14 60.7% Native Hawaiian / Pacific Islander5,056 81.8% Other race33,885 89.4% Two or more races128,665 87.3% White alone, not Hispanic / Latino42,391 86.9% Hispanic or LatinoMoved within same county 9,516 6.0% White / Caucasian361 4.1% Black or African American80 2.0% Asian5 22.5% Native Hawaiian / Pacific Islander247 4.0% Other race2,064 5.4% Two or more races8,396 5.7% White alone, not Hispanic / Latino2,292 4.7% Hispanic or LatinoMoved within same state 1,758 1.1% White / Caucasian63 0.7% Black or African American14 0.3% Asian6 24.9% Native Hawaiian / Pacific Islander271 4.4% Other race961 2.5% Two or more races1,673 1.1% White alone, not Hispanic / Latino1,051 2.2% Hispanic or LatinoMoved from different state 8,325 5.3% White / Caucasian853 9.7% Black or African American49 18.6% American Indian / Alaska Native166 4.2% Asian747 12.1% Other race414 1.1% Two or more races7,844 5.3% White alone, not Hispanic / Latino1,856 3.8% Hispanic or LatinoMoved from abroad 1,466 0.9% White17 0.4% Asian54 0.9% Other race598 1.6% Two or more races812 0.6% White alone, not Hispanic / Latino1,164 2.4% Hispanic or Latino
Children Nativity (place of birth) in Cape Coral
Children under 6 years - Living with two parents Both parents native 5,480 100.0% NativeBoth parents foreign-born 1,389 100.0% NativeOne native, one foreign-born parent 570 100.0% NativeChildren under 6 years - Living with one parent Native parent 3,552 100.0% NativeForeign-born parent 635 100.0% NativeChildren 6 to 17 years - Living with two parents Both parents native 12,655 100.0% NativeBoth parents foreign-born 2,735 80.9% Native646 19.1% Foreign-bornOne native, one foreign-born parent 2,118 100.0% NativeChildren 6 to 17 years - Living with one parent Native parent 8,606 100.0% NativeForeign-born parent 998 52.5% Native902 47.5% Foreign-born
Place of birth for residents in Cape Coral 28,204 Americas27,086 Latin America17,886 Caribbean6,090 South America4,906 Europe3,109 Central America2,892 Asia1,887 Eastern Europe1,488 South Eastern Asia1,358 Western Europe1,247 Northern Europe1,117 Northern America659 Eastern Asia637 China412 Southern Europe379 Western Asia360 South Central Asia177 Africa70 Northern Africa60 Southern Africa47 Eastern Africa6 Oceania6 Australia and New Zealand Subregion14,213 Cuba2,475 Colombia1,802 Dominican Republic1,215 Germany1,211 Philippines1,117 Canada1,029 Mexico973 Honduras958 Jamaica944 Brazil811 Peru719 Venezuela636 China588 Nicaragua568 England530 Haiti458 Poland388 Ecuador321 Italy290 Czechoslovakia280 Lebanon273 United Kingdom247 Guyana225 Ireland217 Vietnam216 Hungary216 Romania212 India186 Bosnia and Herzegovina185 Trinidad and Tobago166 Costa Rica162 Uruguay147 Ukraine145 Russia128 Argentina127 El Salvador124 Chile121 Pakistan109 Panama95 Sweden93 Guatemala87 Bolivia69 Netherlands65 Grenada64 Croatia58 Israel48 Barbados48 Portugal46 Austria45 Denmark44 Bahamas43 Spain41 South Africa40 Egypt34 Lithuania30 Morocco28 Scotland28 Laos26 Iran25 Zimbabwe21 Iraq21 Belize18 Belarus18 Cambodia17 Korea16 Belgium12 Kuwait11 Latvia11 Bulgaria11 Thailand10 France7 Norway6 Australia4 Japan1 Taiwan
Grandparents responsible for own grandchildren in Cape Coral
Grandparents (30 to 59 years) White / Caucasian 350 20.6% Responsible for grandchildren1,347 79.4% Not responsible for grandchildrenBlack or African American 32 61.6% Responsible for grandchildren20 38.4% Not responsible for grandchildrenOther race 51 100.0% Not responsible for grandchildrenTwo or more races 44 15.6% Responsible for grandchildren237 84.4% Not responsible for grandchildrenWhite alone, not Hispanic / Latino 305 18.5% Responsible for grandchildren1,347 81.5% Not responsible for grandchildrenHispanic or Latino 109 18.2% Responsible for grandchildren490 81.8% Not responsible for grandchildrenGrandparents (60 years and over) White / Caucasian 618 42.1% Responsible for grandchildren851 57.9% Not responsible for grandchildrenBlack or African American 7 11.0% Responsible for grandchildren58 89.0% Not responsible for grandchildrenOther race 77 18.5% Responsible for grandchildren338 81.5% Not responsible for grandchildrenTwo or more races 30 2.9% Responsible for grandchildren993 97.1% Not responsible for grandchildrenWhite alone, not Hispanic / Latino 556 39.5% Responsible for grandchildren851 60.5% Not responsible for grandchildrenHispanic or Latino 135 11.4% Responsible for grandchildren1,052 88.6% Not responsible for grandchildren