Brunswick, OH (Ohio) Houses and Residents
| Brunswick: | $236,511 |
| Ohio: | $204,100 |
Mean price in 2022:
Detached houses: $256,956
Here: $256,956 State: $254,366 Townhouses or other attached units: $262,792
Here: $262,792 State: $225,733 In 2-unit structures: $240,484
Here: $240,484 State: $144,384 In 3-to-4-unit structures: $134,547
Here: $134,547 State: $203,002 In 5-or-more-unit structures: $1,438,339
Here: $1,438,339 State: $211,593 Mobile homes: $155,697
Here: $155,697 State: $62,719
Total population: 34,604 (Urban population: 33,391, Rural population: 0)
Houses: 15,092 (14,660 occupied: 10,803 owner occupied, 3,905 renter occupied)
| % of renters here: | 27% |
| State: | 33% |
Housing density: 1,203 houses/condos per square mile
Median price asked for vacant for-sale houses and condos in 2022: $122,504.
Median contract rent in 2022: $892 (lower quartile is $773, upper quartile is $1,142)
Median rent asked for vacant for-rent units in 2022: $1,153
Median gross rent in Brunswick, OH in 2022: $1,078
Housing units in Brunswick with a mortgage: 7,460 (888 second mortgage, 9 home equity loan, 863 both second mortgage and home equity loan)
Houses without a mortgage: 415
Median household income for houses/condos with a mortgage: $96,738
Median household income for apartments without a mortgage: $76,670
Median monthly housing costs: $1,110
Compare current foreclosures in Brunswick, OH:
| Photo | Address | Area | Beds / Baths | Price | Details |
|---|---|---|---|---|---|

|
#1
Helen Ave
Brunswick, OH 44212
|
1,536 sq. feet
|
1 baths 4 beds |
show details | |

|
#2
Canterbury Dr
Brunswick, OH 44212
|
2,184 sq. feet
|
2 baths 4 beds |
show details | |

|
#3
Quarry Ln
Brunswick, OH 44212
|
1,613 sq. feet
|
2 baths 3 beds |
show details | |

|
#4
Jerrold Blvd
Brunswick, OH 44212
|
2,383 sq. feet
|
2 baths 3 beds |
show details | |

|
#5
Saint James Dr
Brunswick, OH 44212
|
1,144 sq. feet
|
1 baths 3 beds |
show details | |

|
#6
Sleepy Hollow Rd
Brunswick, OH 44212
|
1,668 sq. feet
|
1 baths 3 beds |
show details | |

|
#7
Locust Ln
Brunswick, OH 44212
|
2,096 sq. feet
|
2 baths 4 beds |
show details | |

|
#8
Magnolia Dr
Brunswick, OH 44212
|
1,548 sq. feet
|
2 baths 3 beds |
show details | |

|
#9
Starview Dr
Brunswick, OH 44212
|
1,478 sq. feet
|
1 baths 3 beds |
show details | |

|
#10
Meadowland Dr
Brunswick, OH 44212
|
1,248 sq. feet
|
1 baths 2 beds |
show details |
| Photo | Address | Area | Beds / Baths | Price | Details |
|---|---|---|---|---|---|

|
#11
Jeanette St
Brunswick, OH 44212
|
2,800 sq. feet
|
4 baths 4 beds |
show details | |

|
#12
Westchester Dr
Brunswick, OH 44212
|
1,380 sq. feet
|
2 baths 4 beds |
show details | |

|
#13
Spyglass Hill Dr
Brunswick, OH 44212
|
1,651 sq. feet
|
2 baths 2 beds |
show details | |

|
#14
Substation Rd
Brunswick, OH 44212
|
1,572 sq. feet
|
2 baths 3 beds |
show details | |

|
#15
Bennington Blvd
Brunswick, OH 44212
|
1,260 sq. feet
|
1 baths 3 beds |
show details | |

|
#16
Duke Ct
Brunswick, OH 44212
|
1,058 sq. feet
|
1 baths 2 beds |
show details | |

|
#17
Hathaway Dr
Brunswick, OH 44212
|
1,469 sq. feet
|
1 baths 4 beds |
show details | |

|
#18
Crystal Ct
Brunswick, OH 44212
|
1,967 sq. feet
|
2 baths 3 beds |
show details | |

|
#19
Brad Dr
Brunswick, OH 44212
|
1,632 sq. feet
|
1 baths 4 beds |
show details | |

|
#20
Claremont Dr
Brunswick, OH 44212
|
1,288 sq. feet
|
2 baths 3 beds |
show details |
| Photo | Address | Area | Beds / Baths | Price | Details |
|---|---|---|---|---|---|

|
#21
Hilltop Dr
Brunswick, OH 44212
|
1,264 sq. feet
|
2 baths 4 beds |
show details | |

|
#22
Brambleside Dr
Brunswick, OH 44212
|
1,326 sq. feet
|
2 baths 3 beds |
show details | |

|
#23
Oakleigh Dr
Brunswick, OH 44212
|
1,248 sq. feet
|
1 baths 3 beds |
show details | |

|
#24
Lily Ct
Brunswick, OH 44212
|
1,809 sq. feet
|
2 baths 4 beds |
show details | |

|
#25
Topaz Ln
Brunswick, OH 44212
|
1,036 sq. feet
|
2 baths 2 beds |
show details | |

|
#26
Twain Cir
Brunswick, OH 44212
|
1,904 sq. feet
|
1 baths 3 beds |
show details | |

|
#27
Ruth Dr
Brunswick, OH 44212
|
1,125 sq. feet
|
1 baths 3 beds |
show details | |

|
#28
Woodward Dr
Brunswick, OH 44212
|
2,192 sq. feet
|
2 baths 4 beds |
show details | |

|
#29
Tulip Ct
Brunswick, OH 44212
|
1,142 sq. feet
|
2 baths 3 beds |
show details | |

|
#30
Diana Dr
Brunswick, OH 44212
|
925 sq. feet
|
1 baths 3 beds |
show details |
| Photo | Address | Area | Beds / Baths | Price | Details |
|---|---|---|---|---|---|

|
#31
Auvergne Oval
Brunswick, OH 44212
|
1,972 sq. feet
|
2 baths 4 beds |
show details | |

|
#32
Mayflower Oval
Brunswick, OH 44212
|
2,214 sq. feet
|
2 baths 4 beds |
show details | |

|
#33
Ruth Dr
Brunswick, OH 44212
|
1,445 sq. feet
|
1 baths 3 beds |
show details | |

|
#34
Sleepy Hollow Rd
Brunswick, OH 44212
|
1,036 sq. feet
|
1 baths 2 beds |
show details | |

|
#35
Briarleigh Dr
Brunswick, OH 44212
|
1,053 sq. feet
|
2 baths 3 beds |
show details | |

|
#36
Grafton Rd
Brunswick, OH 44212
|
2,508 sq. feet
|
2 baths 2 beds |
show details | |

|
#37
Byron Dr
Brunswick, OH 44212
|
1,144 sq. feet
|
1 baths 3 beds |
show details | |

|
#38
Rolling Hills Dr
Brunswick, OH 44212
|
1,624 sq. feet
|
2 baths 3 beds |
show details | |

|
#39
Grafton Rd
Brunswick, OH 44212
|
1,400 sq. feet
|
2 baths 4 beds |
show details | |

|
#40
Lakeview Dr
Brunswick, OH 44212
|
1,645 sq. feet
|
2 baths 3 beds |
show details |
| Photo | Address | Area | Beds / Baths | Price | Details |
|---|---|---|---|---|---|

|
#41
Barra Dr
Brunswick, OH 44212
|
2,106 sq. feet
|
1 baths 3 beds |
show details | |

|
#42
Blueberry Hill Dr
Brunswick, OH 44212
|
1,270 sq. feet
|
1 baths 4 beds |
show details | |

|
#43
Timberlake Trail Dr
Brunswick, OH 44212
|
1,584 sq. feet
|
3 baths 3 beds |
show details | |

|
#44
Hilltop Dr
Brunswick, OH 44212
|
1,188 sq. feet
|
1 baths 3 beds |
show details | |

|
#45
Spencer Ln
Brunswick, OH 44212
|
- sq. feet
|
- baths - beds |
show details | |

|
#46
Marks Rd Unit H
Brunswick, OH 44212
|
- sq. feet
|
- baths - beds |
show details | |

|
#47
Hadcock Rd Apt 301
Brunswick, OH 44212
|
- sq. feet
|
- baths - beds |
show details | |

|
#48
Edgebrooke Dr
Brunswick, OH 44212
|
- sq. feet
|
- baths - beds |
show details | |

|
#49
Hemlock Ct Apt 207
Brunswick, OH 44212
|
- sq. feet
|
- baths - beds |
show details | |

|
Check over 1 million property listings on Foreclosure.com!
|
browse all offers | |||

Latest news about housing in Brunswick, OH collected exclusively by city-data.com from local newspapers, TV, and radio stations

 | Looking for condo/duplex rental - Wadsworth, Medina, Brunswick area (2 replies) |
| Renting vs Buying (13 replies) |
| Houses for rent near Independence (3 replies) |
| where are the liberal, family friendly suburbs? (83 replies) |
| Affordable suburb? Plus apartments that are giant dog friendly? (2 replies) |
| Columbia Station or Brunswick (1 reply) |

Median year apartment built: 1977
Household type by relationship:
Households: 35,529- Male householders: 7,351 (1,986 living alone), Female householders: 7,217 (2,363 living alone)
7,409 spouses (7,352 opposite-sex spouses), 946 unmarried partners, (931 opposite-sex unmarried partners), 10,167 children (9,469 natural, 214 adopted, 484 stepchildren), 657 grandchildren, 508 brothers or sisters, 303 parents, 0 foster children, 263 other relatives, 408 non-relatives
- In group quarters: 295
Size of family households: 4,189 2-persons, 2,228 3-persons, 1,702 4-persons, 751 5-persons, 191 6-persons, 113 7-or-more-persons.
Size of nonfamily households: 4,981 1-person, 603 2-persons, 24 3-persons.
4,732 married couples with children.
2,235 single-parent households (415 men, 1,820 women).
95.5% of residents of Brunswick speak English at home.
1.1% of residents speak Spanish at home (58% speak English very well, 19% speak English well, 20% speak English not well, 3% don't speak English at all).
2.5% of residents speak other Indo-European language at home (45% speak English very well, 52% speak English well, 3% speak English not well).
0.4% of residents speak Asian or Pacific Island language at home (39% speak English very well, 51% speak English well, 10% speak English not well).
0.4% of residents speak other language at home (92% speak English very well, 8% speak English not well).
Foreign born population: 1,514 (4.3%)
(91.7% of them are naturalized citizens)
| Here: | 7.1 |
| State: | 6.7 |
| Here: | 4.3 |
| State: | 4.4 |

- Bedrooms in owner-occupied houses and condos in Brunswick, Ohio
- 39no bedroom
- 91 bedroom
- 1,0622 bedrooms
- 5,7223 bedrooms
- 3,6434 bedrooms
- 3285+ bedrooms

- Bedrooms in renter-occupied apartments in Brunswick, Ohio
- 232no bedroom
- 5711 bedroom
- 2,0662 bedrooms
- 9593 bedrooms
- 624 bedrooms
- 165+ bedrooms

- Cars and other vehicles available in Brunswick in owner-occupied houses/condos
- 236no vehicle
- 2,4651 vehicle
- 4,9422 vehicles
- 2,0433 vehicles
- 7424 vehicles
- 3765+ vehicles

- Cars and other vehicles available in Brunswick in renter-occupied apartments
- 254no vehicle
- 2,3491 vehicle
- 1,0232 vehicles
- 2143 vehicles
- 434 vehicles
- 225+ vehicles

- Rooms in owner-occupied houses in Brunswick, Ohio
- 391 room
- 02 rooms
- 253 rooms
- 4174 rooms
- 1,5695 rooms
- 2,0746 rooms
- 1,9947 rooms
- 2,1098 rooms
- 2,5779+ rooms

- Rooms in renter-occupied apartments in Brunswick, Ohio
- 2321 room
- 1332 rooms
- 5523 rooms
- 1,3264 rooms
- 8065 rooms
- 3756 rooms
- 2977 rooms
- 1248 rooms
- 629+ rooms


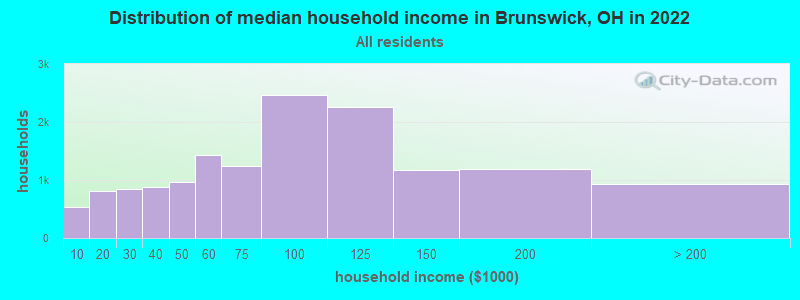
Brunswick, OH household income distribution

- 541Less than $10,000
- 809$10,000 to $19,999
- 853$20,000 to $29,999
- 878$30,000 to $39,999
- 968$40,000 to $49,999
- 1,432$50,000 to $59,999
- 1,239$60,000 to $74,999
- 2,461$75,000 to $99,999
- 2,252$100,000 to $124,999
- 1,180$125,000 to $149,999
- 1,194$150,000 to $199,999
- 923$200,000 or more
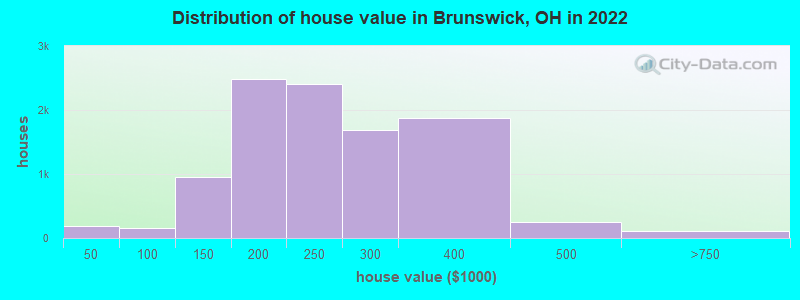
Home value of owner - occupied houses in 2022 in Brunswick, OH
-
- 26Less than $10,000
- 20$10,000 to $14,999
- 58$15,000 to $19,999
- 13$20,000 to $24,999
- 39$30,000 to $34,999
- 32$40,000 to $49,999
- 12$50,000 to $59,999
- 72$60,000 to $69,999
- 30$70,000 to $79,999
- 6$80,000 to $89,999
- 5$90,000 to $99,999
- 325$100,000 to $124,999
- 620$125,000 to $149,999
- 1,377$150,000 to $174,999
- 1,102$175,000 to $199,999
- 2,398$200,000 to $249,999
- 1,682$250,000 to $299,999
- 1,877$300,000 to $399,999
- 252$400,000 to $499,999
- 94$500,000 to $749,999
- 11$2,000,000 or more
Rent paid by renters in 2022 in Brunswick, OH
-
- 54$200 to $249
- 7$250 to $299
- 39$300 to $349
- 19$350 to $399
- 57$400 to $449
- 25$450 to $499
- 212$500 to $549
- 42$550 to $599
- 10$600 to $649
- 167$650 to $699
- 302$700 to $749
- 385$750 to $799
- 612$800 to $899
- 570$900 to $999
- 699$1,000 to $1,249
- 295$1,250 to $1,499
- 263$1,500 to $1,999
- 81$2,000 to $2,499
- 153No cash rent


Percentage of workers working in this county: 43.3%
Number of people working at home: 2,348 (12.1% of all workers)
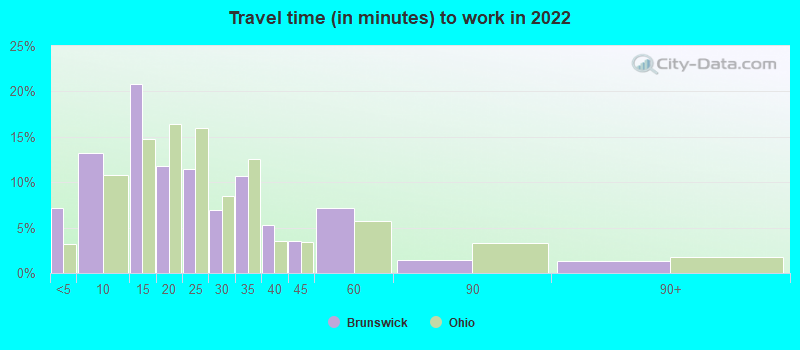
Travel time to work (commute)
- Less than 5 minutes: 652
- 5 to 9 minutes: 1,415
- 10 to 14 minutes: 2,151
- 15 to 19 minutes: 1,708
- 20 to 24 minutes: 1,765
- 25 to 29 minutes: 1,699
- 30 to 34 minutes: 2,752
- 35 to 39 minutes: 800
- 40 to 44 minutes: 925
- 45 to 59 minutes: 1,527
- 60 to 89 minutes: 691
- 90 or more minutes: 259
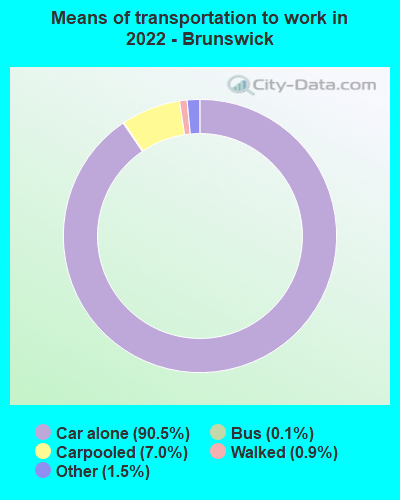
Means of transportation to work:
- Drove a car alone: 8,278 (73.1%)
- Carpooled: 690 (6.1%)
- Bus: 12 (0.1%)
- Taxi: 161 (1.4%)
- Walked: 81 (0.7%)
- Worked at home: 2,348 (20.7%)

- Unemployment by race in 2022
- Unemployment rate for White non-Hispanic residents
- 3.4%Males
- 1.5%Females
- Unemployment rate for Black residents
- 28.1%Males
- Unemployment rate for two or more race residents
- 6.6%Males
- Unemployment rate for Hispanic or Latino residents
- 6.1%Males
- 1.2%Females

- Year of entry for the foreign-born population in Brunswick, Ohio
- 2352010 or later
- 3442000 to 2009
- 1821990 to 1999
- 1831980 to 1989
- 1941970 to 1979
- 786Before 1970

First ancestries reported:
- German: 2,252 (17.1%)
- Irish: 1,553 (11.8%)
- English: 1,394 (10.6%)
- Polish: 1,166 (8.9%)
- Italian: 1,004 (7.6%)
- American: 914 (6.9%)
- Hungarian: 575 (4.4%)
- Slovak: 492 (3.7%)
- European: 256 (1.9%)
- Ukrainian: 209 (1.6%)
- Lebanese: 153 (1.2%)
- Greek: 128 (1.0%)
- Slovene: 120 (0.9%)
- African: 106 (0.8%)
- Scottish: 104 (0.8%)
- Eastern European: 90 (0.7%)
- Czech: 82 (0.6%)
- Serbian: 77 (0.6%)
- Romanian: 74 (0.6%)
- Dutch: 73 (0.6%)
- Croatian: 65 (0.5%)
- Yugoslavian: 60 (0.5%)
- Palestinian: 60 (0.5%)
- Russian: 59 (0.4%)
- Scotch-Irish: 48 (0.4%)
- Canadian: 45 (0.3%)
- French: 33 (0.3%)
- Austrian: 32 (0.2%)
- Bulgarian: 25 (0.2%)
- Northern European: 24 (0.2%)
- Egyptian: 18 (0.1%)
- Finnish: 16 (0.1%)
- Armenian: 12 (0.09%)
- French Canadian: 11 (0.08%)
- Slavic: 11 (0.08%)
- Welsh: 10 (0.08%)
- British: 9 (0.07%)
- Latvian: 8 (0.06%)
- Czechoslovakian: 8 (0.06%)
- Nigerian: 6 (0.05%)
- Lithuanian: 5 (0.04%)
- Arab: 2 (0.02%)
Most common places of birth for foreign-born residents (%):
| Brunswick: | 17.5% (228) |
| Ohio: | 0.5% (2,773) |
| Brunswick: | 10.2% (133) |
| Ohio: | 2.2% (12,846) |
| Brunswick: | 6.8% (88) |
| Ohio: | 2.6% (14,988) |
| Brunswick: | 6.4% (83) |
| Ohio: | 0.7% (4,155) |
| Brunswick: | 5.4% (70) |
| Ohio: | 1.1% (6,346) |
| Brunswick: | 4.1% (54) |
| Ohio: | 3.1% (17,818) |
| Brunswick: | 3.4% (44) |
| Ohio: | 1.7% (9,564) |
| Brunswick: | 3.4% (44) |
| Ohio: | 1.0% (5,979) |
| Brunswick: | 3.2% (42) |
| Ohio: | 0.5% (2,826) |
| Brunswick: | 3.0% (39) |
| Ohio: | 0.3% (1,568) |
| Brunswick: | 2.8% (36) |
| Ohio: | 7.8% (44,796) |
| Brunswick: | 2.1% (28) |
| Ohio: | 1.1% (6,549) |
| Brunswick: | 2.1% (27) |
| Ohio: | 0.2% (1,320) |
| Brunswick: | 2.0% (26) |
| Ohio: | 0.3% (1,875) |
| Brunswick: | 1.8% (24) |
| Ohio: | 0.2% (1,224) |
| Brunswick: | 1.7% (22) |
| Ohio: | 0.4% (2,185) |
| Brunswick: | 1.7% (22) |
| Ohio: | 1.0% (5,444) |
Place of birth for U.S.-born residents:
- This state: 29,347
- Other state: 4,485
- Northeast: 1,575
- Midwest: 899
- South: 1,405
- West: 596
93.5% of Brunswick residents lived in the same house 1 years ago.
Out of people who lived in different houses, 33.5% lived in this county.
Out of people who lived in different counties, 81.2% lived in Ohio.
| Brunswick: | 93.5% |
| State average: | 87.8% |
Education attainment for males 25 years and older:
- No schooling: 53
- Nursery to 4th grade: 9
- 5th and 6th grade: 0
- 7th and 8th grade: 102
- 9th grade: 104
- 10th grade: 3
- 11th grade: 358
- 12th grade, no diploma: 171
- High school graduate (or equivalency): 4,224
- Less than 1 year of college: 1,106
- Some college more than 1 year, no degree: 1,837
- Associate degree: 993
- Bachelor's degree: 1,956
- Master's degree: 1,087
- Professional school degree: 105
- Doctorate degree: 75

Education attainment for females 25 years and older:
- No schooling: 72
- Nursery to 4th grade: 0
- 5th and 6th grade: 0
- 7th and 8th grade: 179
- 9th grade: 14
- 10th grade: 61
- 11th grade: 165
- 12th grade, no diploma: 205
- High school graduate (or equivalency): 3,338
- Less than 1 year of college: 1,099
- Some college more than 1 year, no degree: 1,995
- Associate degree: 1,496
- Bachelor's degree: 3,103
- Master's degree: 832
- Professional school degree: 67
- Doctorate degree: 97


Housing units in structures:
- One, detached: 10,678
- One, attached: 1,031
- Two: 78
- 3 or 4: 246
- 5 to 9: 633
- 10 to 19: 1,481
- 20 to 49: 515
- 50 or more: 374
- Mobile homes: 51
Housing units lacking complete kitchen facilities in 2022: 0.2%
House/condo owner moved in on average 16 years ago
Renter moved in on average 4 years ago

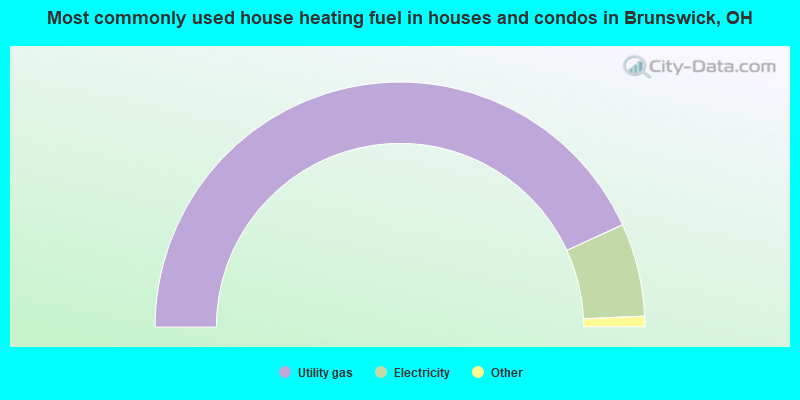
- 86.3%Utility gas
- 12.3%Electricity
- 0.8%Bottled, tank, or LP gas
- 0.3%Wood
- 0.1%Fuel oil, kerosene, etc.
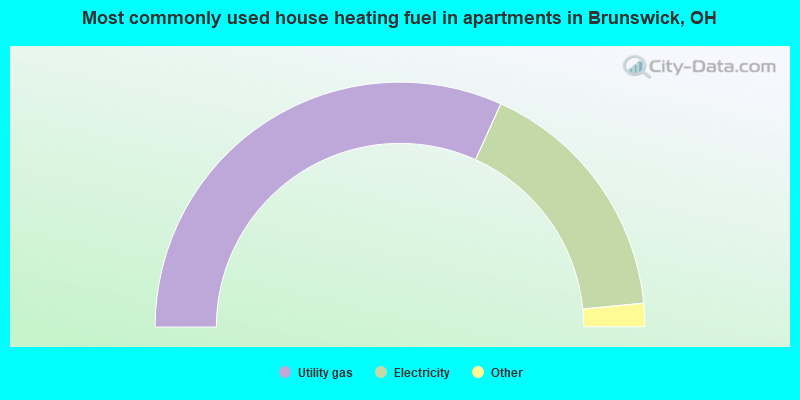
- 63.6%Utility gas
- 33.4%Electricity
- 1.8%Other fuel
- 1.1%Bottled, tank, or LP gas
- 0.2%Wood
Private vs. public school enrollment:
| Here: | 6.0% |
| Ohio: | 16.0% |
| Here: | 9.9% |
| Ohio: | 13.1% |
| Here: | 33.3% |
| Ohio: | 22.3% |


