Races in Brunswick, Ohio (OH) Detailed Stats
Data:
Races - White alone (%)
Races - White alone (% change since 2000)
Races - Black alone (%)
Races - Black alone (% change since 2000)
Races - American Indian alone (%)
Races - American Indian alone (% change since 2000)
Races - Asian alone (%)
Races - Asian alone (% change since 2000)
Races - Hispanic (%)
Races - Hispanic (% change since 2000)
Races - Native Hawaiian and Other Pacific Islander alone (%)
Races - Native Hawaiian and Other Pacific Islander alone (% change since 2000)
Races - Two or more races(%)
Races - Two or more races(% change since 2000)
Races - Other race alone (%)
Races - Other race alone (% change since 2000)
Racial diversity
Place of birth - Born in state of residence (%)
Place of birth - Born in state of residence (%) - White
Place of birth - Born in state of residence (%) - Black or African American
Place of birth - Born in state of residence (%) - Asian
Place of birth - Born in state of residence (%) - Hispanic or Latino
Place of birth - Born in state of residence (%) - American Indian and Alaska Native
Place of birth - Born in state of residence (%) - Multirace
Place of birth - Born in state of residence (%) - Other Race
Place of birth - Born in other state (%)
Place of birth - Born in other state (%) - White
Place of birth - Born in other state (%) - Black or African American
Place of birth - Born in other state (%) - Asian
Place of birth - Born in other state (%) - Hispanic or Latino
Place of birth - Born in other state (%) - American Indian and Alaska Native
Place of birth - Born in other state (%) - Multirace
Place of birth - Born in other state (%) - Other Race
Place of birth - Native, outside of US (%)
Place of birth - Native, outside of US (%) - White
Place of birth - Native, outside of US (%) - Black or African American
Place of birth - Native, outside of US (%) - Asian
Place of birth - Native, outside of US (%) - Hispanic or Latino
Place of birth - Native, outside of US (%) - American Indian and Alaska Native
Place of birth - Native, outside of US (%) - Multirace
Place of birth - Native, outside of US (%) - Other Race
Place of birth - Foreign born (%)
Place of birth - Foreign born (%) - White
Place of birth - Foreign born (%) - Black or African American
Place of birth - Foreign born (%) - Asian
Place of birth - Foreign born (%) - Hispanic or Latino
Place of birth - Foreign born (%) - American Indian and Alaska Native
Place of birth - Foreign born (%) - Multirace
Place of birth - Foreign born (%) - Other Race
Residents speaking English at home (%)
Residents speaking English at home - Born in the United States (%)
Residents speaking English at home - Native, born elsewhere (%)
Residents speaking English at home - Foreign born (%)
Residents speaking Spanish at home (%)
Residents speaking Spanish at home - Born in the United States (%)
Residents speaking Spanish at home - Native, born elsewhere (%)
Residents speaking Spanish at home - Foreign born (%)
Residents speaking other language at home (%)
Residents speaking other language at home - Born in the United States (%)
Residents speaking other language at home - Native, born elsewhere (%)
Residents speaking other language at home - Foreign born (%)
Marital status - Never married (%)
Marital status - Now married (%)
Marital status - Separated (%)
Marital status - Widowed (%)
Marital status - Divorced (%)
Ancestries Reported - Arab (%)
Ancestries Reported - Czech (%)
Ancestries Reported - Danish (%)
Ancestries Reported - Dutch (%)
Ancestries Reported - English (%)
Ancestries Reported - French (%)
Ancestries Reported - French Canadian (%)
Ancestries Reported - German (%)
Ancestries Reported - Greek (%)
Ancestries Reported - Hungarian (%)
Ancestries Reported - Irish (%)
Ancestries Reported - Italian (%)
Ancestries Reported - Lithuanian (%)
Ancestries Reported - Norwegian (%)
Ancestries Reported - Polish (%)
Ancestries Reported - Portuguese (%)
Ancestries Reported - Russian (%)
Ancestries Reported - Scotch-Irish (%)
Ancestries Reported - Scottish (%)
Ancestries Reported - Slovak (%)
Ancestries Reported - Subsaharan African (%)
Ancestries Reported - Swedish (%)
Ancestries Reported - Swiss (%)
Ancestries Reported - Ukrainian (%)
Ancestries Reported - United States (%)
Ancestries Reported - Welsh (%)
Ancestries Reported - West Indian (%)
Ancestries Reported - Other (%)
Geographical mobility - Same house 1 year ago (%)
Geographical mobility - Same house 1 year ago (%) - White
Geographical mobility - Same house 1 year ago (%) - Black or African American
Geographical mobility - Same house 1 year ago (%) - Asian
Geographical mobility - Same house 1 year ago (%) - Hispanic or Latino
Geographical mobility - Same house 1 year ago (%) - American Indian and Alaska Native
Geographical mobility - Same house 1 year ago (%) - Multirace
Geographical mobility - Same house 1 year ago (%) - Other Race
Geographical mobility - Moved within same county (%)
Geographical mobility - Moved within same county (%) - White
Geographical mobility - Moved within same county (%) - Black or African American
Geographical mobility - Moved within same county (%) - Asian
Geographical mobility - Moved within same county (%) - Hispanic or Latino
Geographical mobility - Moved within same county (%) - American Indian and Alaska Native
Geographical mobility - Moved within same county (%) - Multirace
Geographical mobility - Moved within same county (%) - Other Race
Geographical mobility - Moved from different county within same state (%)
Geographical mobility - Moved from different county within same state (%) - White
Geographical mobility - Moved from different county within same state (%) - Black or African American
Geographical mobility - Moved from different county within same state (%) - Asian
Geographical mobility - Moved from different county within same state (%) - Hispanic or Latino
Geographical mobility - Moved from different county within same state (%) - American Indian and Alaska Native
Geographical mobility - Moved from different county within same state (%) - Multirace
Geographical mobility - Moved from different county within same state (%) - Other Race
Geographical mobility - Moved from different state (%)
Geographical mobility - Moved from different state (%) - White
Geographical mobility - Moved from different state (%) - Black or African American
Geographical mobility - Moved from different state (%) - Asian
Geographical mobility - Moved from different state (%) - Hispanic or Latino
Geographical mobility - Moved from different state (%) - American Indian and Alaska Native
Geographical mobility - Moved from different state (%) - Multirace
Geographical mobility - Moved from different state (%) - Other Race
Geographical mobility - Moved from abroad (%)
Geographical mobility - Moved from abroad (%) - White
Geographical mobility - Moved from abroad (%) - Black or African American
Geographical mobility - Moved from abroad (%) - Asian
Geographical mobility - Moved from abroad (%) - Hispanic or Latino
Geographical mobility - Moved from abroad (%) - American Indian and Alaska Native
Geographical mobility - Moved from abroad (%) - Multirace
Geographical mobility - Moved from abroad (%) - Other Race
Place of birth for the foreign-born population - Ireland (%)
Place of birth for the foreign-born population - Denmark (%)
Place of birth for the foreign-born population - Norway (%)
Place of birth for the foreign-born population - Sweden (%)
Place of birth for the foreign-born population - United Kingdom (%)
Place of birth for the foreign-born population - England (%)
Place of birth for the foreign-born population - Scotland (%)
Place of birth for the foreign-born population - Other Northern Europe (%)
Place of birth for the foreign-born population - Austria (%)
Place of birth for the foreign-born population - Belgium (%)
Place of birth for the foreign-born population - France (%)
Place of birth for the foreign-born population - Germany (%)
Place of birth for the foreign-born population - Netherlands (%)
Place of birth for the foreign-born population - Switzerland (%)
Place of birth for the foreign-born population - Other Western Europe (%)
Place of birth for the foreign-born population - Greece (%)
Place of birth for the foreign-born population - Italy (%)
Place of birth for the foreign-born population - Portugal (%)
Place of birth for the foreign-born population - Spain (%)
Place of birth for the foreign-born population - Other Southern Europe (%)
Place of birth for the foreign-born population - Albania (%)
Place of birth for the foreign-born population - Belarus (%)
Place of birth for the foreign-born population - Bosnia and Herzegovina (%)
Place of birth for the foreign-born population - Bulgaria (%)
Place of birth for the foreign-born population - Croatia (%)
Place of birth for the foreign-born population - Czechoslovakia (%)
Place of birth for the foreign-born population - Hungary (%)
Place of birth for the foreign-born population - Latvia (%)
Place of birth for the foreign-born population - Lithuania (%)
Place of birth for the foreign-born population - North Macedonia (Macedonia) (%)
Place of birth for the foreign-born population - Moldova (%)
Place of birth for the foreign-born population - Poland (%)
Place of birth for the foreign-born population - Romania (%)
Place of birth for the foreign-born population - Russia (%)
Place of birth for the foreign-born population - Serbia (%)
Place of birth for the foreign-born population - Ukraine (%)
Place of birth for the foreign-born population - Other Eastern Europe (%)
Place of birth for the foreign-born population - China (%)
Place of birth for the foreign-born population - Hong Kong (%)
Place of birth for the foreign-born population - Taiwan (%)
Place of birth for the foreign-born population - Japan (%)
Place of birth for the foreign-born population - Korea (%)
Place of birth for the foreign-born population - Other Eastern Asia (%)
Place of birth for the foreign-born population - Afghanistan (%)
Place of birth for the foreign-born population - Bangladesh (%)
Place of birth for the foreign-born population - India (%)
Place of birth for the foreign-born population - Iran (%)
Place of birth for the foreign-born population - Kazakhstan (%)
Place of birth for the foreign-born population - Nepal (%)
Place of birth for the foreign-born population - Pakistan (%)
Place of birth for the foreign-born population - Sri Lanka (%)
Place of birth for the foreign-born population - Uzbekistan (%)
Place of birth for the foreign-born population - Other South Central Asia (%)
Place of birth for the foreign-born population - Burma (%)
Place of birth for the foreign-born population - Cambodia (%)
Place of birth for the foreign-born population - Indonesia (%)
Place of birth for the foreign-born population - Laos (%)
Place of birth for the foreign-born population - Malaysia (%)
Place of birth for the foreign-born population - Philippines (%)
Place of birth for the foreign-born population - Singapore (%)
Place of birth for the foreign-born population - Thailand (%)
Place of birth for the foreign-born population - Vietnam (%)
Place of birth for the foreign-born population - Other South Eastern Asia (%)
Place of birth for the foreign-born population - Armenia (%)
Place of birth for the foreign-born population - Iraq (%)
Place of birth for the foreign-born population - Israel (%)
Place of birth for the foreign-born population - Jordan (%)
Place of birth for the foreign-born population - Kuwait (%)
Place of birth for the foreign-born population - Lebanon (%)
Place of birth for the foreign-born population - Saudi Arabia (%)
Place of birth for the foreign-born population - Syria (%)
Place of birth for the foreign-born population - Turkey (%)
Place of birth for the foreign-born population - Yemen (%)
Place of birth for the foreign-born population - Other Western Asia (%)
Place of birth for the foreign-born population - Eritrea (%)
Place of birth for the foreign-born population - Ethiopia (%)
Place of birth for the foreign-born population - Kenya (%)
Place of birth for the foreign-born population - Somalia (%)
Place of birth for the foreign-born population - Uganda (%)
Place of birth for the foreign-born population - Zimbabwe (%)
Place of birth for the foreign-born population - Other Eastern Africa (%)
Place of birth for the foreign-born population - Cameroon (%)
Place of birth for the foreign-born population - Congo (%)
Place of birth for the foreign-born population - Democratic Republic of Congo (Zaire) (%)
Place of birth for the foreign-born population - Other Middle Africa (%)
Place of birth for the foreign-born population - Egypt (%)
Place of birth for the foreign-born population - Morocco (%)
Place of birth for the foreign-born population - Sudan (%)
Place of birth for the foreign-born population - Other Northern Africa (%)
Place of birth for the foreign-born population - South Africa (%)
Place of birth for the foreign-born population - Other Southern Africa (%)
Place of birth for the foreign-born population - Cabo Verde (%)
Place of birth for the foreign-born population - Ghana (%)
Place of birth for the foreign-born population - Liberia (%)
Place of birth for the foreign-born population - Nigeria (%)
Place of birth for the foreign-born population - Senegal (%)
Place of birth for the foreign-born population - Sierra Leone (%)
Place of birth for the foreign-born population - Other Western Africa (%)
Place of birth for the foreign-born population - Australia (%)
Place of birth for the foreign-born population - New Zealand (%)
Place of birth for the foreign-born population - Fiji (%)
Place of birth for the foreign-born population - Micronesia (%)
Place of birth for the foreign-born population - Bahamas (%)
Place of birth for the foreign-born population - Barbados (%)
Place of birth for the foreign-born population - Cuba (%)
Place of birth for the foreign-born population - Dominica (%)
Place of birth for the foreign-born population - Dominican Republic (%)
Place of birth for the foreign-born population - Grenada (%)
Place of birth for the foreign-born population - Haiti (%)
Place of birth for the foreign-born population - Jamaica (%)
Place of birth for the foreign-born population - St. Vincent and the Grenadines (%)
Place of birth for the foreign-born population - Trinidad and Tobago (%)
Place of birth for the foreign-born population - West Indies (%)
Place of birth for the foreign-born population - Other Caribbean (%)
Place of birth for the foreign-born population - Belize (%)
Place of birth for the foreign-born population - Costa Rica (%)
Place of birth for the foreign-born population - El Salvador (%)
Place of birth for the foreign-born population - Guatemala (%)
Place of birth for the foreign-born population - Honduras (%)
Place of birth for the foreign-born population - Mexico (%)
Place of birth for the foreign-born population - Nicaragua (%)
Place of birth for the foreign-born population - Panama (%)
Place of birth for the foreign-born population - Other Central America (%)
Place of birth for the foreign-born population - Argentina (%)
Place of birth for the foreign-born population - Bolivia (%)
Place of birth for the foreign-born population - Brazil (%)
Place of birth for the foreign-born population - Chile (%)
Place of birth for the foreign-born population - Colombia (%)
Place of birth for the foreign-born population - Ecuador (%)
Place of birth for the foreign-born population - Guyana (%)
Place of birth for the foreign-born population - Peru (%)
Place of birth for the foreign-born population - Uruguay (%)
Place of birth for the foreign-born population - Venezuela (%)
Place of birth for the foreign-born population - Other South America (%)
Place of birth for the foreign-born population - Canada (%)
Place of birth for the foreign-born population - Other Northern America (%)
Place of birth for the foreign-born population - Other (%)
Latest news about races in Brunswick, OH collected exclusively by city-data.com from local newspapers, TV, and radio stations
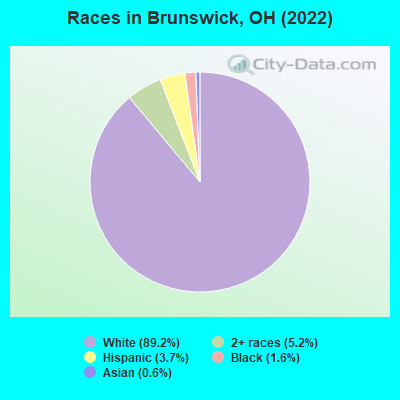
According to 2022 data, the most numerous races in Brunswick, OH are White alone (31,707 residents), Black alone (570 residents), and Two or more races (1,830 residents). 95.4% of Brunswick residents speak English at home. 3.7% of Brunswick, OH residents are foreign-born (2.0% born in Europe, 0.6% born in Asia, 0.4% born in Africa), which is 9.1% less than the foreign-born rate of 4.0% across the entire state of Ohio.
Race distribution in Brunswick
2000 2022
9,538,111 84.0% White alone 1,290,662 11.4% Black alone 217,123 1.9% Hispanic 137,770 1.2% Two or more races 131,670 1.2% Asian alone 21,985 0.2% American Indian alone 13,483 0.1% Other race alone 2,336 0.02% Native Hawaiian and Other
8,948,793 76.1% White alone 1,401,403 11.9% Black alone 529,291 4.5% Two or more races 517,232 4.4% Hispanic 293,387 2.5% Asian alone 52,805 0.4% Other race alone 9,785 0.08% American Indian alone 3,362 0.03% Native Hawaiian and Other
Income and house value in Brunswick Median household income in 2022 $81,462 White non-Hispanic householders$67,864 Black householders$43,046 Asian householders$129,789 Some other race householders$62,806 Two or more races householders$78,577 Hispanic or Latino race householdersMedian 2022 house value $237,209 White Non-Hispanic householders$246,649 Black or African American householders$240,356 American Indian or Alaska Native householders $308,180 Asian householders$291,399 Some other race householders$238,782 Two or more races householders$276,191 Hispanic or Latino householders
Median age by race in Brunswick
42.4 Median age for White residents42.7 42.7 24.6 Median age for Black or African American residents29.5 18.9 -676,818,950.3 Median age for American Indian / Alaska Native residents-685,185,184.5 -658,163,264.6 41.2 Median age for Asian residents61.3 41.6 -666,666,666.0 Median age for Native Hawaiian / Pacific Islander residents-666,666,666.0 -666,666,666.0 33.5 Median age for Other race residents41.2 41.8 22.4 Median age for Two or more races residents19.4 32.1 42.6 Median age for White alone residents42.9 42.8 29.3 Median age for Hispanic or Latino residents19.6 47.2
Owner/renter occupied households by race in Brunswick
House owners and renters - White residents 10,192 73.7% Owner occupied3,639 26.3% Renter occupiedHouse owners and renters - Black or African American residents 75 40.3% Owner occupied111 59.7% Renter occupiedHouse owners and renters - Asian residents 17 11.0% Owner occupied136 89.0% Renter occupiedHouse owners and renters - Other race residents 57 62.8% Owner occupied34 37.2% Renter occupiedHouse owners and renters - Two or more races residents 296 77.2% Owner occupied88 22.8% Renter occupiedHouse owners and renters - White alone residents 10,154 73.5% Owner occupied3,658 26.5% Renter occupiedHouse owners and renters - Hispanic or Latino residents 232 78.2% Owner occupied65 21.8% Renter occupied
Language usage in Brunswick
English speakers - Total 95.4% of residents of Brunswick speak English at home.
1.7% of residents speak Spanish at home 337 59.2% Speak English very well232 40.8% Speak English less than very well3.1% of residents speak other language at home 479 45.7% Speak English very well569 54.3% Speak English less than very well
English speakers - Born in the United States 98.0% of residents of Brunswick speak English at home.
1.5% of residents speak Spanish at home 68 100.0% Speak English very well0.6% of residents speak other language at home 25 100.0% Speak English very well
English speakers - Native, born elsewhere 48.2% of residents of Brunswick speak English at home.
0.8% of residents speak Spanish at home 2 100.0% Speak English very well8.9% of residents speak other language at home 22 100.0% Speak English very well
English speakers - Foreign-born 47.4% of residents of Brunswick speak English at home.
8.4% of residents speak Spanish at home 78 60.9% Speak English very well50 39.1% Speak English less than very well46.5% of residents speak other language at home 270 38.2% Speak English very well437 61.8% Speak English less than very well
White (Caucasian) - Speak only English Native:
98.4% (29,053)Foreign-born:
50.0% (523)
White (Caucasian) - Speak another language Native:
1.6% (461)Foreign-born:
45.8% (479)
Black or African American - Speak only English Native:
99.8% (538)Foreign-born:
64.8% (101)
American Indian / Alaska Native - Speak only English Native:
89.9% (23)Foreign-born:
100.0% (1)
Asian - Speak another language Native:
100.0% (26)Foreign-born:
83.7% (124)
Other race - Speak only English Native:
49.0% (59)Foreign-born:
33.2% (26)
Other race - Speak another language Native:
51.6% (63)Foreign-born:
59.3% (46)
Two or more races - Speak another language Native:
2.9% (58)Foreign-born:
100.0% (40)
White alone - Speak only English Native:
98.5% (28,879)Foreign-born:
48.0% (512)
White alone - Speak another language Native:
1.5% (443)Foreign-born:
47.2% (503)
Hispanic or Latino - Speak only English Native:
72.4% (743)Foreign-born:
48.2% (94)
Hispanic or Latino - Speak another language Native:
21.7% (223)Foreign-born:
55.2% (108)
Foreign-born residents in Brunswick 1,303 residents are foreign born (2.0% Europe , 0.6% Asia , 0.4% Africa ).
Marital status for residents in Brunswick Marital status - White (Caucasian) population 15 years and over
Males 27.8% Never married56.2% Now married2.2% Separated3.0% Widowed10.7% DivorcedFemales 27.8% Never married50.4% Now married0.7% Separated7.7% Widowed13.5% DivorcedWomen who gave birth in the past 12 months Now married:
88.6% (271)Unmarried:
11.4% (35)
Women who did not give birth in the past 12 months Now married:
41.5% (2,920)Unmarried:
58.5% (4,110)
Marital status - Black or African American population 15 years and over
Males 48.5% Never married42.5% Now married0.0% Separated0.0% Widowed9.0% DivorcedFemales 46.0% Never married19.6% Now married0.0% Separated13.5% Widowed20.9% DivorcedWomen who did not give birth in the past 12 months Now married:
22.5% (59)Unmarried:
77.5% (202)
Marital status - Asian population 15 years and over
Males 36.4% Never married45.5% Now married0.0% Separated0.0% Widowed18.2% DivorcedFemales 39.3% Never married42.1% Now married0.0% Separated1.4% Widowed17.1% DivorcedWomen who did not give birth in the past 12 months Now married:
45.1% (46)Unmarried:
54.9% (56)
Marital status - Other race population 15 years and over
Males 30.2% Never married56.2% Now married0.0% Separated0.0% Widowed13.5% DivorcedFemales 18.2% Never married56.4% Now married0.0% Separated0.0% Widowed25.5% DivorcedWomen who did not give birth in the past 12 months Now married:
100.0% (26)Unmarried:
0.0% (0)
Marital status - Two or more races population 15 years and over
Males 45.8% Never married42.8% Now married0.0% Separated0.0% Widowed11.4% DivorcedFemales 41.3% Never married40.0% Now married0.0% Separated15.4% Widowed3.3% DivorcedWomen who did not give birth in the past 12 months Now married:
42.1% (199)Unmarried:
57.9% (274)
Marital status - White alone, not Hispanic / Latino population 15 years and over
Males 27.6% Never married56.5% Now married2.2% Separated3.0% Widowed10.7% DivorcedFemales 27.7% Never married50.4% Now married0.7% Separated7.7% Widowed13.5% DivorcedWomen who gave birth in the past 12 months Now married:
88.2% (262)Unmarried:
11.8% (35)
Women who did not give birth in the past 12 months Now married:
41.5% (2,912)Unmarried:
58.5% (4,100)
Marital status - Hispanic or Latino population 15 years and over
Males 61.4% Never married25.2% Now married0.0% Separated3.9% Widowed9.5% DivorcedFemales 33.6% Never married43.4% Now married0.0% Separated13.9% Widowed9.1% DivorcedWomen who gave birth in the past 12 months Now married:
100.0% (13)Unmarried:
0.0% (0)
Women who did not give birth in the past 12 months Now married:
48.9% (159)Unmarried:
51.1% (166)
Ancestries in Brunswick
2,252 17.1% German1,553 11.8% Irish1,394 10.6% English1,166 8.9% Polish1,004 7.6% Italian914 6.9% American575 4.4% Hungarian492 3.7% Slovak256 1.9% European209 1.6% Ukrainian153 1.2% Lebanese128 1.0% Greek120 0.9% Slovene106 0.8% African104 0.8% Scottish90 0.7% Eastern European82 0.6% Czech77 0.6% Serbian74 0.6% Romanian73 0.6% Dutch65 0.5% Croatian60 0.5% Yugoslavian60 0.5% Palestinian59 0.4% Russian48 0.4% Scotch-Irish45 0.3% Canadian33 0.3% French32 0.2% Austrian25 0.2% Bulgarian24 0.2% Northern European18 0.1% Egyptian16 0.1% Finnish12 0.09% Armenian11 0.08% French Canadian11 0.08% Slavic10 0.08% Welsh9 0.07% British8 0.06% Latvian8 0.06% Czechoslovakian6 0.05% Nigerian5 0.04% Lithuanian2 0.02% Arab
Geographical mobility in Brunswick Same house 1 year ago 29,616 93.3% White (Caucasian)552 80.0% Black or African American29 100.0% American Indian / Alaska Native172 100.0% Asian171 78.4% Other race2,365 93.1% Two or more races29,368 93.1% White alone, not Hispanic / Latino1,143 89.7% Hispanic or LatinoMoved within same county 1,037 3.3% White / Caucasian28 4.0% Black or African American68 2.7% Two or more races1,051 3.3% White alone, not Hispanic / Latino20 1.6% Hispanic or LatinoMoved within same state 981 3.1% White / Caucasian42 6.1% Black or African American59 27.0% Other race140 5.5% Two or more races1,000 3.2% White alone, not Hispanic / Latino140 11.0% Hispanic or LatinoMoved from different state 120 0.4% White / Caucasian84 12.2% Black or African American122 0.4% White alone, not Hispanic / LatinoMoved from abroad 8 0.0% White8 0.0% White alone, not Hispanic / Latino
Children Nativity (place of birth) in Brunswick
Children under 6 years - Living with two parents Both parents native 1,360 100.0% NativeBoth parents foreign-born 15 100.0% NativeOne native, one foreign-born parent 137 100.0% NativeChildren under 6 years - Living with one parent Native parent 295 100.0% NativeChildren 6 to 17 years - Living with two parents Both parents native 2,932 98.5% Native46 1.5% Foreign-bornBoth parents foreign-born 74 65.1% Native40 34.9% Foreign-bornOne native, one foreign-born parent 173 100.0% NativeChildren 6 to 17 years - Living with one parent Native parent 2,251 100.0% NativeForeign-born parent 7 50.4% Native7 49.6% Foreign-born
Grandparents responsible for own grandchildren in Brunswick
Grandparents (30 to 59 years) White / Caucasian 75 54.2% Responsible for grandchildren63 45.8% Not responsible for grandchildrenBlack or African American 32 100.0% Responsible for grandchildrenOther race 1 100.0% Not responsible for grandchildrenTwo or more races 15 100.0% Not responsible for grandchildrenWhite alone, not Hispanic / Latino 75 54.2% Responsible for grandchildren63 45.8% Not responsible for grandchildrenHispanic or Latino 12 100.0% Not responsible for grandchildrenGrandparents (60 years and over) White / Caucasian 145 55.5% Responsible for grandchildren116 44.5% Not responsible for grandchildrenWhite alone, not Hispanic / Latino 143 54.9% Responsible for grandchildren117 45.1% Not responsible for grandchildrenHispanic or Latino 3 100.0% Responsible for grandchildren