Youngstown: Fire Incidents, Florida (FL)
Where are fire incidents reported in Youngstown, FL
Something went wrong! Please refresh the page.
|
| |||||||||||||||||||||||||||||||||||||||||||||||||||||||||||||||||||||||||||||||||||||||||||||||||||||||||||||
2004 - 2018 National Fire Incident Reporting System (NFIRS) incidents
- Incident types reported to NFIRS in Youngstown, FL
- 1,88261.8%Rescue & EMS
- 35911.8%Fire
- 2849.3%Service Call
- 2718.9%Good Intent Call
- 1635.4%Hazardous Condition
- 612.0%False Alarm
- 180.6%Special Incident
- 40.1%Severe Weather
- Fire incident types reported to NFIRS in Youngstown, FL
- 15543.2%Outside Fires
- 12534.8%Structure Fires
- 7119.8%Mobile Property/Vehicle Fires
- 82.2%Other
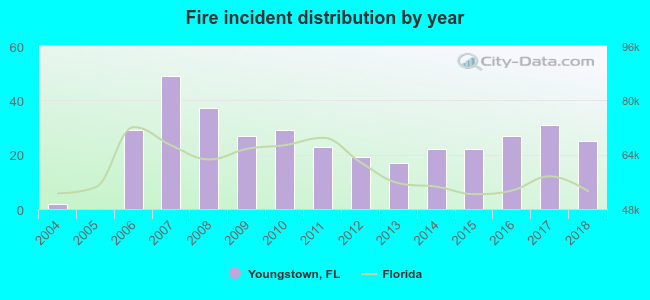 Based on the data from the years 2004 - 2018 the average number of fires per year is 24. The highest number of fire incidents - 49 took place in 2007, and the least - 0 in 2005. The data has an increasing trend.
The average number of yearly fire incidents per 10k residents in Youngstown, FL compared to nearest cities:
(Note: Based on data for the last 3 years, including only cities with population 5,000 and above)
| Youngstown: | 35.9 |
| Lynn Haven: | 21.9 |
| Southport: | 32.9 |
| Springfield: | 32.8 |
| Callaway: | 50.9 |
| Panama City: | 49.7 |
| Panama City Beaches: | 1.0 |
| Panama City Beach: | 135.7 |
| Marianna: | 169.4 |

 29.2% incidents where reported in the morning and 70.8% in the evening. The most fires (17.0%) took place on Wednesday, and the least (12.3%) on Tuesday.
 Based on the 359 fire incident reports from years 2004 - 2018 most fires (13.4%) took place during May, and the least (3.9%) in September.
 Out of all 3,044 cases reported during the years 2004 - 2018, the most belonged to the categories: Rescue & EMS (61.8%), Fire (11.8%), and Service Call (9.3%).
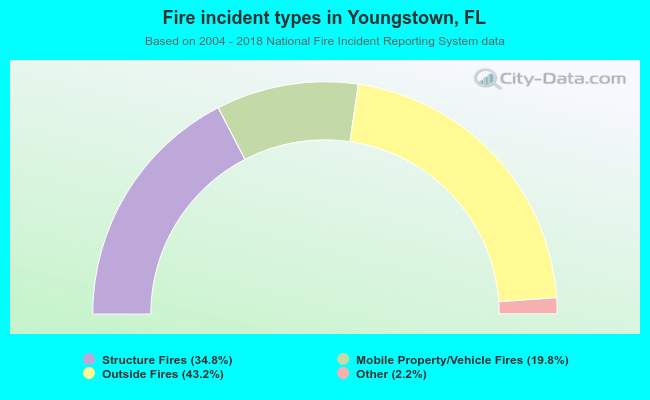 When looking into fire subcategories, the most reports belonged to: Outside Fires (43.2%), and Structure Fires (34.8%).