Callaway: Fire Incidents, Florida (FL)
Where are fire incidents reported in Callaway, FL
Something went wrong! Please refresh the page.
| Fire incidents reported | |
|---|---|
| Sreet name | Count |
| TYNDALL PKY | 342 |
| 22 HWY | 146 |
| KIMBREL AVE | 98 |
| CHERRY ST | 86 |
| GAY AVE | 76 |
| STAR AVE | 72 |
| BERTHE AVE | 56 |
| FOX AVE | 56 |
| COMET AVE | 50 |
| SIMS AVE | 44 |
| 22 A HWY | 36 |
| 2297 HWY | 34 |
| TRAM RD | 34 |
| PRIDGEN ST | 32 |
| ALPINE WAY | 30 |
| CARUSO DR | 30 |
| LAKE DR | 30 |
| WALLACE RD | 30 |
| BOB LITTLE RD | 28 |
| LANCE ST | 28 |
| CHESTNUT WAY | 26 |
| DOGWOOD WAY | 24 |
| HARVEY ST | 24 |
| OLD BICYCLE RD | 24 |
| NELLE ST | 22 |
| OLD ALLANTON RD | 22 |
| SANDY CREEK RD | 22 |
| 11TH ST | 20 |
| ALVIE HOLMES RD | 20 |
| CALLAWAY DR | 20 |
| Other | 140 |
2002 - 2018 National Fire Incident Reporting System (NFIRS) incidents
- Incident types reported to NFIRS in Callaway, FL
- 6,65052.2%Rescue & EMS
- 1,70213.4%Fire
- 1,57712.4%Service Call
- 1,2179.6%Good Intent Call
- 1,0408.2%Hazardous Condition
- 4503.5%False Alarm
- 510.4%Severe Weather
- 420.3%Special Incident
- Fire incident types reported to NFIRS in Callaway, FL
- 73042.9%Structure Fires
- 68140.0%Outside Fires
- 22012.9%Mobile Property/Vehicle Fires
- 714.2%Other
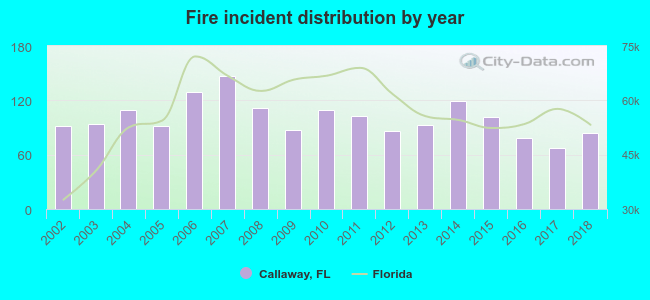 Based on the data from the years 2002 - 2018 the average number of fires per year is 100. The highest number of fires - 147 took place in 2007, and the least - 67 in 2017. The data has a dropping trend.
The average number of yearly fire incidents per 10k residents in Callaway, FL compared to nearest cities:
(Note: Based on data for the last 3 years, including only cities with population 5,000 and above)
| Callaway: | 50.9 |
| Springfield: | 32.8 |
| Panama City: | 49.7 |
| Lynn Haven: | 21.9 |
| Panama City Beaches: | 1.0 |
| Panama City Beach: | 135.7 |
| Southport: | 32.9 |
| Youngstown: | 35.9 |
| Cypress: | 4.3 |
 The median response time based on all reported fire incidents is 5 minutes. This is lower than the state median value.
The median response time in Callaway, FL compared to nearest cities:
(Note: Based on data for all years, including only cities with at least 500 fire incidents)
| Callaway: | 5 minutes |
| Springfield: | 4 minutes |
| Panama City: | 4 minutes |
| Lynn Haven: | 3 minutes |
| Panama City Beach: | 4 minutes |
| Blountstown: | 4 minutes |
| Freeport: | 8 minutes |
| Chipley: | 10 minutes |
| Bonifay: | 8 minutes |
 According to the data from the years 2002 - 2018 the average number of fire-related yearly casualties is 0. The highest number of reported injuries - 1 took place in 2007, and the lowest - 0 in 2002. The data has a growing trend.
The average number of casualties per 1,000 fire incidents is 2. This indicator was the highest - 12 in 2018, and the lowest 0 in 2002. The trend for injuries per 1,000 fire incidents is increasing. Compared to the Florida value the number of injuries per 1,000 fire incidents is much lower.
According to the data from the years 2002 - 2018 the average number of fire-related yearly casualties is 0. The highest number of reported injuries - 1 took place in 2007, and the lowest - 0 in 2002. The data has a growing trend.
The average number of casualties per 1,000 fire incidents is 2. This indicator was the highest - 12 in 2018, and the lowest 0 in 2002. The trend for injuries per 1,000 fire incidents is increasing. Compared to the Florida value the number of injuries per 1,000 fire incidents is much lower.Casualties per 1,000 incidents in Callaway, FL compared to nearest cities:
(Note: Based on data for all years, including only cities with at least 500 fire incidents)
| Callaway: | 1.8 |
| Springfield: | 6.2 |
| Panama City: | 13.2 |
| Lynn Haven: | 9.5 |
| Panama City Beach: | 3.4 |
| Blountstown: | 1.4 |
| Freeport: | 3.1 |
| Chipley: | 0.0 |
| Bonifay: | 2.9 |
 31.8% incidents where reported in the morning and 68.2% in the evening. The most fires (17.2%) took place on Saturday, and the least (11.6%) on Thursday.
 According to the 1,702 fires from years 2002 - 2018 most fires (10.6%) took place during May, and the least (6.2%) in August.
 Out of all 12,737 cases reported during the years 2002 - 2018, the most belonged to the categories: Rescue & EMS (52.2%), Fire (13.4%), and Service Call (12.4%).
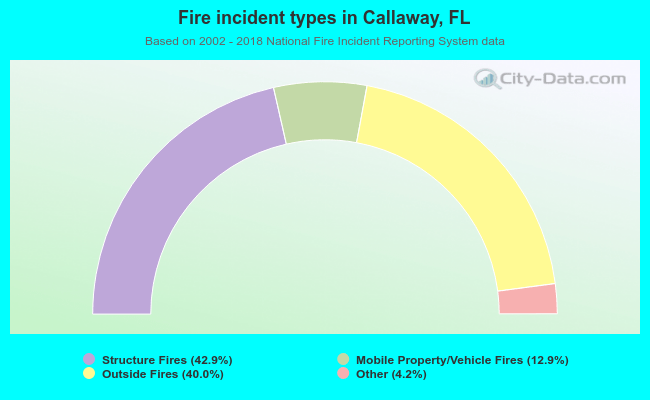 When looking into fire subcategories, the most incidents belonged to: Structure Fires (42.9%), and Outside Fires (40.0%).