Wyckoff: Fire Incidents, New Jersey (NJ)
Where are fire incidents reported in Wyckoff, NJ
Something went wrong! Please refresh the page.
| Fire incidents reported | |
|---|---|
| Sreet name | Count |
| SICOMAC AVE | 358 |
| WYCKOFF AVE | 206 |
| FRANKLIN AVE | 162 |
| CEDAR HILL AVE | 66 |
| RUSSELL AVE | 54 |
| MOUNTAIN AVE | 52 |
| OLD POST RD | 52 |
| BROOKSIDE AVE | 34 |
| GODWIN AVE | 34 |
| RAVINE AVE | 34 |
| CARLTON RD | 30 |
| ROUTE 208 HWY | 30 |
| BRIDLE PATH | 26 |
| CLINTON AVE | 24 |
| HIGHVIEW DR | 24 |
| MEADOWBROOK RD | 22 |
| CRESCENT AVE | 20 |
| LAKEVIEW DR | 20 |
| PATTON PL | 20 |
| WEYMOUTH DR | 20 |
| ALEX CT | 18 |
| BREWSTER RD | 18 |
| CHARNWOOD DR | 18 |
| CRANKSHAW PL | 18 |
| FREDERICK CT | 18 |
| GOFFLE RD | 18 |
| MAIN ST | 18 |
| AUBURN ST | 16 |
| CARRIAGE LN | 16 |
| HOWARD ST | 16 |
2003 - 2018 National Fire Incident Reporting System (NFIRS) incidents
- Incident types reported to NFIRS in Wyckoff, NJ
- 1,62935.2%Hazardous Condition
- 1,38930.0%Fire
- 1,04122.5%False Alarm
- 2876.2%Good Intent Call
- 1884.1%Service Call
- 531.1%Rescue & EMS
- 330.7%Severe Weather
- 80.2%Overpressure Rupture
- Fire incident types reported to NFIRS in Wyckoff, NJ
- 1,11480.2%Structure Fires
- 17812.8%Outside Fires
- 836.0%Mobile Property/Vehicle Fires
- 141.0%Other
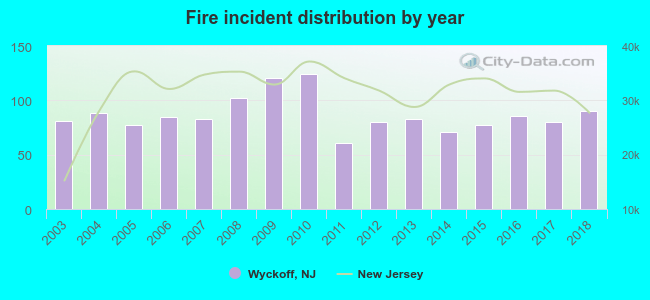 Based on the data from the years 2003 - 2018 the average number of fire incidents per year is 87. The highest number of reported fires - 124 took place in 2010, and the least - 61 in 2011. The data has an increasing trend.
The average number of yearly fire incidents per 10k residents in Wyckoff, NJ compared to nearest cities:
(Note: Based on data for the last 3 years, including only cities with population 5,000 and above)
| Wyckoff: | 51.7 |
| Midland Park: | 19.6 |
| Franklin Lakes: | 20.3 |
| Waldwick: | 16.8 |
| North Haledon: | 30.5 |
| Hawthorne: | 15.5 |
| Allendale: | 31.9 |
| Ridgewood: | 22.1 |
| Glen Rock: | 27.7 |
 The median response time based on all reported fire incidents is 5 minutes. This is about the same as the New Jersey median value.
The median response time in Wyckoff, NJ compared to nearest cities:
(Note: Based on data for all years, including only cities with at least 500 fire incidents)
| Wyckoff: | 5 minutes |
| Hawthorne: | 5 minutes |
| Ridgewood: | 3 minutes |
| Oakland: | 5 minutes |
| Ramsey: | 7 minutes |
| Fair Lawn: | 5 minutes |
| Paterson: | 4 minutes |
| Wayne: | 5 minutes |
| Elmwood Park: | 5 minutes |
 27.9% incidents where reported in the morning and 72.1% in the evening. The most fires (16.6%) took place on Sunday, and the least (13.1%) on Wednesday.
 According to the 1,389 incident reports from years 2003 - 2018 most fires (11.3%) took place during November, and the least (5.7%) in August.
 Out of all 4,629 cases reported during the years 2003 - 2018, the most belonged to the categories: Hazardous Condition (35.2%), Fire (30.0%), and False Alarm (22.5%).
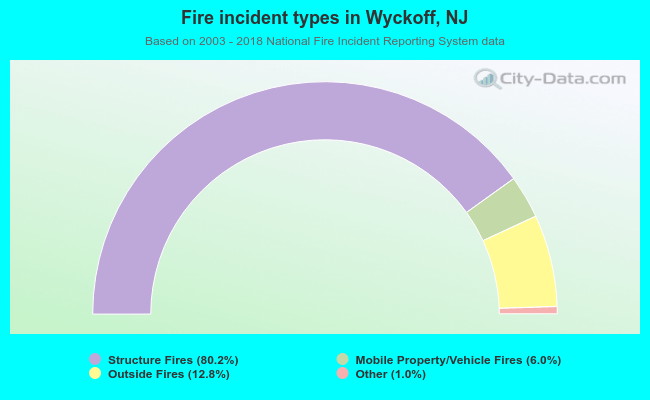 When looking into fire subcategories, the most incidents belonged to: Structure Fires (80.2%), and Outside Fires (12.8%).