Midland Park: Fire Incidents, New Jersey (NJ)
Where are fire incidents reported in Midland Park, NJ
Something went wrong! Please refresh the page.
|
| |||||||||||||||||||||||||||||||||||||||||||||||||||||||||||||||||||||||||||||||||||||||||||||||||||||||||||||
2002 - 2018 National Fire Incident Reporting System (NFIRS) incidents
- Incident types reported to NFIRS in Midland Park, NJ
- 44837.3%Hazardous Condition
- 36530.4%False Alarm
- 21517.9%Fire
- 887.3%Service Call
- 564.7%Good Intent Call
- 242.0%Rescue & EMS
- 40.3%Overpressure Rupture
- Fire incident types reported to NFIRS in Midland Park, NJ
- 12859.5%Structure Fires
- 4219.5%Outside Fires
- 2712.6%Mobile Property/Vehicle Fires
- 188.4%Other
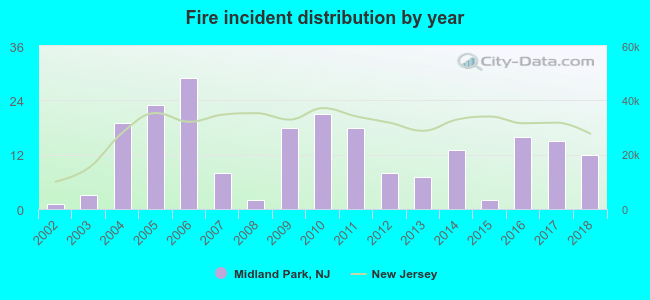 Based on the data from the years 2002 - 2018 the average number of fires per year is 13. The highest number of fires - 29 took place in 2006, and the least - 1 in 2002. The data has a growing trend.
The average number of yearly fire incidents per 10k residents in Midland Park, NJ compared to nearest cities:
(Note: Based on data for the last 3 years, including only cities with population 5,000 and above)
| Midland Park: | 19.6 |
| Wyckoff: | 51.7 |
| Ridgewood: | 22.1 |
| Waldwick: | 16.8 |
| Glen Rock: | 27.7 |
| Hawthorne: | 15.5 |
| Allendale: | 31.9 |
| North Haledon: | 30.5 |
| Franklin Lakes: | 20.3 |
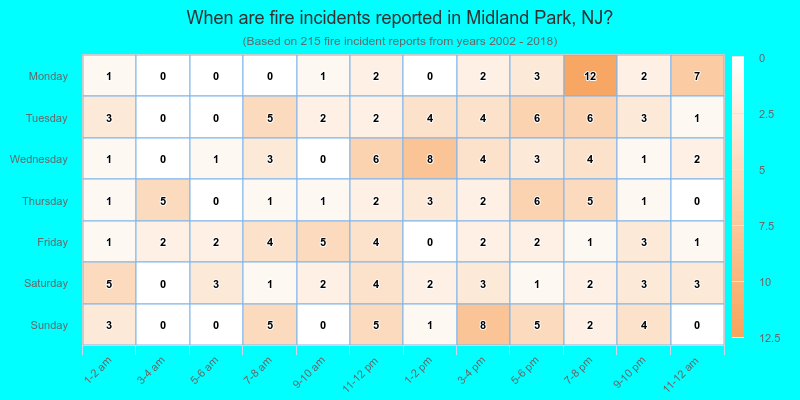
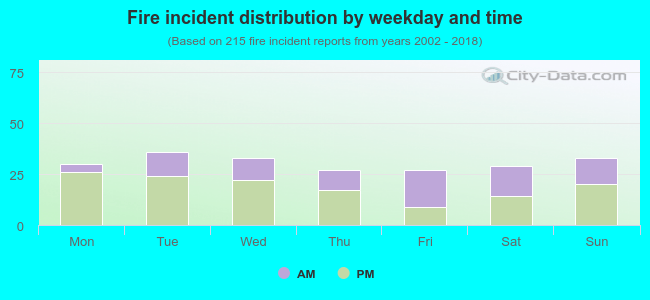 38.6% incidents where reported in the morning and 61.4% in the evening. The most fires (16.7%) took place on Tuesday, and the least (12.6%) on Thursday.
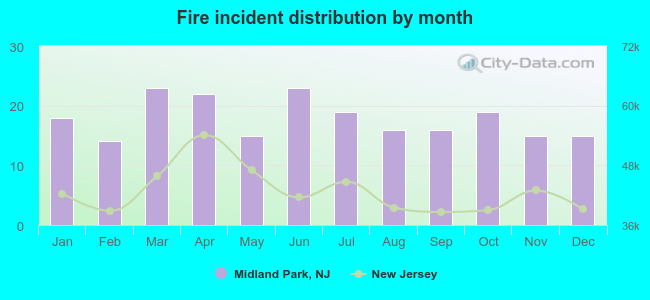 Based on the 215 fire incidents from years 2002 - 2018 most fires (10.7%) took place during March, and the least (6.5%) in February.
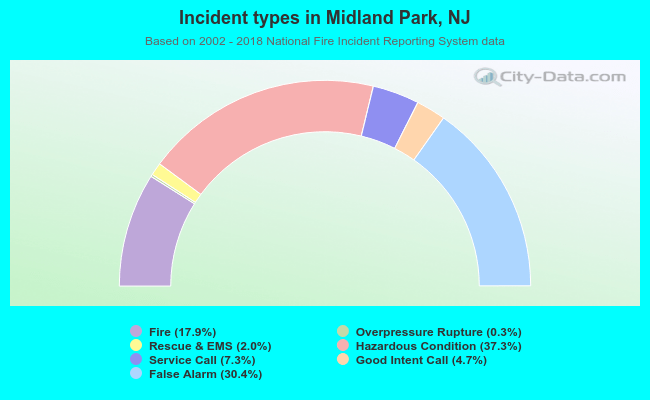 Out of all 1,200 cases reported during the years 2002 - 2018, the most belonged to the categories: Hazardous Condition (37.3%), False Alarm (30.4%), and Fire (17.9%).
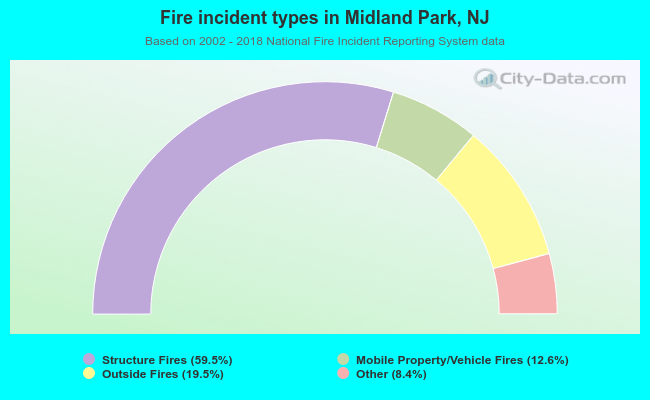 When looking into fire subcategories, the most incidents belonged to: Structure Fires (59.5%), and Outside Fires (19.5%).