Woburn: Fire Incidents, Massachusetts (MA)
Where are fire incidents reported in Woburn, MA
Something went wrong! Please refresh the page.
| Fire incidents reported | |
|---|---|
| Sreet name | Count |
| MAIN ST | 380 |
| MISHAWUM RD | 234 |
| NEW BOSTON ST | 104 |
| COMMERCE WAY | 98 |
| WASHINGTON ST | 92 |
| KIMBALL CT | 86 |
| MONTVALE AVE | 80 |
| CAMBRIDGE RD | 74 |
| PRESIDENTIAL WY | 72 |
| PRESIDENTIAL WAY | 70 |
| ROUTE 93 HWY | 66 |
| SALEM ST | 58 |
| LEXINGTON ST | 46 |
| WESTGATE DR | 42 |
| PLEASANT ST | 40 |
| W CUMMINGS PARK | 40 |
| PROSPECT ST | 38 |
| WINN ST | 38 |
| INWOOD DR | 36 |
| ELM ST | 34 |
| MIDDLESEX CANAL PARK | 34 |
| BEDFORD RD | 32 |
| WARREN AVE | 32 |
| WILDWOOD AVE | 32 |
| CAMPBELL ST | 30 |
| ROUTE 128 HWY | 30 |
| FORBES RD | 24 |
| GREEN ST | 24 |
| MILL ST | 24 |
| TOTMAN DR | 24 |
2002 - 2018 National Fire Incident Reporting System (NFIRS) incidents
- Incident types reported to NFIRS in Woburn, MA
- 17,46961.8%Rescue & EMS
- 3,79213.4%False Alarm
- 2,2077.8%Service Call
- 1,9366.8%Fire
- 1,5105.3%Good Intent Call
- 1,0873.8%Hazardous Condition
- 2190.8%Special Incident
- 460.2%Overpressure Rupture
- Fire incident types reported to NFIRS in Woburn, MA
- 1,06755.1%Structure Fires
- 45923.7%Outside Fires
- 27714.3%Mobile Property/Vehicle Fires
- 1336.9%Other
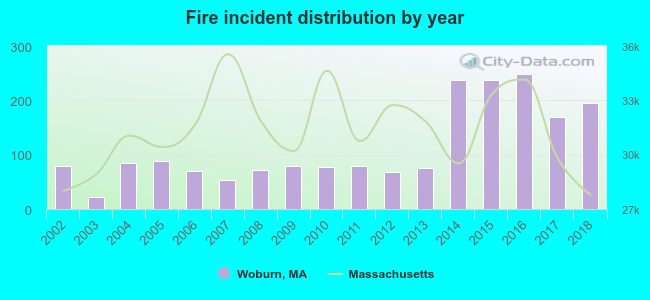 Based on the data from the years 2002 - 2018 the average number of fires per year is 114. The highest number of reported fire incidents - 248 took place in 2016, and the least - 22 in 2003. The data has an increasing trend.
The average number of yearly fire incidents per 10k residents in Woburn, MA compared to nearest cities:
(Note: Based on data for the last 3 years, including only cities with population 5,000 and above)
| Woburn: | 52.0 |
| Winchester: | 12.9 |
| Stoneham: | 58.2 |
| Burlington: | 36.5 |
| Reading: | 29.9 |
| Wakefield: | 21.3 |
| Arlington: | 23.8 |
| Lexington: | 11.5 |
| Melrose: | 6.6 |
 The median response time based on all reported fire incidents is 4 minutes. This is similar to the Massachusetts median value.
The median response time in Woburn, MA compared to nearest cities:
(Note: Based on data for all years, including only cities with at least 500 fire incidents)
| Woburn: | 4 minutes |
| Winchester: | 4 minutes |
| Stoneham: | 3 minutes |
| Burlington: | 4 minutes |
| Reading: | 4 minutes |
| Wakefield: | 2 minutes |
| Arlington: | 3 minutes |
| Lexington: | 5 minutes |
| Medford: | 3 minutes |
 According to the data from the years 2002 - 2018 the average number of fire-related yearly deaths is 0. The highest number of reported deaths - 1 took place in 2003, and the lowest - 0 in 2002. The data has a constant trend.
 According to the data from the years 2002 - 2018 the average number of fire-related yearly casualties is 2. The highest number of reported casualties - 9 took place in 2010, and the lowest - 0 in 2003. The data has a growing trend.
The average number of injuries per 1,000 fire incidents is 17. This indicator was the highest - 117 in 2010, and the lowest 0 in 2003. The trend for casualties per 1,000 incidents is decreasing. Compared to the state value the number of casualties per 1,000 fires is higher.
According to the data from the years 2002 - 2018 the average number of fire-related yearly casualties is 2. The highest number of reported casualties - 9 took place in 2010, and the lowest - 0 in 2003. The data has a growing trend.
The average number of injuries per 1,000 fire incidents is 17. This indicator was the highest - 117 in 2010, and the lowest 0 in 2003. The trend for casualties per 1,000 incidents is decreasing. Compared to the state value the number of casualties per 1,000 fires is higher.Casualties per 1,000 incidents in Woburn, MA compared to nearest cities:
(Note: Based on data for all years, including only cities with at least 500 fire incidents)
| Woburn: | 14.5 |
| Winchester: | 24.3 |
| Stoneham: | 3.8 |
| Burlington: | 7.4 |
| Reading: | 5.2 |
| Wakefield: | 5.8 |
| Arlington: | 8.0 |
| Lexington: | 22.2 |
| Medford: | 8.0 |
 30.6% incidents where reported in the morning and 69.4% in the evening. The most fires (16.1%) took place on Monday, and the least (12.5%) on Tuesday.
 Based on the 1,936 fire incidents from years 2002 - 2018 most fires (11.9%) took place during May, and the least (6.3%) in September.
 Out of all 28,281 cases reported during the years 2002 - 2018, the most belonged to the categories: Rescue & EMS (61.8%), False Alarm (13.4%), and Service Call (7.8%).
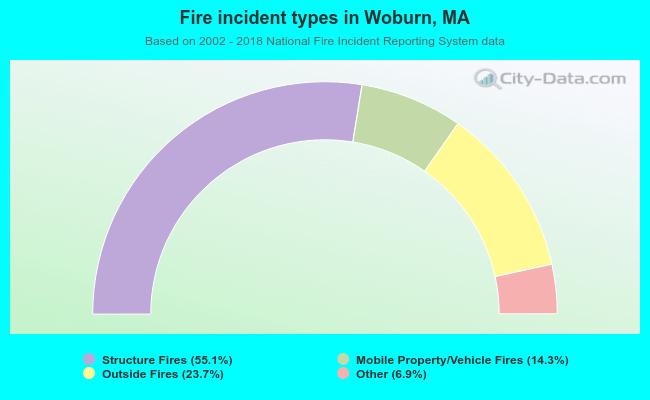 When looking into fire subcategories, the most incidents belonged to: Structure Fires (55.1%), and Outside Fires (23.7%).