Wilmington: Fire Incidents, Ohio (OH)
Where are fire incidents reported in Wilmington, OH
Something went wrong! Please refresh the page.
| Fire incidents reported | |
|---|---|
| Sreet name | Count |
| ROMBACH AV | 106 |
| S SOUTH ST | 100 |
| 73 RT | 54 |
| W MAIN ST | 54 |
| STATE ROUTE 380 | 50 |
| STATE ROUTE 73 | 40 |
| NEW BURLINGTON RD | 34 |
| CUBA RD | 32 |
| PRAIRIE AV | 32 |
| ST RT 68 HWY | 32 |
| W LOCUST ST | 26 |
| E MAIN ST | 22 |
| FARMERS RD | 22 |
| SMITH RD | 22 |
| SR 73 W | 22 |
| COLUMBUS ST | 20 |
| INWOOD RD | 20 |
| SR 134 N | 20 |
| 730 RT | 18 |
| BUCK RUN RD | 18 |
| CENTER RD | 18 |
| GRANT ST | 18 |
| JODIE LN | 18 |
| OGDEN RD | 18 |
| S WALNUT ST | 18 |
| SR 134 S | 18 |
| W SUGARTREE ST | 18 |
| XENIA AV | 18 |
| 44 MILE MARKER I 71 SOUTH | 16 |
| I-71 EXPY | 16 |
| Other | 430 |
2002 - 2018 National Fire Incident Reporting System (NFIRS) incidents
- Incident types reported to NFIRS in Wilmington, OH
- 1,35048.6%Fire
- 76127.4%Rescue & EMS
- 2368.5%Hazardous Condition
- 1756.3%Good Intent Call
- 953.4%Service Call
- 833.0%False Alarm
- 712.6%Severe Weather
- 40.1%Special Incident
- Fire incident types reported to NFIRS in Wilmington, OH
- 55541.1%Structure Fires
- 46834.7%Outside Fires
- 24318.0%Mobile Property/Vehicle Fires
- 846.2%Other
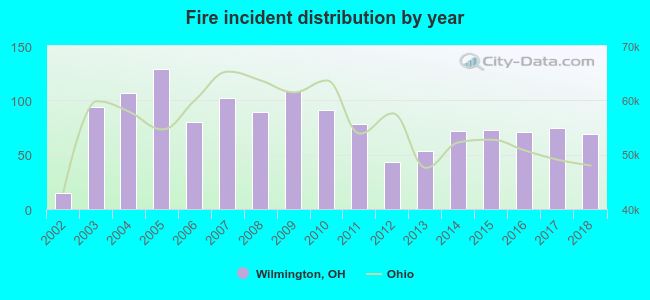 According to the data from the years 2002 - 2018 the average number of fire incidents per year is 79. The highest number of fire incidents - 129 took place in 2005, and the least - 15 in 2002. The data has a rising trend.
The average number of yearly fire incidents per 10k residents in Wilmington, OH compared to nearest cities:
(Note: Based on data for the last 3 years, including only cities with population 5,000 and above)
| Wilmington: | 57.9 |
| Xenia: | 40.1 |
| Bellbrook: | 10.0 |
| Hillsboro: | 158.8 |
| Lebanon: | 29.0 |
| Centerville: | 14.6 |
| Springboro: | 20.9 |
| Beavercreek: | 4.4 |
| Kettering: | 14.8 |
 The median response time based on all reported fire incidents is 8 minutes. This is higher than the state median value.
The median response time in Wilmington, OH compared to nearest cities:
(Note: Based on data for all years, including only cities with at least 500 fire incidents)
| Wilmington: | 8 minutes |
| Blanchester: | 9 minutes |
| Lynchburg: | 11 minutes |
| Jamestown: | 11 minutes |
| Xenia: | 6 minutes |
| Hillsboro: | 11 minutes |
| Jeffersonville: | 11 minutes |
| Centerville: | 7 minutes |
| Springboro: | 6 minutes |
 32.5% incidents where reported in the morning and 67.5% in the evening. The most fires (16.3%) took place on Sunday, and the least (12.7%) on Wednesday.
 According to the 1,350 fire incident reports from years 2002 - 2018 most fires (10.1%) took place during March, and the least (6.6%) in December.
 Out of all 2,777 cases reported during the years 2002 - 2018, the most belonged to the categories: Fire (48.6%), Rescue & EMS (27.4%), and Hazardous Condition (8.5%).
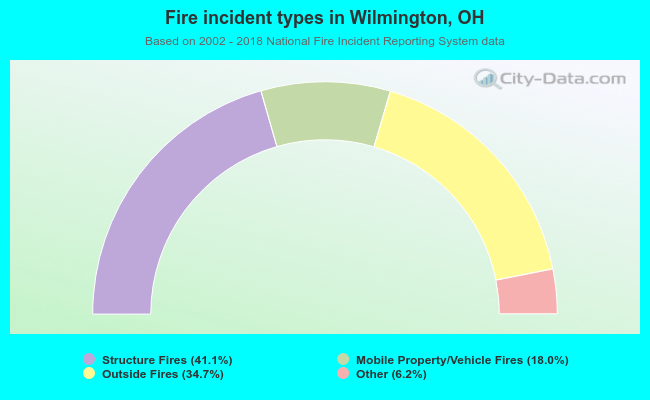 When looking into fire subcategories, the most reports belonged to: Structure Fires (41.1%), and Outside Fires (34.7%).