West Paterson: Fire Incidents, New Jersey (NJ)
Where are fire incidents reported in West Paterson, NJ
Something went wrong! Please refresh the page.
|
| |||||||||||||||||||||||||||||||||||||||||||||||||||||||||||||||||||||||||||||||||||||||||||||||||||||||||||||
2003 - 2018 National Fire Incident Reporting System (NFIRS) incidents
- Incident types reported to NFIRS in West Paterson, NJ
- 24647.7%Hazardous Condition
- 23545.5%Fire
- 173.3%False Alarm
- 101.9%Service Call
- 30.6%Rescue & EMS
- 30.6%Special Incident
- 10.2%Good Intent Call
- 10.2%Severe Weather
- Fire incident types reported to NFIRS in West Paterson, NJ
- 11649.4%Structure Fires
- 5423.0%Mobile Property/Vehicle Fires
- 5021.3%Outside Fires
- 156.4%Other
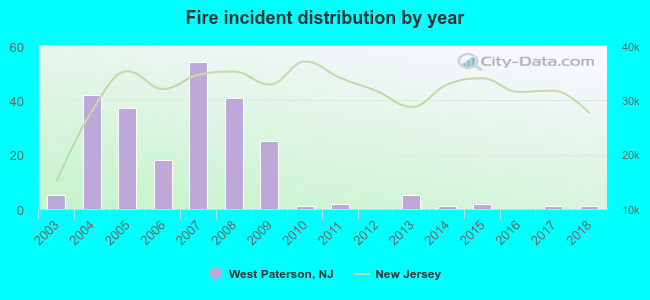 According to the data from the years 2003 - 2018 the average number of fire incidents per year is 15. The highest number of fires - 54 took place in 2007, and the least - 0 in 2012. The data has a decreasing trend.
The average number of yearly fire incidents per 10k residents in West Paterson, NJ compared to nearest cities:
(Note: Based on data for the last 3 years, including only cities with population 5,000 and above)
| West Paterson: | 0.9 |
| Totowa: | 76.8 |
| Little Falls: | 65.6 |
| Paterson: | 52.0 |
| Clifton: | 22.3 |
| Haledon: | 23.2 |
| Cedar Grove: | 13.1 |
| Prospect Park: | 16.3 |
| Upper Montclair: | 11.2 |
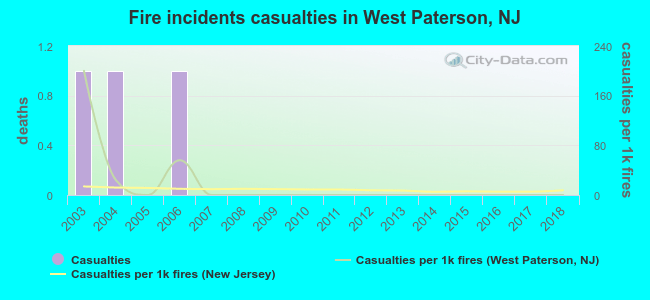 Based on the reports from the years 2003 - 2018 the average number of fire-related yearly casualties is 0. The highest number of reported injuries - 1 took place in 2003, and the lowest - 0 in 2005. The data has a declining trend.
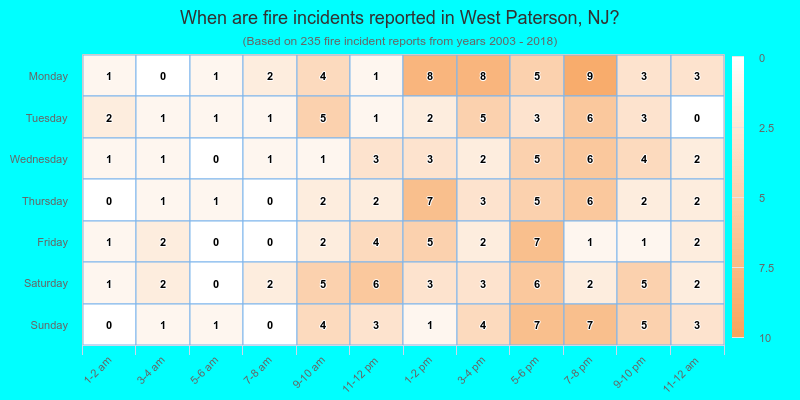
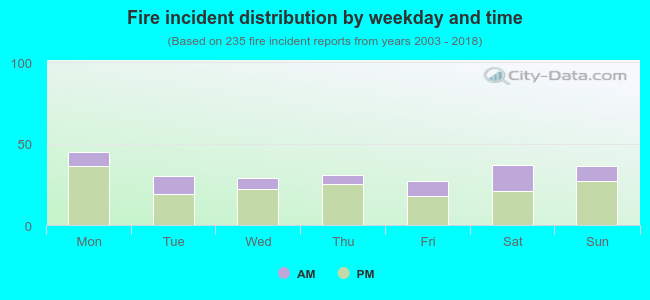 28.5% incidents where reported in the morning and 71.5% in the evening. The most fires (19.1%) took place on Monday, and the least (11.5%) on Friday.
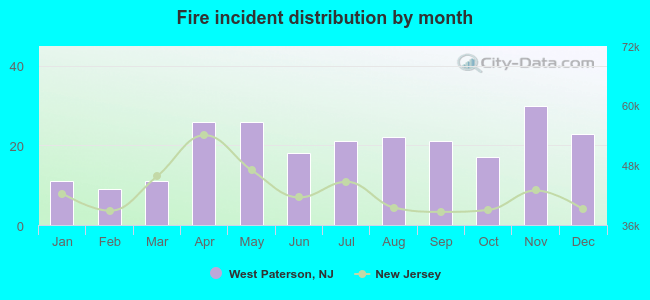 According to the 235 reports from years 2003 - 2018 most fires (12.8%) took place during November, and the least (3.8%) in February.
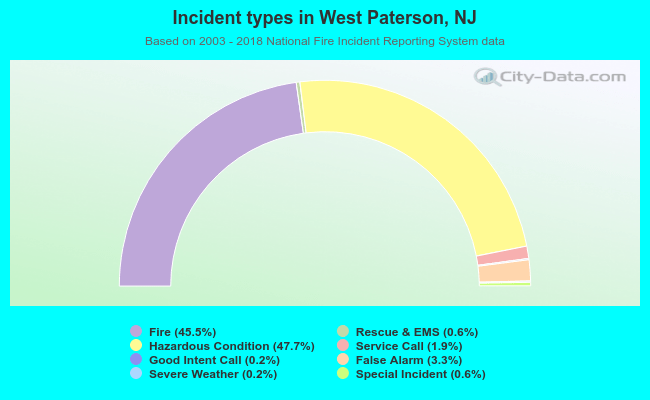 Out of all 516 cases reported during the years 2003 - 2018, the most belonged to the categories: Rescue & EMS (47.7%), Fire (45.5%), and Good Intent Call (3.3%).
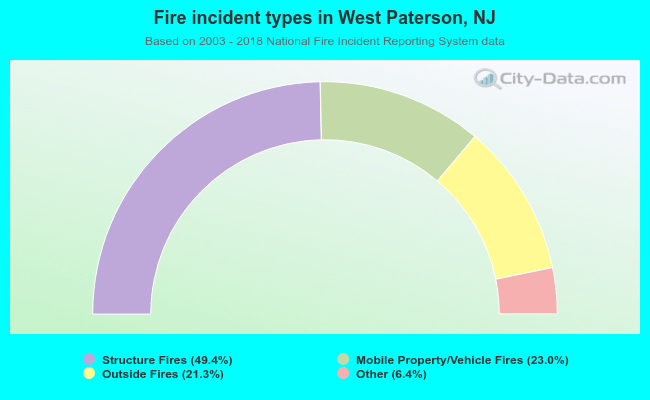 When looking into fire subcategories, the most incidents belonged to: Structure Fires (49.4%), and Mobile Property/Vehicle Fires (23.0%).