Haledon: Fire Incidents, New Jersey (NJ)
Where are fire incidents reported in Haledon, NJ
Something went wrong! Please refresh the page.
|
| |||||||||||||||||||||||||||||||||||||||||||||||||||||||||||||||||||||||||||||||||||||||||||||||||||||||||||||
2002 - 2018 National Fire Incident Reporting System (NFIRS) incidents
- Incident types reported to NFIRS in Haledon, NJ
- 47735.4%Hazardous Condition
- 33524.9%False Alarm
- 26719.8%Fire
- 1007.4%Service Call
- 745.5%Good Intent Call
- 654.8%Rescue & EMS
- 191.4%Overpressure Rupture
- 70.5%Severe Weather
- 30.2%Special Incident
- Fire incident types reported to NFIRS in Haledon, NJ
- 16461.4%Structure Fires
- 7628.5%Outside Fires
- 238.6%Mobile Property/Vehicle Fires
- 41.5%Other
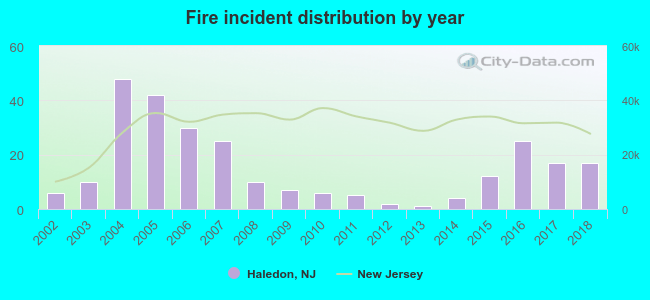 According to the data from the years 2002 - 2018 the average number of fires per year is 16. The highest number of reported fire incidents - 48 took place in 2004, and the least - 1 in 2013. The data has a growing trend.
The average number of yearly fire incidents per 10k residents in Haledon, NJ compared to nearest cities:
(Note: Based on data for the last 3 years, including only cities with population 5,000 and above)
| Haledon: | 23.2 |
| Prospect Park: | 16.3 |
| North Haledon: | 30.5 |
| Paterson: | 52.0 |
| Hawthorne: | 15.5 |
| Totowa: | 76.8 |
| West Paterson: | 0.9 |
| Wayne: | 12.5 |
| Glen Rock: | 27.7 |

 27.3% incidents where reported in the morning and 72.7% in the evening. The most fires (18.0%) took place on Thursday, and the least (11.6%) on Tuesday.
 Based on the 267 fire incident reports from years 2002 - 2018 most fires (12.0%) took place during February, and the least (5.2%) in October.
 Out of all 1,347 cases reported during the years 2002 - 2018, the most belonged to the categories: Hazardous Condition (35.4%), False Alarm (24.9%), and Fire (19.8%).
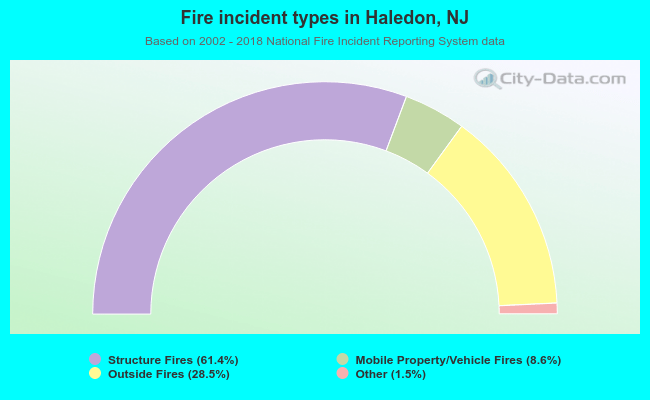 When looking into fire subcategories, the most incidents belonged to: Structure Fires (61.4%), and Outside Fires (28.5%).