Wentzville: Fire Incidents, Missouri (MO)
Where are fire incidents reported in Wentzville, MO
Something went wrong! Please refresh the page.
| Fire incidents reported | |
|---|---|
| Sreet name | Count |
| PEARCE BLVD | 102 |
| WENTZVILLE PKY | 74 |
| HIGHWAY A | 44 |
| MEYER RD | 44 |
| PITMAN AVE | 44 |
| HIGHWAY Z | 42 |
| BUCKNER RD | 38 |
| HIGHWAY N | 36 |
| HIGHWAY P | 36 |
| I 70 | 36 |
| POINT PRAIRIE RD | 36 |
| PEINE RD | 32 |
| DIEHR RD | 30 |
| EVERGREEN CT | 30 |
| HOPEWELL RD | 30 |
| HIDDEN VALLEY DR | 28 |
| DIETRICH RD | 26 |
| INTERSTATE 70 | 26 |
| MEXICO RD | 26 |
| WENTZVILLE PKWY | 26 |
| WILMER RD | 26 |
| JOSEPHVILLE RD | 24 |
| PEINE LAKES DR | 24 |
| HEPPERMAN RD | 22 |
| JUNO DR | 22 |
| SAVANNAH TER | 22 |
| CONTINENTAL DR | 18 |
| CROSSWINDS CT | 18 |
| TOWNVIEW DR | 18 |
| VETERANS MEMORIAL PKY | 18 |
| Other | 811 |
2002 - 2018 National Fire Incident Reporting System (NFIRS) incidents
- Incident types reported to NFIRS in Wentzville, MO
- 6,14844.3%Rescue & EMS
- 2,37617.1%Good Intent Call
- 1,80913.0%Fire
- 1,49610.8%False Alarm
- 1,1508.3%Hazardous Condition
- 8095.8%Service Call
- 570.4%Severe Weather
- 210.2%Overpressure Rupture
- 200.1%Special Incident
- Fire incident types reported to NFIRS in Wentzville, MO
- 93451.6%Structure Fires
- 57531.8%Outside Fires
- 27415.1%Mobile Property/Vehicle Fires
- 261.4%Other
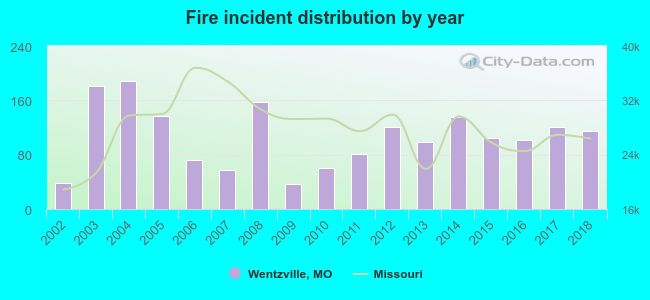 According to the data from the years 2002 - 2018 the average number of fire incidents per year is 106. The highest number of reported fire incidents - 188 took place in 2004, and the least - 37 in 2009. The data has an increasing trend.
The average number of yearly fire incidents per 10k residents in Wentzville, MO compared to nearest cities:
(Note: Based on data for the last 3 years, including only cities with population 5,000 and above)
| Wentzville: | 33.2 |
| Dardenne Prairie: | 19.6 |
| Troy: | 106.9 |
| Weldon Spring: | 1.8 |
| Warrenton: | 27.3 |
| Wildwood: | 16.8 |
| Chesterfield: | 24.5 |
| Washington: | 40.2 |
| Ellisville: | 55.8 |
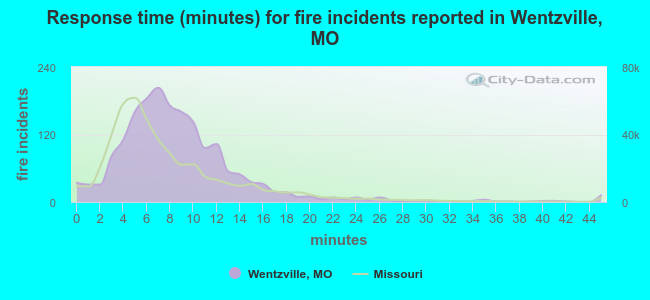 The median response time based on all reported fire incidents is 8 minutes. This is higher than the state median value.
The median response time in Wentzville, MO compared to nearest cities:
(Note: Based on data for all years, including only cities with at least 500 fire incidents)
| Wentzville: | 8 minutes |
| O'Fallon: | 5 minutes |
| Wright City: | 11 minutes |
| Moscow Mills: | 9 minutes |
| Troy: | 7 minutes |
| St. Peters: | 6 minutes |
| Winfield: | 10 minutes |
| Warrenton: | 11 minutes |
| St. Charles: | 6 minutes |
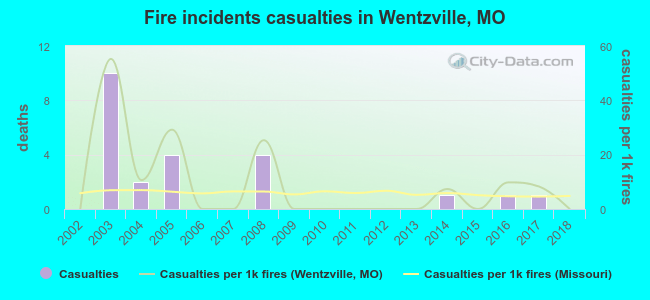 Based on the data from the years 2002 - 2018 the average number of fire-related yearly casualties is 1. The highest number of reported injuries - 10 took place in 2003, and the lowest - 0 in 2002. The data has a constant trend.
The average number of injuries per 1,000 fires is 9. This indicator was the highest - 55 in 2003, and the lowest 0 in 2002. The trend for casualties per 1,000 fires is declining. Compared to the state value the number of injuries per 1,000 incidents is much higher.
Based on the data from the years 2002 - 2018 the average number of fire-related yearly casualties is 1. The highest number of reported injuries - 10 took place in 2003, and the lowest - 0 in 2002. The data has a constant trend.
The average number of injuries per 1,000 fires is 9. This indicator was the highest - 55 in 2003, and the lowest 0 in 2002. The trend for casualties per 1,000 fires is declining. Compared to the state value the number of injuries per 1,000 incidents is much higher.Casualties per 1,000 incidents in Wentzville, MO compared to nearest cities:
(Note: Based on data for all years, including only cities with at least 500 fire incidents)
| Wentzville: | 12.7 |
| O'Fallon: | 22.6 |
| Wright City: | 2.0 |
| Moscow Mills: | 3.8 |
| Troy: | 4.1 |
| St. Peters: | 9.4 |
| Winfield: | 5.6 |
| Warrenton: | 1.0 |
| St. Charles: | 8.3 |
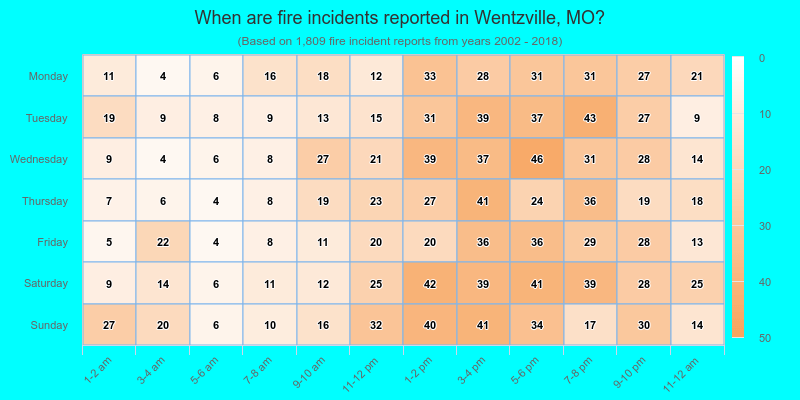
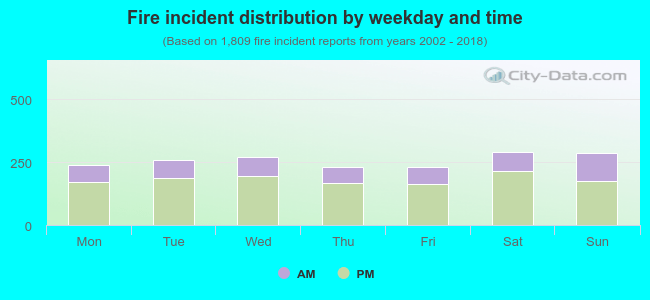 29.9% incidents where reported in the morning and 70.1% in the evening. The most fires (16.1%) took place on Saturday, and the least (12.8%) on Thursday.
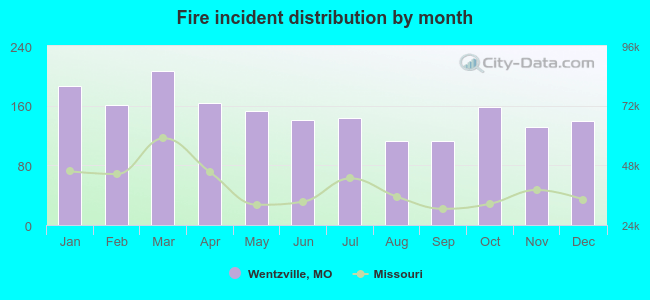 According to the 1,809 incident reports from years 2002 - 2018 most fires (11.4%) took place during March, and the least (6.2%) in August.
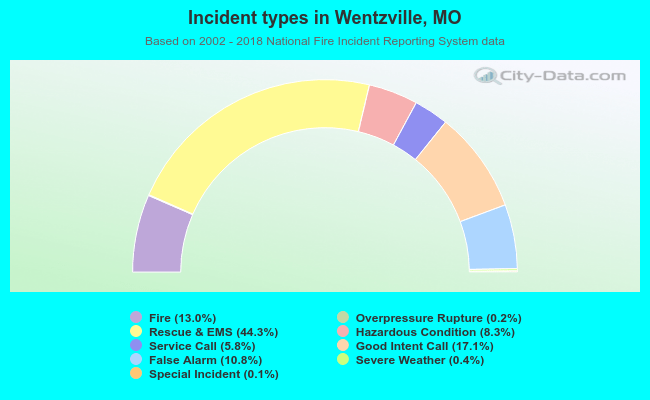 Out of all 13,886 cases reported during the years 2002 - 2018, the most belonged to the categories: Rescue & EMS (44.3%), Good Intent Call (17.1%), and Fire (13.0%).
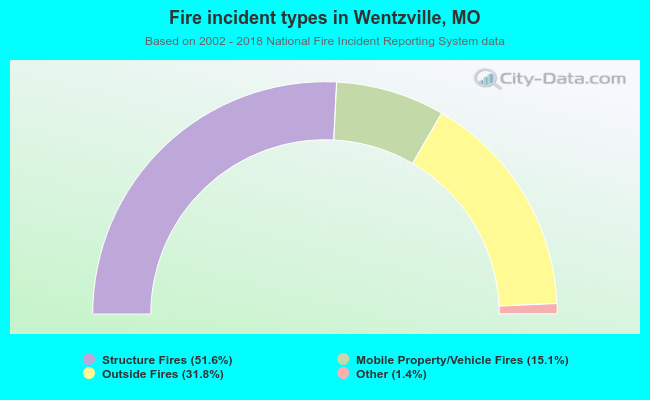 When looking into fire subcategories, the most incidents belonged to: Structure Fires (51.6%), and Outside Fires (31.8%).