Dardenne Prairie: Fire Incidents, Missouri (MO)
Where are fire incidents reported in Dardenne Prairie, MO
Something went wrong! Please refresh the page.
|
| |||||||||||||||||||||||||||||||||||||||||||||||||||||||||||||||||||||||||||||||||||||||||||||||||||||||||||||
2003 - 2018 National Fire Incident Reporting System (NFIRS) incidents
- Incident types reported to NFIRS in Dardenne Prairie, MO
- 1,08144.5%Rescue & EMS
- 54822.6%Good Intent Call
- 32413.3%False Alarm
- 1927.9%Fire
- 1466.0%Hazardous Condition
- 1245.1%Service Call
- 90.4%Severe Weather
- 40.2%Overpressure Rupture
- Fire incident types reported to NFIRS in Dardenne Prairie, MO
- 11559.9%Structure Fires
- 6131.8%Outside Fires
- 157.8%Mobile Property/Vehicle Fires
- 10.5%Other
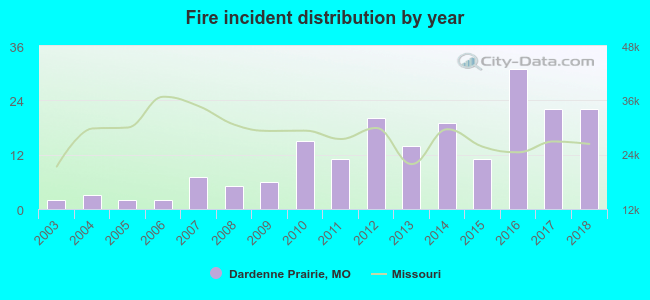 According to the data from the years 2003 - 2018 the average number of fire incidents per year is 12. The highest number of reported fire incidents - 31 took place in 2016, and the least - 2 in 2003. The data has a growing trend.
The average number of yearly fire incidents per 10k residents in Dardenne Prairie, MO compared to nearest cities:
(Note: Based on data for the last 3 years, including only cities with population 5,000 and above)
| Dardenne Prairie: | 19.6 |
| Weldon Spring: | 1.8 |
| Wentzville: | 33.2 |
| Chesterfield: | 24.5 |
| Wildwood: | 16.8 |
| Ellisville: | 55.8 |
| Ballwin: | 19.2 |
| Maryland Heights: | 36.6 |
| Town and Country: | 26.1 |
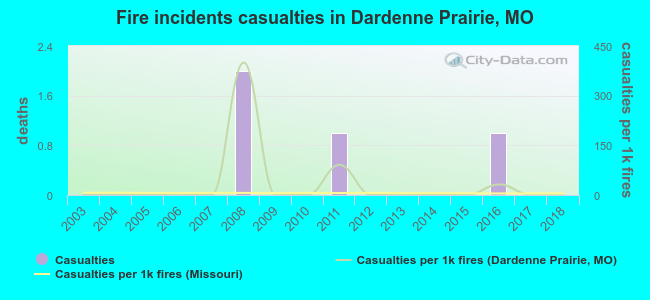 According to the data from the years 2003 - 2018 the average number of fire-related yearly casualties is 0. The highest number of casualties - 2 took place in 2008, and the lowest - 0 in 2003. The data has a constant trend.
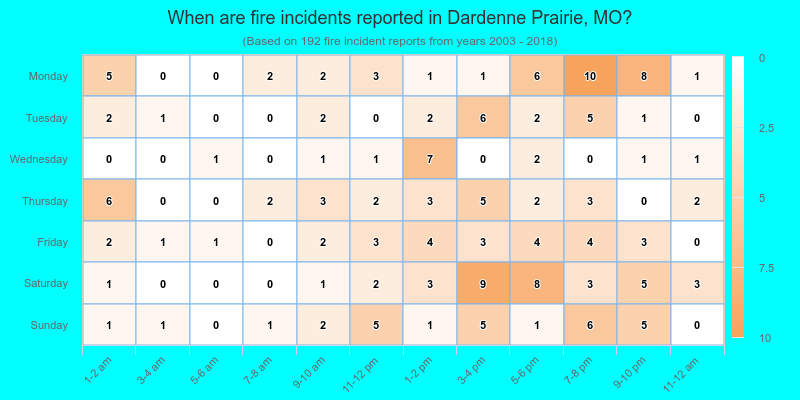
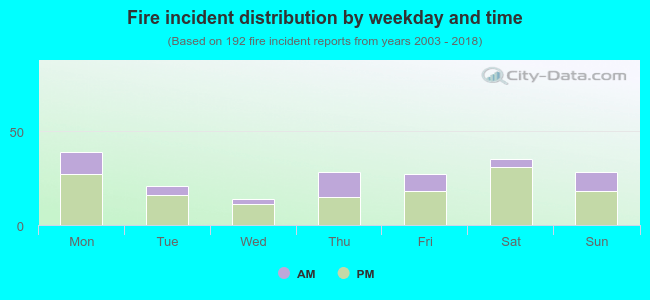 29.2% incidents where reported in the morning and 70.8% in the evening. The most fires (20.3%) took place on Monday, and the least (7.3%) on Wednesday.
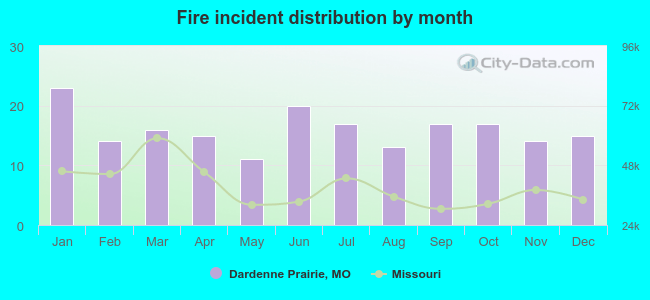 Based on the 192 fires from years 2003 - 2018 most fires (12.0%) took place during January, and the least (5.7%) in May.
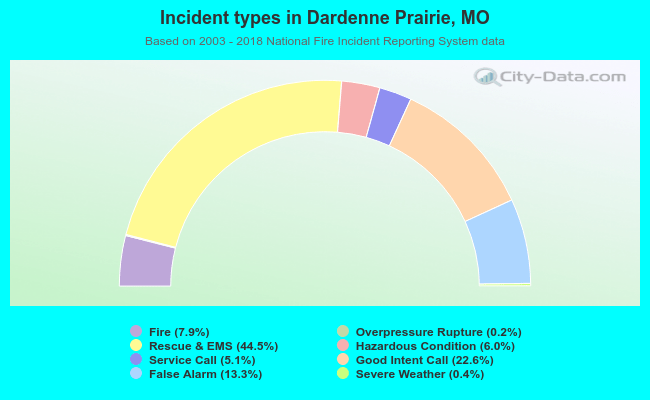 Out of all 2,428 cases reported during the years 2003 - 2018, the most belonged to the categories: Rescue & EMS (44.5%), Good Intent Call (22.6%), and False Alarm (13.3%).
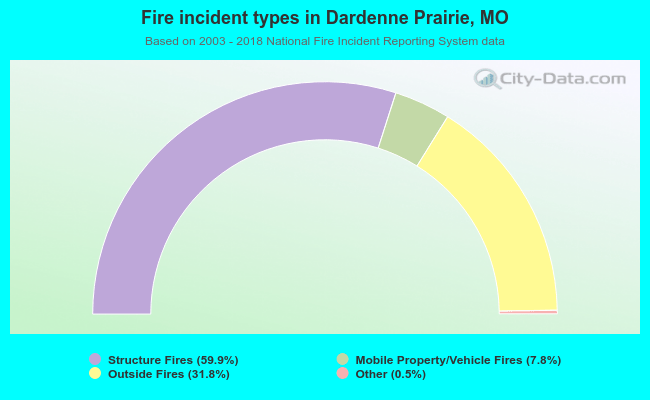 When looking into fire subcategories, the most reports belonged to: Structure Fires (59.9%), and Outside Fires (31.8%).