Webster City: Fire Incidents, Iowa (IA)
Where are fire incidents reported in Webster City, IA
Something went wrong! Please refresh the page.
|
| |||||||||||||||||||||||||||||||||||||||||||||||||||||||||||||||||||||||||||||||||||||||||||||||||||||||||||||
2002 - 2017 National Fire Incident Reporting System (NFIRS) incidents
- Incident types reported to NFIRS in Webster City, IA
- 39547.2%Fire
- 27132.4%Hazardous Condition
- 506.0%False Alarm
- 445.3%Rescue & EMS
- 323.8%Good Intent Call
- 313.7%Service Call
- 60.7%Severe Weather
- 50.6%Special Incident
- 30.4%Overpressure Rupture
- Fire incident types reported to NFIRS in Webster City, IA
- 16742.3%Structure Fires
- 14336.2%Outside Fires
- 7118.0%Mobile Property/Vehicle Fires
- 143.5%Other
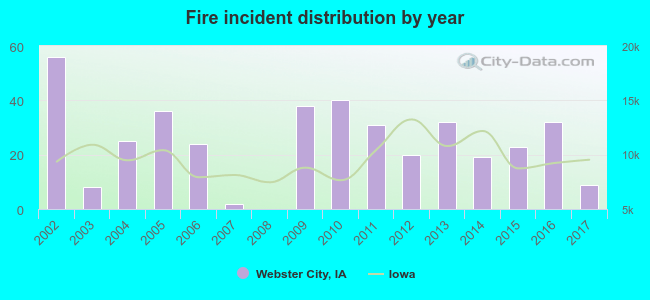 According to the data from the years 2002 - 2017 the average number of fire incidents per year is 25. The highest number of reported fire incidents - 56 took place in 2002, and the least - 0 in 2008. The data has a dropping trend.
The average number of yearly fire incidents per 10k residents in Webster City, IA compared to nearest cities:
(Note: Based on data for the last 3 years, including only cities with population 5,000 and above)
| Webster City: | 26.3 |
| Fort Dodge: | 29.1 |
| Boone: | 17.7 |
| Iowa Falls: | 36.7 |
| Ames: | 15.8 |
| Nevada: | 56.8 |
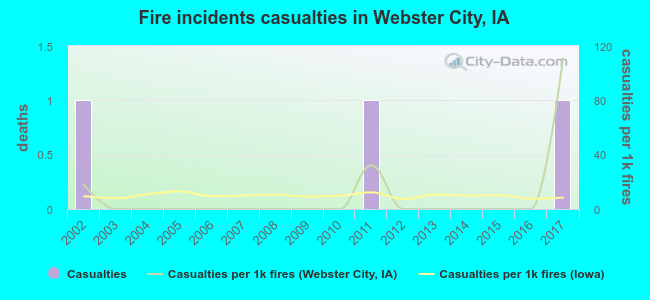 Based on the data from the years 2002 - 2017 the average number of fire-related casualties per year is 0. The highest number of casualties - 1 took place in 2002, and the lowest - 0 in 2003. The data has a constant trend.
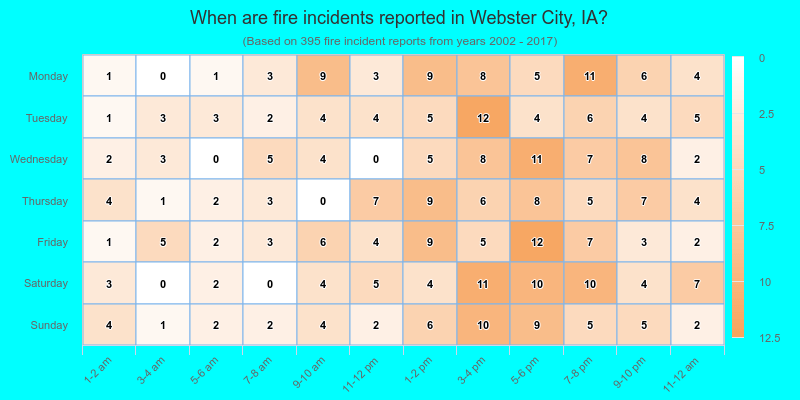
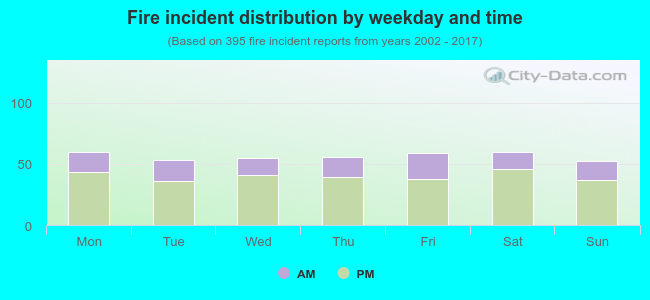 29.1% incidents where reported in the morning and 70.9% in the evening. The most fires (15.2%) took place on Monday, and the least (13.2%) on Sunday.
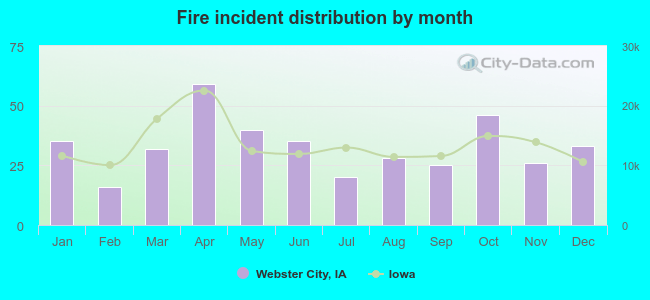 According to the 395 fire incidents from years 2002 - 2017 most fires (14.9%) took place during April, and the least (4.1%) in February.
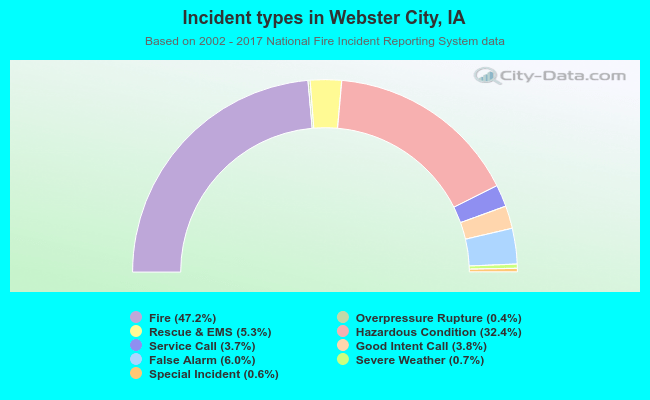 Out of all 837 cases reported during the years 2002 - 2017, the most belonged to the categories: Fire (47.2%), Hazardous Condition (32.4%), and False Alarm (6.0%).
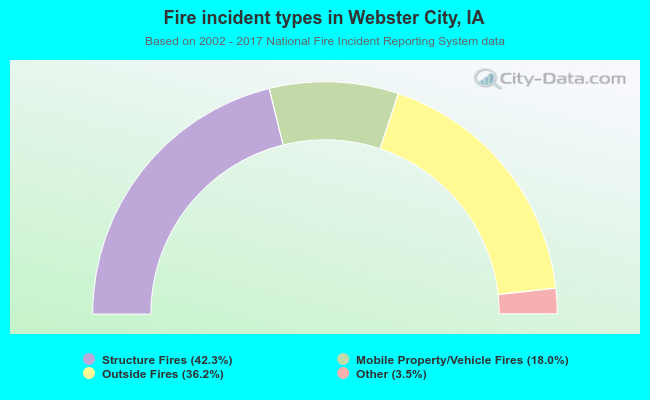 When looking into fire subcategories, the most incidents belonged to: Structure Fires (42.3%), and Outside Fires (36.2%).