Warren: Fire Incidents, Ohio (OH)
Where are fire incidents reported in Warren, OH
Something went wrong! Please refresh the page.
| Fire incidents reported | |
|---|---|
| Sreet name | Count |
| MAHONING AVE | 316 |
| RIVER RD | 246 |
| NILES CORTLAND RD | 158 |
| ELM RD | 146 |
| PARKMAN RD | 146 |
| NORTH RIVER RD | 134 |
| EAST MARKET ST | 114 |
| CHAMPION AVE | 102 |
| YOUNGSTOWN RD | 94 |
| STATE RD | 86 |
| TOD AVE | 76 |
| CENTER ST | 74 |
| VALLEY CIR | 74 |
| HIGH ST | 64 |
| NORTH PARK AVE | 62 |
| OAK ST | 56 |
| WASHINGTON ST | 56 |
| FRONT ST | 54 |
| NILES RD | 54 |
| PINE ST | 54 |
| SHEPHERDS WAY | 54 |
| GLENDOLA AVE | 48 |
| HOWLAND WILSON RD | 48 |
| MAHONING AVE. | 48 |
| NORTH RIVER RD. | 48 |
| HAMILTON DR | 46 |
| PEACH LANE | 46 |
| UNION ST | 46 |
| HIGHLAND AVE | 44 |
| SHAFER RD | 44 |
| Other | 2,344 |
2002 - 2018 National Fire Incident Reporting System (NFIRS) incidents
- Incident types reported to NFIRS in Warren, OH
- 18,25757.8%Rescue & EMS
- 4,98215.8%Fire
- 2,5508.1%Service Call
- 2,4057.6%Hazardous Condition
- 1,8535.9%False Alarm
- 1,3204.2%Good Intent Call
- 1600.5%Severe Weather
- 530.2%Overpressure Rupture
- Fire incident types reported to NFIRS in Warren, OH
- 2,68053.8%Structure Fires
- 1,40028.1%Outside Fires
- 81716.4%Mobile Property/Vehicle Fires
- 851.7%Other
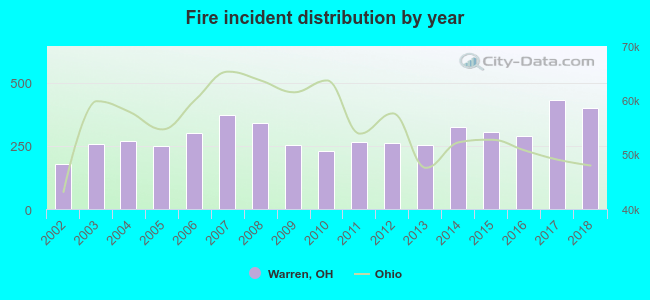 According to the data from the years 2002 - 2018 the average number of fire incidents per year is 293. The highest number of reported fires - 430 took place in 2017, and the least - 178 in 2002. The data has a rising trend.
The average number of yearly fire incidents per 10k residents in Warren, OH compared to nearest cities:
(Note: Based on data for the last 3 years, including only cities with population 5,000 and above)
| Warren: | 91.9 |
| Niles: | 34.4 |
| Cortland: | 120.2 |
| Girard: | 36.9 |
| Austintown: | 36.3 |
| Youngstown: | 89.8 |
| Hubbard: | 84.0 |
| Canfield: | 35.6 |
| Boardman: | 20.4 |
 The median response time based on all reported fire incidents is 5 minutes. This is lower compared to the state median value.
The median response time in Warren, OH compared to nearest cities:
(Note: Based on data for all years, including only cities with at least 500 fire incidents)
| Warren: | 5 minutes |
| Leavittsburg: | 8 minutes |
| Niles: | 4 minutes |
| Cortland: | 8 minutes |
| Girard: | 4 minutes |
| Newton Falls: | 9 minutes |
| Austintown: | 5 minutes |
| Windham: | 8 minutes |
| Youngstown: | 3 minutes |
 According to the reports from the years 2002 - 2018 the average number of fire-related fatalities per year is 2. The highest number of reported deaths - 6 took place in 2011, and the lowest - 0 in 2002. The data has a constant trend.
The average number of deaths per 1,000 fires is 5. This indicator was the highest - 22 in 2011, and the lowest 0 in 2002. The trend for fatalities per 1,000 fire incidents is constant. Compared to the Ohio value the number of deaths per 1,000 fire incidents is much higher.
According to the reports from the years 2002 - 2018 the average number of fire-related fatalities per year is 2. The highest number of reported deaths - 6 took place in 2011, and the lowest - 0 in 2002. The data has a constant trend.
The average number of deaths per 1,000 fires is 5. This indicator was the highest - 22 in 2011, and the lowest 0 in 2002. The trend for fatalities per 1,000 fire incidents is constant. Compared to the Ohio value the number of deaths per 1,000 fire incidents is much higher.Deaths per 1,000 incidents in Warren, OH compared to nearest cities:
(Note: Based on data for all years, including only cities with at least 2,500 fire incidents)
| Warren: | 5.2 |
| Youngstown: | 2.4 |
| Ravenna: | 1.2 |
| Alliance: | 1.9 |
 Based on the data from the years 2002 - 2018 the average number of fire-related yearly casualties is 7. The highest number of reported injuries - 18 took place in 2014, and the lowest - 1 in 2013. The data has a rising trend.
The average number of injuries per 1,000 fires is 23. This indicator was the highest - 55 in 2014, and the lowest 2 in 2017. The trend for injuries per 1,000 incidents is declining. Compared to the Ohio value the number of casualties per 1,000 fire incidents is higher.
Based on the data from the years 2002 - 2018 the average number of fire-related yearly casualties is 7. The highest number of reported injuries - 18 took place in 2014, and the lowest - 1 in 2013. The data has a rising trend.
The average number of injuries per 1,000 fires is 23. This indicator was the highest - 55 in 2014, and the lowest 2 in 2017. The trend for injuries per 1,000 incidents is declining. Compared to the Ohio value the number of casualties per 1,000 fire incidents is higher.Casualties per 1,000 incidents in Warren, OH compared to nearest cities:
(Note: Based on data for all years, including only cities with at least 500 fire incidents)
| Warren: | 22.5 |
| Leavittsburg: | 16.4 |
| Niles: | 17.0 |
| Cortland: | 17.5 |
| Girard: | 5.8 |
| Newton Falls: | 5.3 |
| Austintown: | 40.8 |
| Windham: | 18.4 |
| Youngstown: | 11.1 |
 34.9% incidents where reported in the morning and 65.1% in the evening. The most fires (15.1%) took place on Monday, and the least (13.6%) on Thursday.
 Based on the 4,982 fires from years 2002 - 2018 most fires (9.9%) took place during November, and the least (6.0%) in February.
 Out of all 31,609 cases reported during the years 2002 - 2018, the most belonged to the categories: Rescue & EMS (57.8%), Fire (15.8%), and Service Call (8.1%).
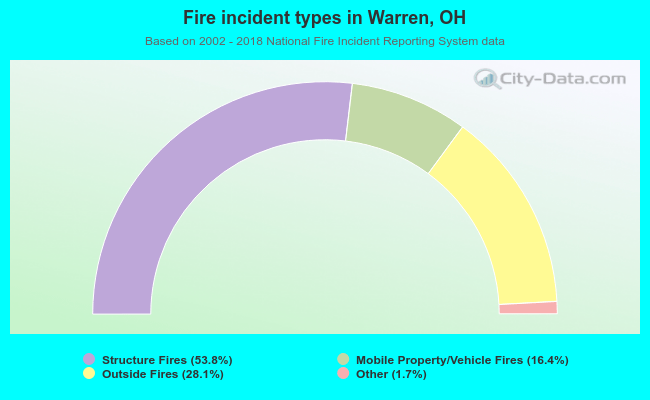 When looking into fire subcategories, the most reports belonged to: Structure Fires (53.8%), and Outside Fires (28.1%).