Alliance: Fire Incidents, Ohio (OH)
Where are fire incidents reported in Alliance, OH
Something went wrong! Please refresh the page.
| Fire incidents reported | |
|---|---|
| Sreet name | Count |
| STATE ST | 350 |
| UNION AVE | 270 |
| MAIN ST | 164 |
| ARCH AVE | 112 |
| LINDEN AVE | 78 |
| BAYTON ST | 76 |
| FREEDOM AVE | 74 |
| WEBB AVE | 74 |
| MAHONING AVE | 64 |
| BROADWAY ST | 60 |
| SUMMIT ST | 60 |
| CAMBRIDGE ST | 58 |
| ROCKHILL AVE | 54 |
| COLUMBIA ST | 52 |
| SENECA AVE | 52 |
| BEECH ST | 50 |
| EASTON ST | 50 |
| LIBERTY AVE | 48 |
| GLAMORGAN ST | 44 |
| SIMPSON ST | 42 |
| MARLBORO AVE | 40 |
| OXFORD ST | 40 |
| WESTWOOD AVE | 40 |
| ALDEN AVE | 36 |
| ELY ST | 36 |
| KEYSTONE ST | 36 |
| MARKET ST | 36 |
| CHESTNUT ST | 34 |
| LINCOLN AVE | 34 |
| SALEM CHURCH RD | 32 |
| Other | 477 |
2002 - 2018 National Fire Incident Reporting System (NFIRS) incidents
- Incident types reported to NFIRS in Alliance, OH
- 11,34351.7%Rescue & EMS
- 3,83817.5%Hazardous Condition
- 2,67312.2%Fire
- 1,7588.0%Service Call
- 1,3566.2%False Alarm
- 9164.2%Good Intent Call
- 460.2%Severe Weather
- Fire incident types reported to NFIRS in Alliance, OH
- 1,44954.2%Structure Fires
- 83231.1%Outside Fires
- 36313.6%Mobile Property/Vehicle Fires
- 291.1%Other
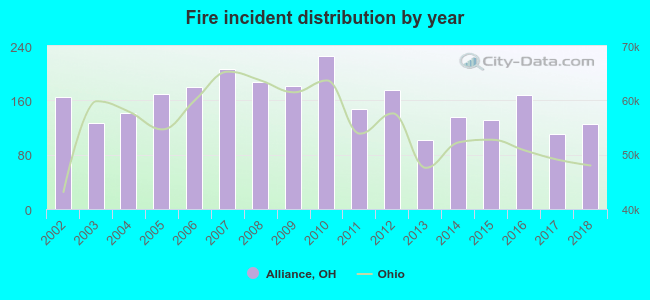 According to the data from the years 2002 - 2018 the average number of fire incidents per year is 157. The highest number of reported fires - 226 took place in 2010, and the least - 101 in 2013. The data has a decreasing trend.
The average number of yearly fire incidents per 10k residents in Alliance, OH compared to nearest cities:
(Note: Based on data for the last 3 years, including only cities with population 5,000 and above)
| Alliance: | 60.8 |
| Louisville: | 68.5 |
| Salem: | 86.3 |
| North Canton: | 32.2 |
| Canton: | 54.2 |
| Ravenna: | 117.4 |
| Canfield: | 35.6 |
| Green: | 0.6 |
| Tallmadge: | 28.1 |
 The median response time based on all reported fire incidents is 4 minutes. This is lower than the state median value.
The median response time in Alliance, OH compared to nearest cities:
(Note: Based on data for all years, including only cities with at least 500 fire incidents)
| Alliance: | 4 minutes |
| Atwater: | 11 minutes |
| Louisville: | 8 minutes |
| Hartville: | 8 minutes |
| Minerva: | 9 minutes |
| East Canton: | 10 minutes |
| Salem: | 7 minutes |
| North Canton: | 6 minutes |
| Canton: | 5 minutes |
 Based on the reports from the years 2002 - 2018 the average number of fire-related yearly deaths is 0. The highest number of reported deaths - 3 took place in 2006, and the lowest - 0 in 2002. The data has a constant trend.
The average number of fatalities per 1,000 fire incidents is 2. This indicator was the highest - 17 in 2006, and the lowest 0 in 2002. The trend for fatalities per 1,000 incidents is constant. Compared to the Ohio value the number of deaths per 1,000 fire incidents is similar.
Based on the reports from the years 2002 - 2018 the average number of fire-related yearly deaths is 0. The highest number of reported deaths - 3 took place in 2006, and the lowest - 0 in 2002. The data has a constant trend.
The average number of fatalities per 1,000 fire incidents is 2. This indicator was the highest - 17 in 2006, and the lowest 0 in 2002. The trend for fatalities per 1,000 incidents is constant. Compared to the Ohio value the number of deaths per 1,000 fire incidents is similar.Deaths per 1,000 incidents in Alliance, OH compared to nearest cities:
(Note: Based on data for all years, including only cities with at least 2,500 fire incidents)
| Alliance: | 1.9 |
| Canton: | 2.4 |
| Ravenna: | 1.2 |
| Massillon: | 1.0 |
| Akron: | 2.8 |
| Cuyahoga Falls: | 2.7 |
 According to the data from the years 2002 - 2018 the average number of fire-related casualties per year is 3. The highest number of reported casualties - 10 took place in 2005, and the lowest - 0 in 2015. The data has a dropping trend.
The average number of casualties per 1,000 fire incidents is 18. This indicator was the highest - 59 in 2005, and the lowest 0 in 2015. The trend for casualties per 1,000 fire incidents is declining. Compared to the state value the number of casualties per 1,000 fires is higher.
According to the data from the years 2002 - 2018 the average number of fire-related casualties per year is 3. The highest number of reported casualties - 10 took place in 2005, and the lowest - 0 in 2015. The data has a dropping trend.
The average number of casualties per 1,000 fire incidents is 18. This indicator was the highest - 59 in 2005, and the lowest 0 in 2015. The trend for casualties per 1,000 fire incidents is declining. Compared to the state value the number of casualties per 1,000 fires is higher.Casualties per 1,000 incidents in Alliance, OH compared to nearest cities:
(Note: Based on data for all years, including only cities with at least 500 fire incidents)
| Alliance: | 18.0 |
| Atwater: | 18.2 |
| Louisville: | 9.4 |
| Hartville: | 10.8 |
| Minerva: | 13.2 |
| East Canton: | 14.8 |
| Salem: | 3.3 |
| North Canton: | 22.3 |
| Canton: | 23.7 |
 35.3% incidents where reported in the morning and 64.7% in the evening. The most fires (16.4%) took place on Sunday, and the least (12.4%) on Thursday.
 Based on the 2,673 fire incidents from years 2002 - 2018 most fires (10.3%) took place during April, and the least (6.3%) in December.
 Out of all 21,956 cases reported during the years 2002 - 2018, the most belonged to the categories: Rescue & EMS (51.7%), Hazardous Condition (17.5%), and Fire (12.2%).
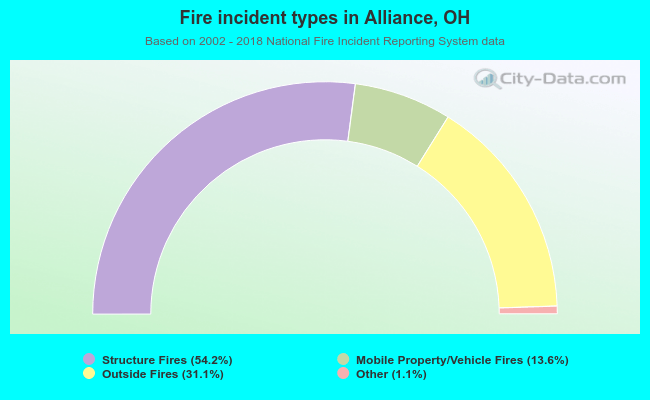 When looking into fire subcategories, the most reports belonged to: Structure Fires (54.2%), and Outside Fires (31.1%).