Canton: Fire Incidents, Ohio (OH)
Where are fire incidents reported in Canton, OH
Something went wrong! Please refresh the page.
| Fire incidents reported | |
|---|---|
| Sreet name | Count |
| TUSCARAWAS ST | 404 |
| CLEVELAND AVE | 362 |
| MARKET AVE | 180 |
| 12TH ST | 178 |
| 14TH ST | 176 |
| 6TH ST | 168 |
| 5TH ST | 164 |
| 3RD ST | 160 |
| 13TH ST | 154 |
| 4TH ST | 146 |
| 17TH ST | 144 |
| 11TH ST | 142 |
| 9TH ST | 136 |
| ALAN PAGE DR | 130 |
| 2ND ST | 122 |
| 7TH ST | 116 |
| 30TH ST | 104 |
| 8TH ST | 104 |
| 16TH ST | 102 |
| NAVARRE RD | 102 |
| WAYNESBURG DR | 100 |
| HIGH AVE | 94 |
| 15TH ST | 92 |
| 19TH ST | 92 |
| FULTON RD | 92 |
| MAHONING RD | 88 |
| DUEBER AVE | 86 |
| HARRISON AVE | 84 |
| 10TH ST | 82 |
| VARLEY AVE | 82 |
| Other | 2,407 |
2002 - 2018 National Fire Incident Reporting System (NFIRS) incidents
- Incident types reported to NFIRS in Canton, OH
- 65,93668.6%Rescue & EMS
- 9,70310.1%Service Call
- 6,5936.9%Fire
- 4,9675.2%Hazardous Condition
- 4,5734.8%Good Intent Call
- 4,1984.4%False Alarm
- Fire incident types reported to NFIRS in Canton, OH
- 3,53653.6%Structure Fires
- 2,00030.3%Outside Fires
- 1,02715.6%Mobile Property/Vehicle Fires
- 300.5%Other
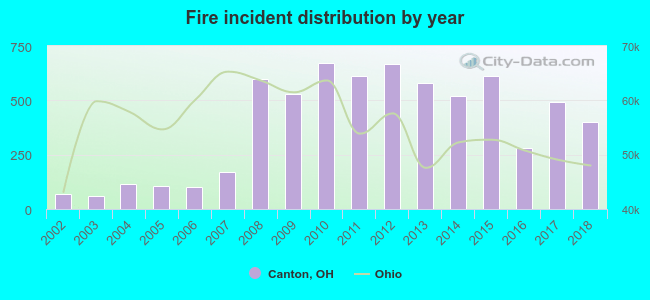 Based on the data from the years 2002 - 2018 the average number of fire incidents per year is 388. The highest number of fire incidents - 673 took place in 2010, and the least - 61 in 2003. The data has a growing trend.
The average number of yearly fire incidents per 10k residents in Canton, OH compared to nearest cities:
(Note: Based on data for the last 3 years, including only cities with population 5,000 and above)
| Canton: | 54.2 |
| North Canton: | 32.2 |
| Louisville: | 68.5 |
| Massillon: | 27.6 |
| Green: | 0.6 |
| Canal Fulton: | 32.8 |
| Alliance: | 60.8 |
| Barberton: | 18.0 |
| Akron: | 43.8 |
 The median response time based on all reported fire incidents is 5 minutes. This is lower compared to the state median value.
The median response time in Canton, OH compared to nearest cities:
(Note: Based on data for all years, including only cities with at least 500 fire incidents)
| Canton: | 5 minutes |
| East Canton: | 10 minutes |
| North Canton: | 6 minutes |
| Louisville: | 8 minutes |
| Massillon: | 5 minutes |
| Navarre: | 10 minutes |
| Hartville: | 8 minutes |
| Uniontown: | 5 minutes |
| Canal Fulton: | 8 minutes |
 According to the data from the years 2002 - 2018 the average number of fire-related yearly deaths is 1. The highest number of deaths - 3 took place in 2012, and the lowest - 0 in 2003. The data has a constant trend.
The average number of deaths per 1,000 fire incidents is 3. This indicator was the highest - 14 in 2002, and the lowest 0 in 2003. The trend for fatalities per 1,000 fires is decreasing. Compared to the state value the number of fatalities per 1,000 fire incidents is about the same.
According to the data from the years 2002 - 2018 the average number of fire-related yearly deaths is 1. The highest number of deaths - 3 took place in 2012, and the lowest - 0 in 2003. The data has a constant trend.
The average number of deaths per 1,000 fire incidents is 3. This indicator was the highest - 14 in 2002, and the lowest 0 in 2003. The trend for fatalities per 1,000 fires is decreasing. Compared to the state value the number of fatalities per 1,000 fire incidents is about the same.Deaths per 1,000 incidents in Canton, OH compared to nearest cities:
(Note: Based on data for all years, including only cities with at least 2,500 fire incidents)
| Canton: | 2.4 |
| Massillon: | 1.0 |
| Alliance: | 1.9 |
| Akron: | 2.8 |
| Cuyahoga Falls: | 2.7 |
| Ravenna: | 1.2 |
 Based on the data from the years 2002 - 2018 the average number of fire-related yearly casualties is 9. The highest number of reported injuries - 31 took place in 2015, and the lowest - 0 in 2005. The data has a growing trend.
The average number of casualties per 1,000 fires is 24. This indicator was the highest - 57 in 2016, and the lowest 0 in 2005. The trend for casualties per 1,000 fire incidents is declining. Compared to the Ohio value the number of casualties per 1,000 fires is higher.
Based on the data from the years 2002 - 2018 the average number of fire-related yearly casualties is 9. The highest number of reported injuries - 31 took place in 2015, and the lowest - 0 in 2005. The data has a growing trend.
The average number of casualties per 1,000 fires is 24. This indicator was the highest - 57 in 2016, and the lowest 0 in 2005. The trend for casualties per 1,000 fire incidents is declining. Compared to the Ohio value the number of casualties per 1,000 fires is higher.Casualties per 1,000 incidents in Canton, OH compared to nearest cities:
(Note: Based on data for all years, including only cities with at least 500 fire incidents)
| Canton: | 23.7 |
| East Canton: | 14.8 |
| North Canton: | 22.3 |
| Louisville: | 9.4 |
| Massillon: | 13.5 |
| Navarre: | 9.2 |
| Hartville: | 10.8 |
| Uniontown: | 15.0 |
| Canal Fulton: | 5.5 |
 33.4% incidents where reported in the morning and 66.6% in the evening. The most fires (15.5%) took place on Saturday, and the least (13.6%) on Wednesday.
 According to the 6,593 incident reports from years 2002 - 2018 most fires (10.5%) took place during July, and the least (5.9%) in February.
 Out of all 96,142 cases reported during the years 2002 - 2018, the most belonged to the categories: Rescue & EMS (68.6%), Service Call (10.1%), and Fire (6.9%).
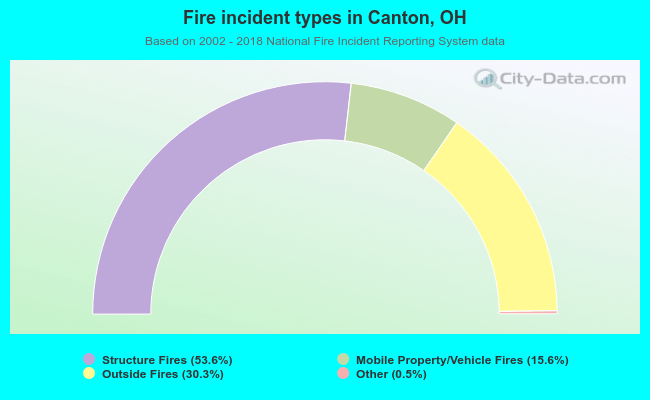 When looking into fire subcategories, the most incidents belonged to: Structure Fires (53.6%), and Outside Fires (30.3%).