Wallington: Fire Incidents, New Jersey (NJ)
Where are fire incidents reported in Wallington, NJ
Something went wrong! Please refresh the page.
|
| |||||||||||||||||||||||||||||||||||||||||||||||||||||||||||||||||||||||||||||||||||||||||||||||||||||||||||||
2002 - 2018 National Fire Incident Reporting System (NFIRS) incidents
- Incident types reported to NFIRS in Wallington, NJ
- 2,38465.7%Rescue & EMS
- 36310.0%Fire
- 3218.8%False Alarm
- 3178.7%Hazardous Condition
- 1103.0%Good Intent Call
- 1093.0%Service Call
- 210.6%Special Incident
- Fire incident types reported to NFIRS in Wallington, NJ
- 26472.7%Structure Fires
- 5214.3%Outside Fires
- 246.6%Mobile Property/Vehicle Fires
- 236.3%Other
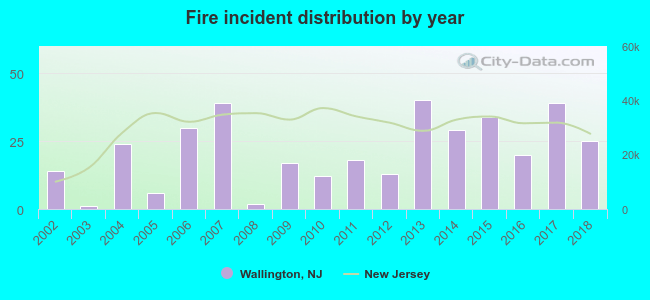 Based on the data from the years 2002 - 2018 the average number of fire incidents per year is 21. The highest number of reported fire incidents - 40 took place in 2013, and the least - 1 in 2003. The data has a rising trend.
The average number of yearly fire incidents per 10k residents in Wallington, NJ compared to nearest cities:
(Note: Based on data for the last 3 years, including only cities with population 5,000 and above)
| Wallington: | 24.1 |
| Passaic: | 35.8 |
| Rutherford: | 45.3 |
| East Rutherford: | 192.9 |
| Carlstadt: | 56.0 |
| Garfield: | 12.0 |
| Hasbrouck Heights: | 18.9 |
| Lodi: | 24.5 |
| Clifton: | 22.3 |
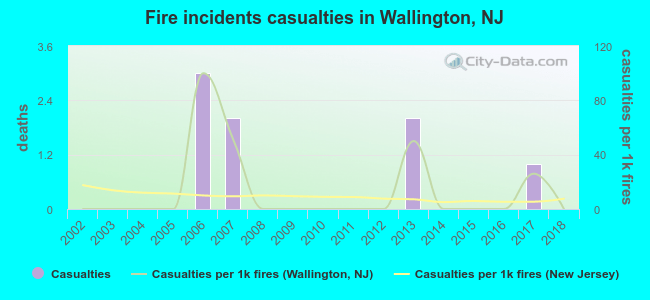 According to the data from the years 2002 - 2018 the average number of fire-related casualties per year is 0. The highest number of injuries - 3 took place in 2006, and the lowest - 0 in 2002. The data has a constant trend.
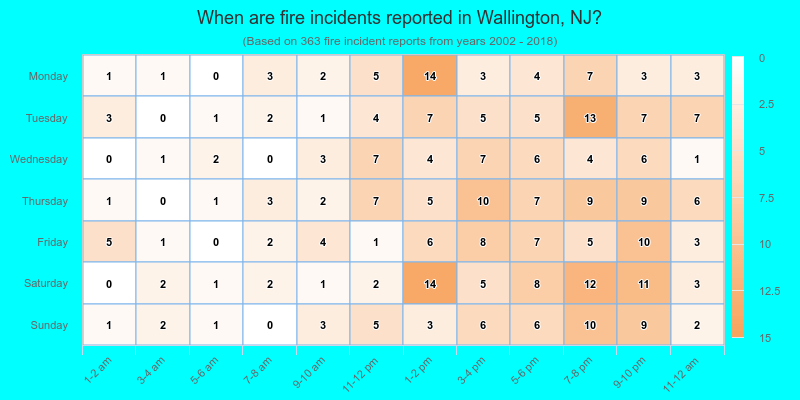
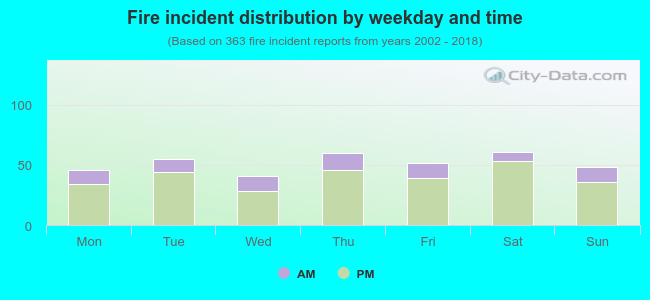 22.9% incidents where reported in the morning and 77.1% in the evening. The most fires (16.8%) took place on Saturday, and the least (11.3%) on Wednesday.
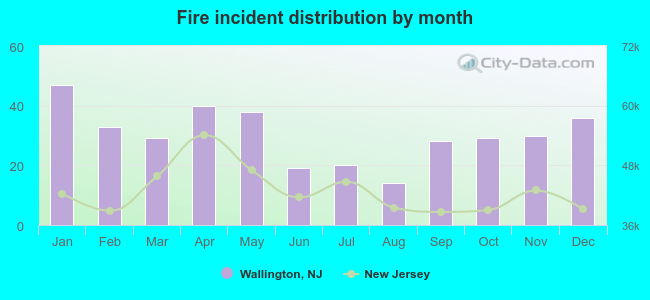 According to the 363 fires from years 2002 - 2018 most fires (12.9%) took place during January, and the least (3.9%) in August.
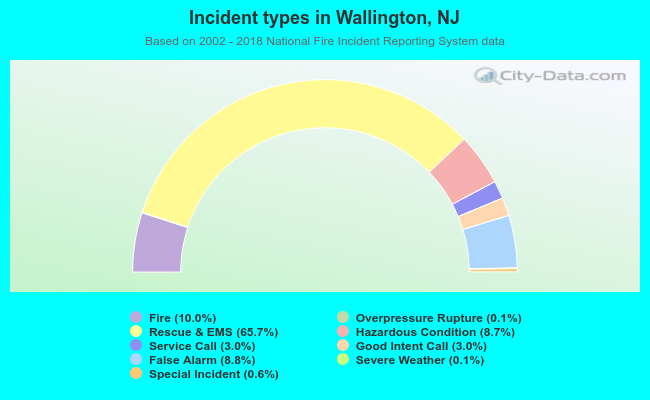 Out of all 3,631 cases reported during the years 2002 - 2018, the most belonged to the categories: Rescue & EMS (65.7%), Fire (10.0%), and False Alarm (8.8%).
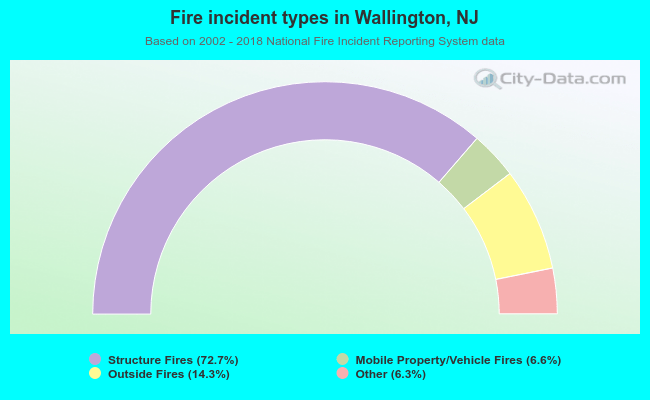 When looking into fire subcategories, the most reports belonged to: Structure Fires (72.7%), and Outside Fires (14.3%).