Lodi: Fire Incidents, New Jersey (NJ)
Where are fire incidents reported in Lodi, NJ
Something went wrong! Please refresh the page.
|
| |||||||||||||||||||||||||||||||||||||||||||||||||||||||||||||||||||||||||||||||||||||||||||||||||||||||||||||
2002 - 2018 National Fire Incident Reporting System (NFIRS) incidents
- Incident types reported to NFIRS in Lodi, NJ
- 80630.9%Hazardous Condition
- 74728.7%False Alarm
- 64024.6%Fire
- 2168.3%Service Call
- 803.1%Rescue & EMS
- 783.0%Good Intent Call
- 230.9%Overpressure Rupture
- 140.5%Special Incident
- Fire incident types reported to NFIRS in Lodi, NJ
- 39060.9%Structure Fires
- 12018.8%Outside Fires
- 10416.3%Mobile Property/Vehicle Fires
- 264.1%Other
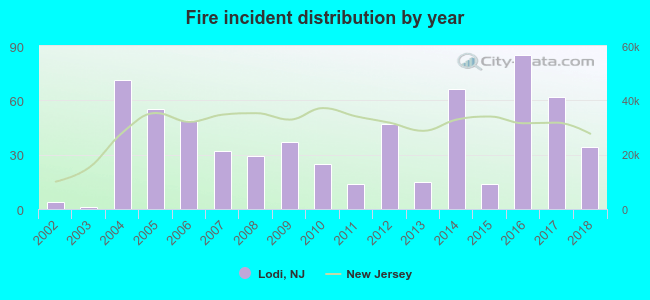 Based on the data from the years 2002 - 2018 the average number of fires per year is 38. The highest number of reported fires - 85 took place in 2016, and the least - 1 in 2003. The data has an increasing trend.
The average number of yearly fire incidents per 10k residents in Lodi, NJ compared to nearest cities:
(Note: Based on data for the last 3 years, including only cities with population 5,000 and above)
| Lodi: | 24.5 |
| Hasbrouck Heights: | 18.9 |
| Garfield: | 12.0 |
| Saddle Brook: | 26.1 |
| Hackensack: | 48.9 |
| Rochelle Park: | 26.5 |
| Maywood: | 5.8 |
| Wallington: | 24.1 |
| Elmwood Park: | 21.6 |
 The median response time based on all reported fire incidents is 4 minutes. This is lower than the state median value.
The median response time in Lodi, NJ compared to nearest cities:
(Note: Based on data for all years, including only cities with at least 500 fire incidents)
| Lodi: | 4 minutes |
| Garfield: | 3 minutes |
| Hackensack: | 3 minutes |
| Elmwood Park: | 5 minutes |
| Passaic: | 4 minutes |
| East Rutherford: | 2 minutes |
| Rutherford: | 5 minutes |
| Clifton: | 5 minutes |
| Teaneck: | 3 minutes |
 31.9% incidents where reported in the morning and 68.1% in the evening. The most fires (16.3%) took place on Tuesday, and the least (12.5%) on Monday.
 According to the 640 reports from years 2002 - 2018 most fires (11.4%) took place during June, and the least (5.3%) in December.
 Out of all 2,606 cases reported during the years 2002 - 2018, the most belonged to the categories: Hazardous Condition (30.9%), False Alarm (28.7%), and Fire (24.6%).
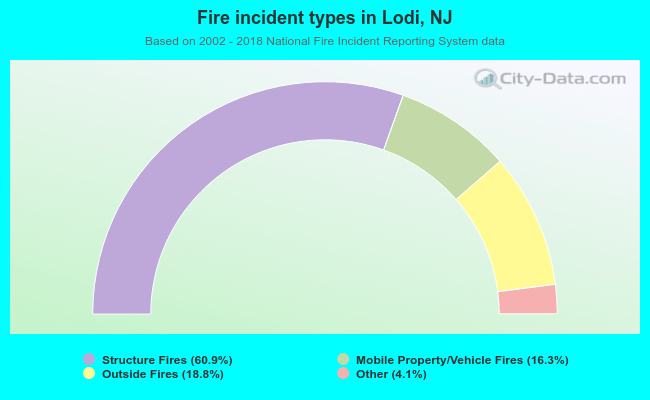 When looking into fire subcategories, the most incidents belonged to: Structure Fires (60.9%), and Outside Fires (18.8%).