Utica: Fire Incidents, New York (NY)
Where are fire incidents reported in Utica, NY
Something went wrong! Please refresh the page.
| Fire incidents reported | |
|---|---|
| Sreet name | Count |
| GENESEE ST | 628 |
| KENNEDY PLAZA | 488 |
| SECOND ST | 272 |
| BLEECKER ST | 250 |
| RUTGER ST | 174 |
| GENESEE ST | 172 |
| CENTENNIAL CIR | 168 |
| ARMORY DR | 162 |
| BURRSTONE RD | 160 |
| SUNSET AVE | 158 |
| BLANDINA ST | 156 |
| JAY ST | 150 |
| KEMBLE ST | 148 |
| WHITESBORO ST | 146 |
| ONEIDA ST | 142 |
| MOHAWK ST | 136 |
| WEST ST | 112 |
| CENTENNIAL CIR | 104 |
| LANSING ST | 98 |
| ELIZABETH ST | 88 |
| SHERMAN DR | 86 |
| DUDLEY AVE | 84 |
| SECOND ST | 84 |
| SOUTH ST | 84 |
| N GENESEE ST | 78 |
| PARK AVE | 78 |
| LENOX AVE | 76 |
| NOYES ST | 76 |
| COURT ST | 74 |
| HERKIMER RD | 74 |
| Other | 1,749 |
2002 - 2018 National Fire Incident Reporting System (NFIRS) incidents
- Incident types reported to NFIRS in Utica, NY
- 49,01664.5%Rescue & EMS
- 7,85610.3%Hazardous Condition
- 6,4558.5%Fire
- 5,4047.1%False Alarm
- 4,6146.1%Service Call
- 2,4593.2%Good Intent Call
- 860.1%Special Incident
- Fire incident types reported to NFIRS in Utica, NY
- 4,21865.3%Structure Fires
- 1,25419.4%Outside Fires
- 73511.4%Mobile Property/Vehicle Fires
- 2483.8%Other
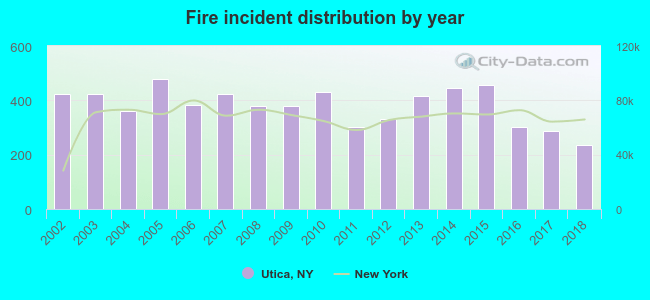 Based on the data from the years 2002 - 2018 the average number of fire incidents per year is 380. The highest number of fires - 477 took place in 2005, and the least - 235 in 2018. The data has a dropping trend.
The average number of yearly fire incidents per 10k residents in Utica, NY compared to nearest cities:
(Note: Based on data for the last 3 years, including only cities with population 5,000 and above)
| Utica: | 44.8 |
| Whitestown: | 1.1 |
| Marcy: | 29.3 |
| Westmoreland: | 23.4 |
| Ilion: | 49.4 |
| German Flatts: | 0.8 |
| Herkimer: | 36.4 |
| Rome: | 9.5 |
| Verona: | 48.7 |
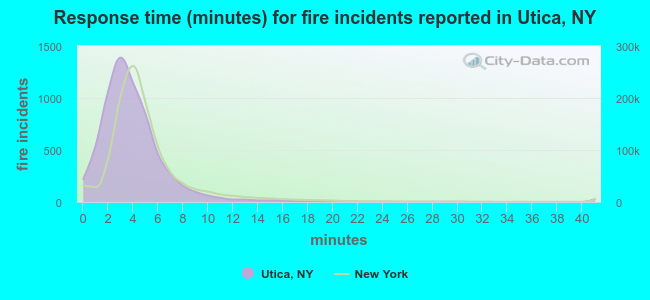 The median response time based on all reported fire incidents is 4 minutes. This is comparable to the state median value.
The median response time in Utica, NY compared to nearest cities:
(Note: Based on data for all years, including only cities with at least 500 fire incidents)
| Utica: | 4 minutes |
| New Hartford: | 6 minutes |
| Ilion: | 3 minutes |
| Herkimer: | 4 minutes |
| Rome: | 4 minutes |
| Oneida: | 3 minutes |
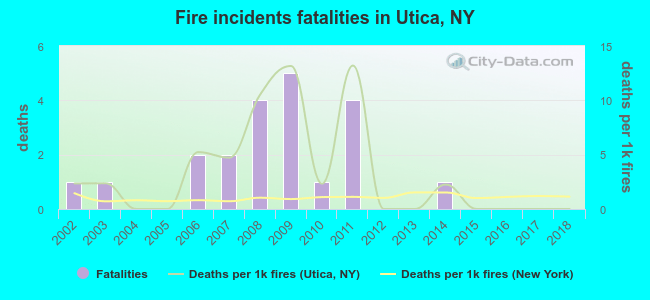 According to the data from the years 2002 - 2018 the average number of fire-related fatalities per year is 1. The highest number of reported deaths - 5 took place in 2009, and the lowest - 0 in 2004. The data has a declining trend.
The average number of deaths per 1,000 fire incidents is 3. This indicator was the highest - 13 in 2011, and the lowest 0 in 2004. The trend for deaths per 1,000 fire incidents is dropping. Compared to the New York value the number of fatalities per 1,000 fire incidents is much higher.
According to the data from the years 2002 - 2018 the average number of fire-related fatalities per year is 1. The highest number of reported deaths - 5 took place in 2009, and the lowest - 0 in 2004. The data has a declining trend.
The average number of deaths per 1,000 fire incidents is 3. This indicator was the highest - 13 in 2011, and the lowest 0 in 2004. The trend for deaths per 1,000 fire incidents is dropping. Compared to the New York value the number of fatalities per 1,000 fire incidents is much higher.Deaths per 1,000 incidents in Utica, NY compared to nearest cities:
(Note: Based on data for all years, including only cities with at least 2,500 fire incidents)
| Utica: | 3.3 |
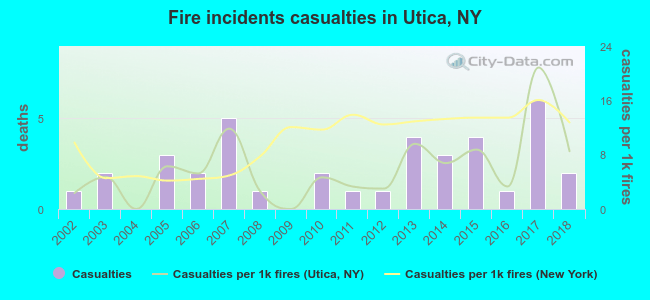 According to the reports from the years 2002 - 2018 the average number of fire-related casualties per year is 2. The highest number of injuries - 6 took place in 2017, and the lowest - 0 in 2004. The data has an increasing trend.
The average number of casualties per 1,000 fires is 6. This indicator was the highest - 21 in 2017, and the lowest 0 in 2004. The trend for injuries per 1,000 fires is rising. Compared to the state value the number of casualties per 1,000 fires is lower.
According to the reports from the years 2002 - 2018 the average number of fire-related casualties per year is 2. The highest number of injuries - 6 took place in 2017, and the lowest - 0 in 2004. The data has an increasing trend.
The average number of casualties per 1,000 fires is 6. This indicator was the highest - 21 in 2017, and the lowest 0 in 2004. The trend for injuries per 1,000 fires is rising. Compared to the state value the number of casualties per 1,000 fires is lower.Casualties per 1,000 incidents in Utica, NY compared to nearest cities:
(Note: Based on data for all years, including only cities with at least 500 fire incidents)
| Utica: | 5.9 |
| New Hartford: | 1.7 |
| Ilion: | 11.8 |
| Herkimer: | 4.6 |
| Rome: | 11.6 |
| Oneida: | 11.8 |
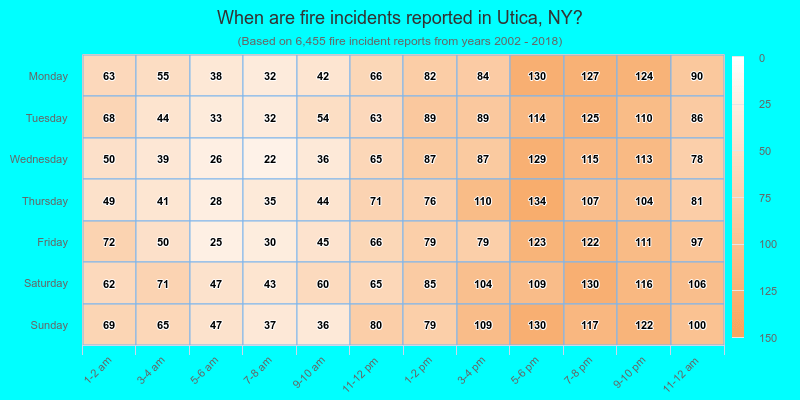
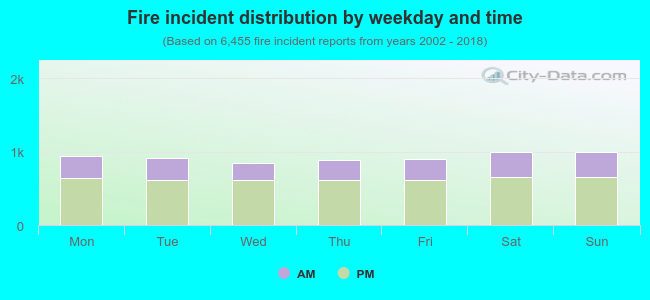 32.0% incidents where reported in the morning and 68.0% in the evening. The most fires (15.5%) took place on Saturday, and the least (13.1%) on Wednesday.
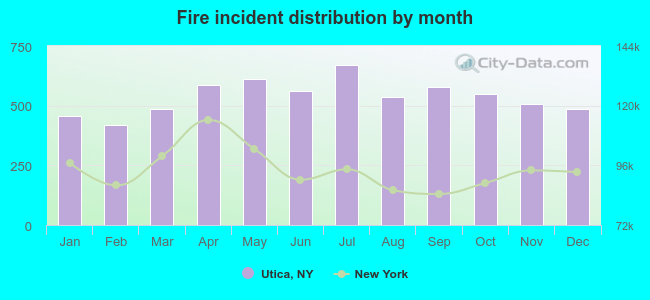 According to the 6,455 fire incident reports from years 2002 - 2018 most fires (10.4%) took place during July, and the least (6.5%) in February.
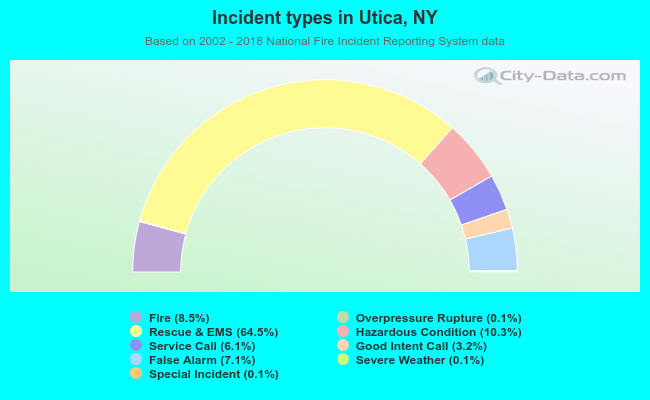 Out of all 76,019 cases reported during the years 2002 - 2018, the most belonged to the categories: Rescue & EMS (64.5%), Hazardous Condition (10.3%), and Fire (8.5%).
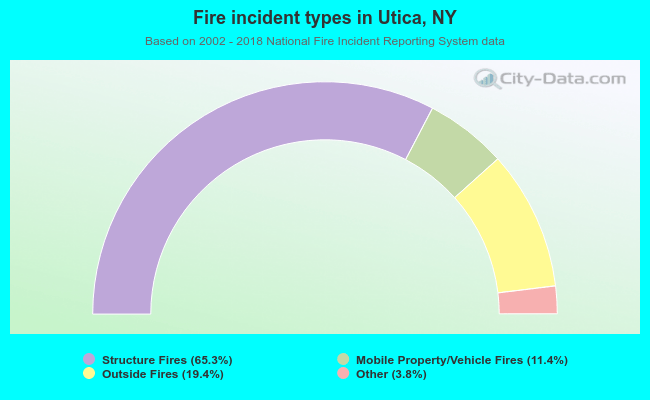 When looking into fire subcategories, the most reports belonged to: Structure Fires (65.3%), and Outside Fires (19.4%).