Verona: Fire Incidents, New York (NY)
Where are fire incidents reported in Verona, NY
Something went wrong! Please refresh the page.
|
| |||||||||||||||||||||||||||||||||||||||||||||||||||||||||||||||||||||||||||||||||||||||||||||||||||||||||||||
2004 - 2018 National Fire Incident Reporting System (NFIRS) incidents
- Incident types reported to NFIRS in Verona, NY
- 1,26955.1%Rescue & EMS
- 37616.3%Hazardous Condition
- 34615.0%Fire
- 1265.5%False Alarm
- 1205.2%Good Intent Call
- 642.8%Service Call
- 30.1%Special Incident
- Fire incident types reported to NFIRS in Verona, NY
- 11834.1%Structure Fires
- 11232.4%Mobile Property/Vehicle Fires
- 6418.5%Outside Fires
- 5215.0%Other
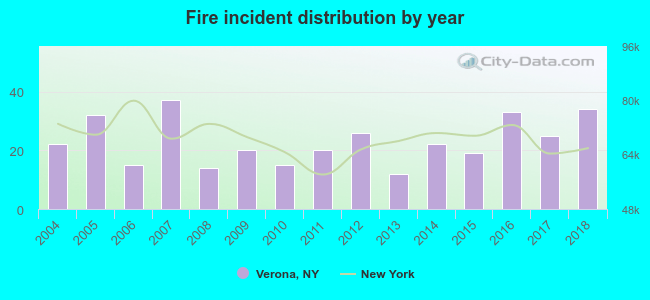 Based on the data from the years 2004 - 2018 the average number of fires per year is 23. The highest number of fires - 37 took place in 2007, and the least - 12 in 2013. The data has a growing trend.
The average number of yearly fire incidents per 10k residents in Verona, NY compared to nearest cities:
(Note: Based on data for the last 3 years, including only cities with population 5,000 and above)
| Verona: | 48.7 |
| Oneida: | 37.2 |
| Vienna: | 5.5 |
| Westmoreland: | 23.4 |
| Rome: | 9.5 |
| Lee: | 1.5 |
| Chittenango: | 48.5 |
| Whitestown: | 1.1 |
| Marcy: | 29.3 |
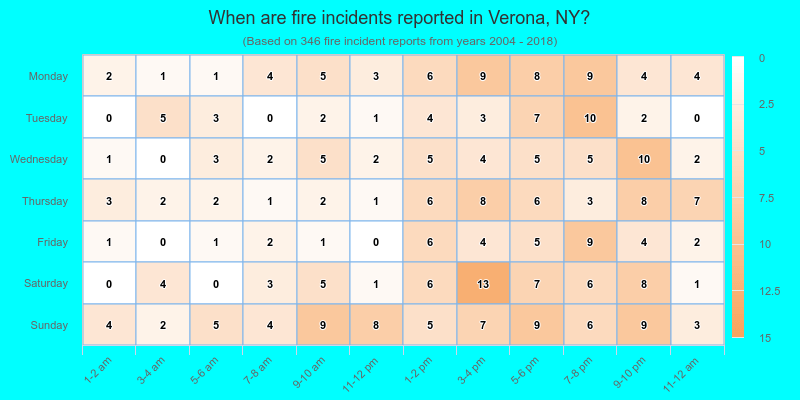
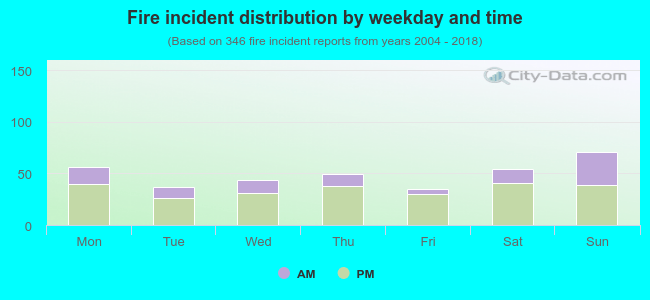 29.2% incidents where reported in the morning and 70.8% in the evening. The most fires (20.5%) took place on Sunday, and the least (10.1%) on Friday.
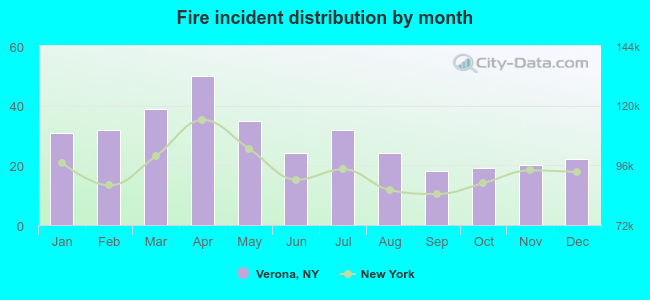 According to the 346 reports from years 2004 - 2018 most fires (14.5%) took place during April, and the least (5.2%) in September.
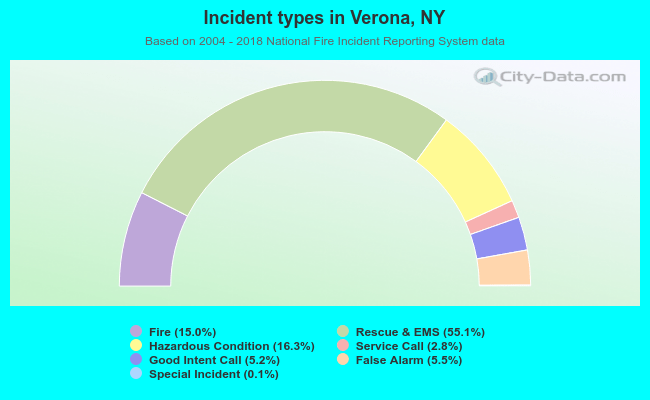 Out of all 2,304 cases reported during the years 2004 - 2018, the most belonged to the categories: Overpressure Rupture (55.1%), Rescue & EMS (16.3%), and Fire (15.0%).
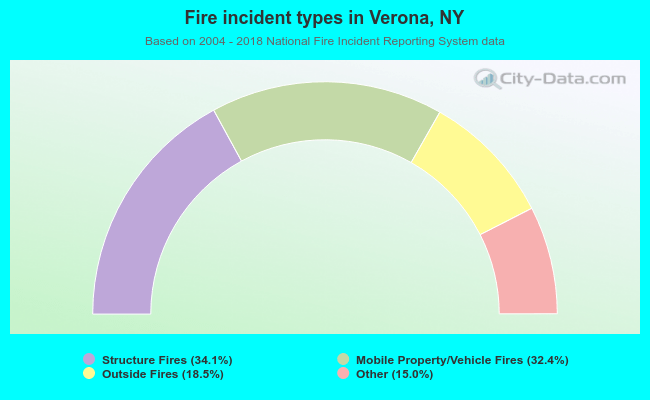 When looking into fire subcategories, the most reports belonged to: Structure Fires (34.1%), and Mobile Property/Vehicle Fires (32.4%).