Union: Fire Incidents, Missouri (MO)
Where are fire incidents reported in Union, MO
Something went wrong! Please refresh the page.
| Fire incidents reported | |
|---|---|
| Sreet name | Count |
| HWY 50 | 108 |
| HWY 47 | 88 |
| MAIN ST | 52 |
| OLD COUNTY FARM RD | 44 |
| DENMARK RD | 34 |
| HWY A | 34 |
| I-44 | 34 |
| I44 | 34 |
| OLD HWY 50 | 34 |
| HWY V | 32 |
| INDEPENDENCE DR | 32 |
| LOST PINES | 32 |
| PRAIRIE DELL RD | 32 |
| WHISKEY CREEK RD | 30 |
| HWY UU | 28 |
| CHURCH ST | 26 |
| HWY BB | 26 |
| NORTH BEND RD | 22 |
| PARK | 22 |
| SERVICE RD | 22 |
| CHAPEL RIDGE DR | 20 |
| OAK ST | 20 |
| PARK RD | 20 |
| HWY AJ | 16 |
| JEFFRIESBURG RD | 16 |
| WASHINGTON AVE | 16 |
| BOURBEUSE RIVER ACCESS DR | 14 |
| CHRISTINA AVE | 14 |
| INDIAN PRAIRIE RD | 14 |
| LOCUST ST | 14 |
| Other | 364 |
2002 - 2018 National Fire Incident Reporting System (NFIRS) incidents
- Incident types reported to NFIRS in Union, MO
- 2,51637.8%Rescue & EMS
- 1,29419.5%Fire
- 98414.8%Hazardous Condition
- 97414.7%Good Intent Call
- 5478.2%Service Call
- 3004.5%False Alarm
- 170.3%Special Incident
- 80.1%Overpressure Rupture
- 80.1%Severe Weather
- Fire incident types reported to NFIRS in Union, MO
- 53641.4%Structure Fires
- 53441.3%Outside Fires
- 18013.9%Mobile Property/Vehicle Fires
- 443.4%Other
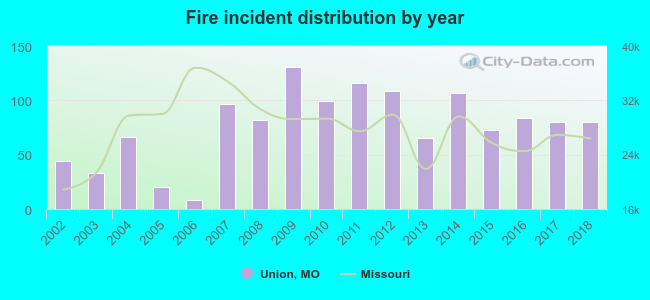 Based on the data from the years 2002 - 2018 the average number of fires per year is 76. The highest number of reported fire incidents - 131 took place in 2009, and the least - 8 in 2006. The data has a growing trend.
The average number of yearly fire incidents per 10k residents in Union, MO compared to nearest cities:
(Note: Based on data for the last 3 years, including only cities with population 5,000 and above)
| Union: | 74.9 |
| Washington: | 40.2 |
| Pacific: | 45.0 |
| Sullivan: | 139.9 |
| Eureka: | 47.4 |
| Wildwood: | 16.8 |
| Ellisville: | 55.8 |
| Dardenne Prairie: | 19.6 |
| Warrenton: | 27.3 |
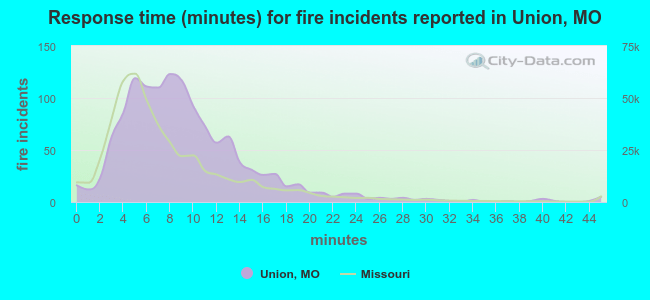 The median response time based on all reported fire incidents is 8 minutes. This is higher compared to the state median value.
The median response time in Union, MO compared to nearest cities:
(Note: Based on data for all years, including only cities with at least 500 fire incidents)
| Union: | 8 minutes |
| Washington: | 4 minutes |
| Pacific: | 7 minutes |
| Gerald: | 11 minutes |
| Sullivan: | 9 minutes |
| Eureka: | 8 minutes |
| Cedar Hill: | 7 minutes |
| Wildwood: | 6 minutes |
| Bourbon: | 10 minutes |
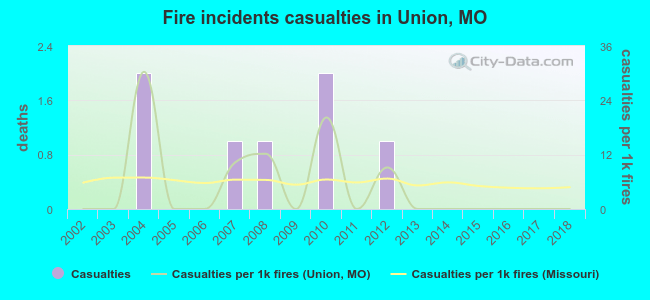 According to the data from the years 2002 - 2018 the average number of fire-related yearly casualties is 0. The highest number of injuries - 2 took place in 2004, and the lowest - 0 in 2002. The data has a constant trend.
The average number of casualties per 1,000 fire incidents is 5. This indicator was the highest - 30 in 2004, and the lowest 0 in 2002. The trend for casualties per 1,000 incidents is constant. Compared to the state value the number of injuries per 1,000 fires is about the same.
According to the data from the years 2002 - 2018 the average number of fire-related yearly casualties is 0. The highest number of injuries - 2 took place in 2004, and the lowest - 0 in 2002. The data has a constant trend.
The average number of casualties per 1,000 fire incidents is 5. This indicator was the highest - 30 in 2004, and the lowest 0 in 2002. The trend for casualties per 1,000 incidents is constant. Compared to the state value the number of injuries per 1,000 fires is about the same.Casualties per 1,000 incidents in Union, MO compared to nearest cities:
(Note: Based on data for all years, including only cities with at least 500 fire incidents)
| Union: | 5.4 |
| Washington: | 0.0 |
| Pacific: | 5.5 |
| Gerald: | 0.0 |
| Sullivan: | 0.0 |
| Eureka: | 15.1 |
| Cedar Hill: | 4.8 |
| Wildwood: | 4.2 |
| Bourbon: | 0.0 |
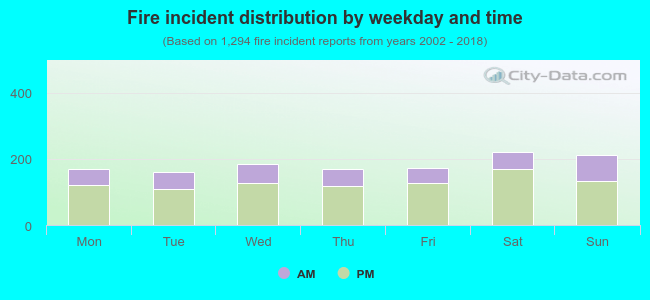 30.4% incidents where reported in the morning and 69.6% in the evening. The most fires (17.2%) took place on Saturday, and the least (12.4%) on Tuesday.
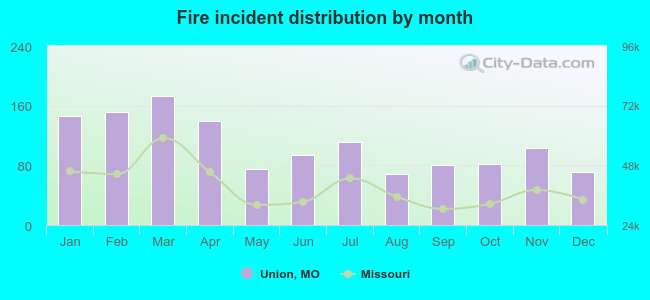 According to the 1,294 reports from years 2002 - 2018 most fires (13.4%) took place during March, and the least (5.3%) in August.
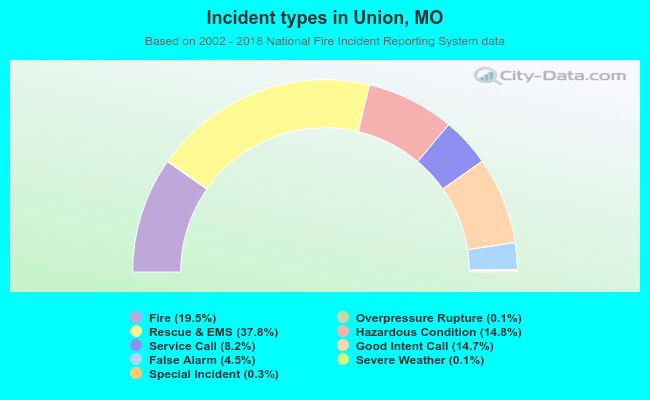 Out of all 6,648 cases reported during the years 2002 - 2018, the most belonged to the categories: Rescue & EMS (37.8%), Fire (19.5%), and Hazardous Condition (14.8%).
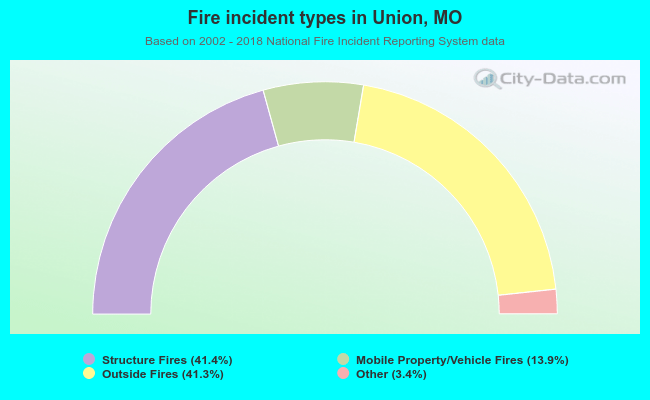 When looking into fire subcategories, the most incidents belonged to: Structure Fires (41.4%), and Outside Fires (41.3%).