Tonawanda: Fire Incidents, New York (NY)
Where are fire incidents reported in Tonawanda, NY
Something went wrong! Please refresh the page.
| Fire incidents reported | |
|---|---|
| Sreet name | Count |
| MAIN ST | 270 |
| YOUNG ST | 150 |
| SHERIDAN DR | 120 |
| RIVER RD | 106 |
| NIAGARA ST | 104 |
| DELAWARE ST | 96 |
| FLETCHER ST | 82 |
| KENMORE AVE | 68 |
| FILLMORE AVE | 64 |
| BROAD ST | 56 |
| SAWYER AVE | 54 |
| MILITARY RD | 48 |
| MORGAN ST | 42 |
| RIVER ROAD | 40 |
| SHERIDAN DRIVE | 40 |
| ADAM ST | 36 |
| NIAGARA FALLS BLVD | 34 |
| GIBSON ST | 32 |
| SHERIDAN DR | 32 |
| HINDS ST | 28 |
| WHEELER ST | 28 |
| SHERIDAN | 26 |
| TONAWANDA ST | 24 |
| EAST NIAGARA ST | 22 |
| KOHLER ST | 22 |
| NIAGARA FALLS BLVD | 22 |
| WILLIAM ST | 22 |
| MAIN | 20 |
| RAINTREE ISLAND | 20 |
| DELAWARE | 18 |
| Other | 237 |
2002 - 2018 National Fire Incident Reporting System (NFIRS) incidents
- Incident types reported to NFIRS in Tonawanda, NY
- 8,69838.5%Rescue & EMS
- 4,03017.8%Service Call
- 3,56415.8%Hazardous Condition
- 2,98813.2%False Alarm
- 1,9638.7%Fire
- 1,2065.3%Good Intent Call
- 780.3%Special Incident
- 350.2%Severe Weather
- 330.1%Overpressure Rupture
- Fire incident types reported to NFIRS in Tonawanda, NY
- 79840.7%Structure Fires
- 65833.5%Outside Fires
- 30215.4%Mobile Property/Vehicle Fires
- 20510.4%Other
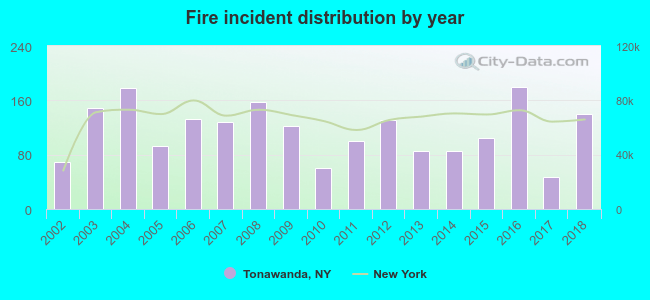 According to the data from the years 2002 - 2018 the average number of fires per year is 115. The highest number of reported fire incidents - 179 took place in 2016, and the least - 47 in 2017. The data has an increasing trend.
The average number of yearly fire incidents per 10k residents in Tonawanda, NY compared to nearest cities:
(Note: Based on data for the last 3 years, including only cities with population 5,000 and above)
| Tonawanda: | 81.5 |
| North Tonawanda: | 27.1 |
| Kenmore: | 21.9 |
| Grand Island: | 26.7 |
| Eggertsville: | 1.0 |
| Amherst: | 14.9 |
| Buffalo: | 16.1 |
| Williamsville: | 100.3 |
| Pendleton: | 1.6 |
 The median response time based on all reported fire incidents is 2 minutes. This is much lower than the New York median value.
The median response time in Tonawanda, NY compared to nearest cities:
(Note: Based on data for all years, including only cities with at least 500 fire incidents)
| Tonawanda: | 2 minutes |
| North Tonawanda: | 3 minutes |
| Kenmore: | 2 minutes |
| Grand Island: | 4 minutes |
| Amherst: | 4 minutes |
| Buffalo: | 3 minutes |
| Williamsville: | 4 minutes |
| Cheektowaga: | 4 minutes |
| Niagara Falls: | 3 minutes |
 According to the data from the years 2002 - 2018 the average number of fire-related fatalities per year is 0. The highest number of deaths - 2 took place in 2011, and the lowest - 0 in 2002. The data has a growing trend.
 According to the reports from the years 2002 - 2018 the average number of fire-related casualties per year is 2. The highest number of injuries - 8 took place in 2006, and the lowest - 0 in 2009. The data has a rising trend.
The average number of injuries per 1,000 fires is 21. This indicator was the highest - 60 in 2006, and the lowest 0 in 2009. The trend for casualties per 1,000 incidents is rising. Compared to the New York value the number of casualties per 1,000 fires is much higher.
According to the reports from the years 2002 - 2018 the average number of fire-related casualties per year is 2. The highest number of injuries - 8 took place in 2006, and the lowest - 0 in 2009. The data has a rising trend.
The average number of injuries per 1,000 fires is 21. This indicator was the highest - 60 in 2006, and the lowest 0 in 2009. The trend for casualties per 1,000 incidents is rising. Compared to the New York value the number of casualties per 1,000 fires is much higher.Casualties per 1,000 incidents in Tonawanda, NY compared to nearest cities:
(Note: Based on data for all years, including only cities with at least 500 fire incidents)
| Tonawanda: | 20.9 |
| North Tonawanda: | 7.9 |
| Kenmore: | 35.6 |
| Grand Island: | 8.1 |
| Amherst: | 6.6 |
| Buffalo: | 5.5 |
| Williamsville: | 3.3 |
| Cheektowaga: | 9.8 |
| Niagara Falls: | 22.3 |
 32.4% incidents where reported in the morning and 67.6% in the evening. The most fires (16.1%) took place on Monday, and the least (11.9%) on Thursday.
 Based on the 1,963 fire incident reports from years 2002 - 2018 most fires (12.1%) took place during July, and the least (5.6%) in February.
 Out of all 22,595 cases reported during the years 2002 - 2018, the most belonged to the categories: Rescue & EMS (38.5%), Service Call (17.8%), and Hazardous Condition (15.8%).
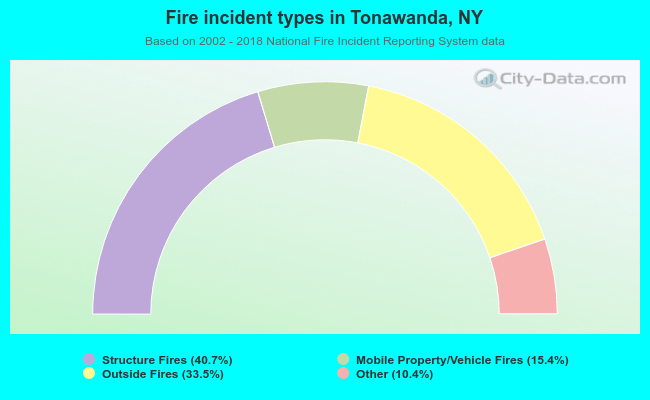 When looking into fire subcategories, the most reports belonged to: Structure Fires (40.7%), and Outside Fires (33.5%).